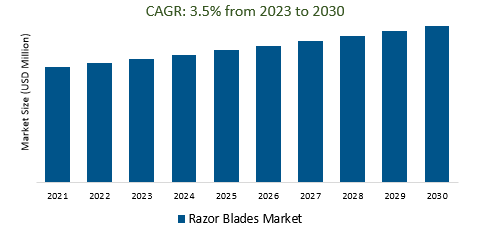
The Global Razor Blades Market Size is estimated to register 3.5% growth over the forecast period from 2023 to 2030.
The market growth is driven by an increasing focus on personal grooming and appearance, including facial and body hair management, and continues to drive demand for razor blades. Leading Companies focusing on Subscription Models and Online Sales, Personalization and Customization, Influencer and Social Media Marketing, Health and Hygiene Concerns, Influencer and Social Media Marketing, Branding and Marketing, Branding and Marketing, and others to boost market shares in the industry.
Razor Blades Market Overview
The global razor blades market is highly competitive and dynamic, driven by sustainability concerns, the rise of subscription models, and e-commerce sales. Major players like Gillette and Schick face competition from emerging direct-to-consumer brands. Sustainability, technological advancements, and personalization features are pivotal trends, while influencer marketing plays a significant role in shaping consumer preferences. The future outlook emphasizes eco-friendly products, continued growth in subscription models, and further technological advancements, with a focus on expanding into emerging markets and adapting to evolving consumer preferences.
Razor Blades Market Dynamics
Market Trends- Gender-neutral razor blades are becoming increasingly popular, as consumers are looking for products that are not specifically marketed to one gender or the other
Gender-neutral razor blades are on the rise in the market, driven by evolving consumer preferences and a desire for inclusivity. Brands are moving away from traditional gender-specific marketing, recognizing that shaving is a universal practice. This trend reflects a broader societal shift towards equality and accessibility in personal care products. Razor blade manufacturers are expected to continue embracing this trend by offering gender-neutral products, making them more appealing to a diverse consumer base.
Market Driver- Consumers are increasingly demanding premium and customizable razor blades, as they want a more personalized and luxurious shaving experience
Consumer preferences in the razor blades market are evolving, with a growing demand for premium and customizable options. In response to this trend, manufacturers are offering higher-end razor blades that provide a luxurious and personalized shaving experience. These products often feature advanced blade technology, ergonomic designs, and customizable features, allowing users to tailor their shaving experience to their liking. The shift towards premium and customizable razors is driven by consumers seeking a higher level of comfort, precision, and satisfaction in their grooming routines. This trend underscores the importance of meeting the diverse and discerning needs of today's consumers, who are willing to invest in quality shaving products that not only provide a superior shave but also reflect their individual preferences and lifestyles.
Market Opportunity- The introduction of sustainable and eco-friendly razor blades is a growing trend in the razor blades market
The razor blades market is experiencing a significant trend towards sustainability and eco-friendliness, driven by growing consumer demand for environmentally conscious products. Manufacturers are responding by developing eco-friendly razor blades using recyclable or biodegradable materials, reducing plastic waste, and adopting sustainable production practices. This trend mirrors a broader shift in the personal care industry towards greener and socially responsible products, with a focus on eco-friendly packaging and marketing. As consumers prioritize sustainability, the market for eco-friendly razor blades is expected to expand, providing both ecological benefits and opportunities for brands to meet consumer expectations.
Market Share Analysis- Double Edge Razor Blades Market will register the fastest growth
The Global Razor Blades Market is analyzed across Single Edge, Double Edge, By Material, Carbon Steel, Stainless Steel, and others Double Edge is poised to register the fastest growth. The double-edge razor blades market is a niche segment within the razor industry, primarily serving enthusiasts of traditional wet shaving. It has experienced growth due to the resurgence of traditional shaving methods, sustainability concerns, and the perception of higher quality. Although it remains a smaller market, the future outlook suggests continued growth, especially among consumers who value the traditional shaving experience and sustainability. Artisanal and specialty blades are expected to attract niche markets within this segment.
Market Share Analysis- Men held a significant market share in 2023
The Global Razor Blades Market is analyzed across various End Users including Men, Women, and others. Of these, Men held a significant market share in 2023. The men's razor blades market is a significant segment within the razor industry, catering to men's shaving needs with various razor types, including cartridge razors and safety razors. It's driven by constant innovation in blade technology, design, and features, with a growing focus on sustainability and customization. Prominent brands like Gillette and Schick are key players in this market, and it is expected to continue evolving in response to changing consumer preferences and advancements in technology. For the most up-to-date insights, consulting recent industry reports is recommended.
Razor Blades Market Segmentation
By Type
- Single Edge
- Double Edge
- By Material
- Carbon Steel
- Stainless Steel
By End-User
By Distribution Channel
By Region
- North America (United States, Canada, Mexico)
- Europe (Germany, France, United Kingdom, Spain, Italy, Others)
- Asia Pacific (China, India, Japan, South Korea, Australia, Others)
- Latin America (Brazil, Argentina, Others)
- Middle East and Africa (Saudi Arabia, UAE, Kuwait, Other Middle East, South Africa, Nigeria, Other Africa)
Razor Blades Market Companies
- Feather Safety Razor Co ltd
- Kai Company Ltd
- Malhotra
- Dorco
- Kaili Razor
- Lord International Co
- Procter & Gamble
- Supermax
- BIC
- Edgewell
*List not exhaustive
Razor Blades Market Outlook 2023
1 Market Overview
1.1 Introduction to the Razor Blades Market
1.2 Scope of the Study
1.3 Research Objective
1.3.1 Key Market Scope and Segments
1.3.2 Players Covered
1.3.3 Years Considered
2 Executive Summary
2.1 2023 Razor Blades Industry- Market Statistics
3 Market Dynamics
3.1 Market Drivers
3.2 Market Challenges
3.3 Market Opportunities
3.4 Market Trends
4 Market Factor Analysis
4.1 Porter’s Five Forces
4.2 Market Entropy
4.2.1 Global Razor Blades Market Companies with Area Served
4.2.2 Products Offerings Global Razor Blades Market
5 COVID-19 Impact Analysis and Outlook Scenarios
5.1.1 Covid-19 Impact Analysis
5.1.2 post-COVID-19 Scenario- Low Growth Case
5.1.3 post-COVID-19 Scenario- Reference Growth Case
5.1.4 post-COVID-19 Scenario- Low Growth Case
6 Global Razor Blades Market Trends
6.1 Global Razor Blades Revenue (USD Million) and CAGR (%) by Type (2018-2030)
6.2 Global Razor Blades Revenue (USD Million) and CAGR (%) by Applications (2018-2030)
6.3 Global Razor Blades Revenue (USD Million) and CAGR (%) by regions (2018-2030)
7 Global Razor Blades Market Revenue (USD Million) by Type, and Applications (2018-2022)
7.1 Global Razor Blades Revenue (USD Million) by Type (2018-2022)
7.1.1 Global Razor Blades Revenue (USD Million), Market Share (%) by Type (2018-2022)
7.2 Global Razor Blades Revenue (USD Million) by Applications (2018-2022)
7.2.1 Global Razor Blades Revenue (USD Million), Market Share (%) by Applications (2018-2022)
8 Global Razor Blades Development Regional Status and Outlook
8.1 Global Razor Blades Revenue (USD Million) By Regions (2018-2022)
8.2 North America Razor Blades Revenue (USD Million) by Type, and Application (2018-2022)
8.2.1 North America Razor Blades Revenue (USD Million) by Country (2018-2022)
8.2.2 North America Razor Blades Revenue (USD Million) by Type (2018-2022)
8.2.3 North America Razor Blades Revenue (USD Million) by Applications (2018-2022)
8.3 Europe Razor Blades Revenue (USD Million), by Type, and Applications (USD Million) (2018-2022)
8.3.1 Europe Razor Blades Revenue (USD Million), by Country (2018-2022)
8.3.2 Europe Razor Blades Revenue (USD Million) by Type (2018-2022)
8.3.3 Europe Razor Blades Revenue (USD Million) by Applications (2018-2022)
8.4 Asia Pacific Razor Blades Revenue (USD Million), and Revenue (USD Million) by Type, and Applications (2018-2022)
8.4.1 Asia Pacific Razor Blades Revenue (USD Million) by Country (2018-2022)
8.4.2 Asia Pacific Razor Blades Revenue (USD Million) by Type (2018-2022)
8.4.3 Asia Pacific Razor Blades Revenue (USD Million) by Applications (2018-2022)
8.5 South America Razor Blades Revenue (USD Million), by Type, and Applications (2018-2022)
8.5.1 South America Razor Blades Revenue (USD Million), by Country (2018-2022)
8.5.2 South America Razor Blades Revenue (USD Million) by Type (2018-2022)
8.5.3 South America Razor Blades Revenue (USD Million) by Applications (2018-2022)
8.6 Middle East and Africa Razor Blades Revenue (USD Million), by Type, Technology, Application, Thickness (2018-2022)
8.6.1 Middle East and Africa Razor Blades Revenue (USD Million) by Country (2018-2022)
8.6.2 Middle East and Africa Razor Blades Revenue (USD Million) by Type (2018-2022)
8.6.3 Middle East and Africa Razor Blades Revenue (USD Million) by Applications (2018-2022)
9 Company Profiles
10 Global Razor Blades Market Revenue (USD Million), by Type, and Applications (2023-2030)
10.1 Global Razor Blades Revenue (USD Million) and Market Share (%) by Type (2023-2030)
10.1.1 Global Razor Blades Revenue (USD Million), and Market Share (%) by Type (2023-2030)
10.2 Global Razor Blades Revenue (USD Million) and Market Share (%) by Applications (2023-2030)
10.2.1 Global Razor Blades Revenue (USD Million), and Market Share (%) by Applications (2023-2030)
11 Global Razor Blades Development Regional Status and Outlook Forecast
11.1 Global Razor Blades Revenue (USD Million) By Regions (2023-2030)
11.2 North America Razor Blades Revenue (USD Million) by Type, and Applications (2023-2030)
11.2.1 North America Razor Blades Revenue (USD) Million by Country (2023-2030)
11.2.2 North America Razor Blades Revenue (USD Million), by Type (2023-2030)
11.2.3 North America Razor Blades Revenue (USD Million), Market Share (%) by Applications (2023-2030)
11.3 Europe Razor Blades Revenue (USD Million), by Type, and Applications (2023-2030)
11.3.1 Europe Razor Blades Revenue (USD Million), by Country (2023-2030)
11.3.2 Europe Razor Blades Revenue (USD Million), by Type (2023-2030)
11.3.3 Europe Razor Blades Revenue (USD Million), by Applications (2023-2030)
11.4 Asia Pacific Razor Blades Revenue (USD Million) by Type, and Applications (2023-2030)
11.4.1 Asia Pacific Razor Blades Revenue (USD Million), by Country (2023-2030)
11.4.2 Asia Pacific Razor Blades Revenue (USD Million), by Type (2023-2030)
11.4.3 Asia Pacific Razor Blades Revenue (USD Million), by Applications (2023-2030)
11.5 South America Razor Blades Revenue (USD Million), by Type, and Applications (2023-2030)
11.5.1 South America Razor Blades Revenue (USD Million), by Country (2023-2030)
11.5.2 South America Razor Blades Revenue (USD Million), by Type (2023-2030)
11.5.3 South America Razor Blades Revenue (USD Million), by Applications (2023-2030)
11.6 Middle East and Africa Razor Blades Revenue (USD Million), by Type, and Applications (2023-2030)
11.6.1 Middle East and Africa Razor Blades Revenue (USD Million), by region (2023-2030)
11.6.2 Middle East and Africa Razor Blades Revenue (USD Million), by Type (2023-2030)
11.6.3 Middle East and Africa Razor Blades Revenue (USD Million), by Applications (2023-2030)
12 Methodology and Data Sources
12.1 Methodology/Research Approach
12.1.1 Research Programs/Design
12.1.2 Market Size Estimation
12.1.3 Market Breakdown and Data Triangulation
12.2 Data Sources
12.2.1 Secondary Sources
12.2.2 Primary Sources
12.3 Disclaimer
List of Tables
Table 1 Market Segmentation Analysis
Table 2 Global Razor Blades Market Companies with Areas Served
Table 3 Products Offerings Global Razor Blades Market
Table 4 Low Growth Scenario Forecasts
Table 5 Reference Case Growth Scenario
Table 6 High Growth Case Scenario
Table 7 Global Razor Blades Revenue (USD Million) And CAGR (%) By Type (2018-2030)
Table 8 Global Razor Blades Revenue (USD Million) And CAGR (%) By Applications (2018-2030)
Table 9 Global Razor Blades Revenue (USD Million) And CAGR (%) By Regions (2018-2030)
Table 10 Global Razor Blades Revenue (USD Million) By Type (2018-2022)
Table 11 Global Razor Blades Revenue Market Share (%) By Type (2018-2022)
Table 12 Global Razor Blades Revenue (USD Million) By Applications (2018-2022)
Table 13 Global Razor Blades Revenue Market Share (%) By Applications (2018-2022)
Table 14 Global Razor Blades Market Revenue (USD Million) By Regions (2018-2022)
Table 15 Global Razor Blades Market Share (%) By Regions (2018-2022)
Table 16 North America Razor Blades Revenue (USD Million) By Country (2018-2022)
Table 17 North America Razor Blades Revenue (USD Million) By Type (2018-2022)
Table 18 North America Razor Blades Revenue (USD Million) By Applications (2018-2022)
Table 19 Europe Razor Blades Revenue (USD Million) By Country (2018-2022)
Table 20 Europe Razor Blades Revenue (USD Million) By Type (2018-2022)
Table 21 Europe Razor Blades Revenue (USD Million) By Applications (2018-2022)
Table 22 Asia Pacific Razor Blades Revenue (USD Million) By Country (2018-2022)
Table 23 Asia Pacific Razor Blades Revenue (USD Million) By Type (2018-2022)
Table 24 Asia Pacific Razor Blades Revenue (USD Million) By Applications (2018-2022)
Table 25 South America Razor Blades Revenue (USD Million) By Country (2018-2022)
Table 26 South America Razor Blades Revenue (USD Million) By Type (2018-2022)
Table 27 South America Razor Blades Revenue (USD Million) By Applications (2018-2022)
Table 28 Middle East and Africa Razor Blades Revenue (USD Million) By Region (2018-2022)
Table 29 Middle East and Africa Razor Blades Revenue (USD Million) By Type (2018-2022)
Table 30 Middle East and Africa Razor Blades Revenue (USD Million) By Applications (2018-2022)
Table 31 Financial Analysis
Table 32 Global Razor Blades Revenue (USD Million) By Type (2023-2030)
Table 33 Global Razor Blades Revenue Market Share (%) By Type (2023-2030)
Table 34 Global Razor Blades Revenue (USD Million) By Applications (2023-2030)
Table 35 Global Razor Blades Revenue Market Share (%) By Applications (2023-2030)
Table 36 Global Razor Blades Market Revenue (USD Million), And Revenue (USD Million) By Regions (2023-2030)
Table 37 North America Razor Blades Revenue (USD)By Country (2023-2030)
Table 38 North America Razor Blades Revenue (USD Million) By Type (2023-2030)
Table 39 North America Razor Blades Revenue (USD Million) By Applications (2023-2030)
Table 40 Europe Razor Blades Revenue (USD Million) By Country (2023-2030)
Table 41 Europe Razor Blades Revenue (USD Million) By Type (2023-2030)
Table 42 Europe Razor Blades Revenue (USD Million) By Applications (2023-2030)
Table 43 Asia Pacific Razor Blades Revenue (USD Million) By Country (2023-2030)
Table 44 Asia Pacific Razor Blades Revenue (USD Million) By Type (2023-2030)
Table 45 Asia Pacific Razor Blades Revenue (USD Million) By Applications (2023-2030)
Table 46 South America Razor Blades Revenue (USD Million) By Country (2023-2030)
Table 47 South America Razor Blades Revenue (USD Million) By Type (2023-2030)
Table 48 South America Razor Blades Revenue (USD Million) By Applications (2023-2030)
Table 49 Middle East and Africa Razor Blades Revenue (USD Million) By Region (2023-2030)
Table 50 Middle East and Africa Razor Blades Revenue (USD Million) By Region (2023-2030)
Table 51 Middle East and Africa Razor Blades Revenue (USD Million) By Type (2023-2030)
Table 52 Middle East and Africa Razor Blades Revenue (USD Million) By Applications (2023-2030)
Table 53 Research Programs/Design for This Report
Table 54 Key Data Information from Secondary Sources
Table 55 Key Data Information from Primary Sources
List of Figures
Figure 1 Market Scope
Figure 2 Porter’s Five Forces
Figure 3 Global Razor Blades Revenue (USD Million) By Type (2018-2022)
Figure 4 Global Razor Blades Revenue Market Share (%) By Type (2022)
Figure 5 Global Razor Blades Revenue (USD Million) By Applications (2018-2022)
Figure 6 Global Razor Blades Revenue Market Share (%) By Applications (2022)
Figure 7 Global Razor Blades Market Revenue (USD Million) By Regions (2018-2022)
Figure 8 Global Razor Blades Market Share (%) By Regions (2022)
Figure 9 North America Razor Blades Revenue (USD Million) By Country (2018-2022)
Figure 10 North America Razor Blades Revenue (USD Million) By Type (2018-2022)
Figure 11 North America Razor Blades Revenue (USD Million) By Applications (2018-2022)
Figure 12 Europe Razor Blades Revenue (USD Million) By Country (2018-2022)
Figure 13 Europe Razor Blades Revenue (USD Million) By Type (2018-2022)
Figure 14 Europe Razor Blades Revenue (USD Million) By Applications (2018-2022)
Figure 15 Asia Pacific Razor Blades Revenue (USD Million) By Country (2018-2022)
Figure 16 Asia Pacific Razor Blades Revenue (USD Million) By Type (2018-2022)
Figure 17 Asia Pacific Razor Blades Revenue (USD Million) By Applications (2018-2022)
Figure 18 South America Razor Blades Revenue (USD Million) By Country (2018-2022)
Figure 19 South America Razor Blades Revenue (USD Million) By Type (2018-2022)
Figure 20 South America Razor Blades Revenue (USD Million) By Applications (2018-2022)
Figure 21 Middle East and Africa Razor Blades Revenue (USD Million) By Region (2018-2022)
Figure 22 Middle East and Africa Razor Blades Revenue (USD Million) By Type (2018-2022)
Figure 23 Middle East and Africa Razor Blades Revenue (USD Million) By Applications (2018-2022)
Figure 24 Global Razor Blades Revenue (USD Million) By Type (2023-2030)
Figure 25 Global Razor Blades Revenue Market Share (%) By Type (2030)
Figure 26 Global Razor Blades Revenue (USD Million) By Applications (2023-2030)
Figure 27 Global Razor Blades Revenue Market Share (%) By Applications (2030)
Figure 28 Global Razor Blades Market Revenue (USD Million) By Regions (2023-2030)
Figure 29 North America Razor Blades Revenue (USD Million) By Country (2023-2030)
Figure 30 North America Razor Blades Revenue (USD Million) By Type (2023-2030)
Figure 31 North America Razor Blades Revenue (USD Million) By Applications (2023-2030)
Figure 32 Europe Razor Blades Revenue (USD Million) By Country (2023-2030)
Figure 33 Europe Razor Blades Revenue (USD Million) By Type (2023-2030)
Figure 34 Europe Razor Blades Revenue (USD Million) By Applications (2023-2030)
Figure 35 Asia Pacific Razor Blades Revenue (USD Million) By Country (2023-2030)
Figure 36 Asia Pacific Razor Blades Revenue (USD Million) By Type (2023-2030)
Figure 37 Asia Pacific Razor Blades Revenue (USD Million) By Applications (2023-2030)
Figure 38 South America Razor Blades Revenue (USD Million) By Country (2023-2030)
Figure 39 South America Razor Blades Revenue (USD Million) By Type (2023-2030)
Figure 40 South America Razor Blades Revenue (USD Million) By Applications (2023-2030)
Figure 41 Middle East and Africa Razor Blades Revenue (USD Million) By Region (2023-2030)
Figure 42 Middle East and Africa Razor Blades Revenue (USD Million) By Region (2023-2030)
Figure 43 Middle East and Africa Razor Blades Revenue (USD Million) By Type (2023-2030)
Figure 44 Middle East and Africa Razor Blades Revenue (USD Million) By Applications (2023-2030)
Figure 45 Bottom-Up and Top-Down Approaches for This Report
Figure 46 Data Triangulation
