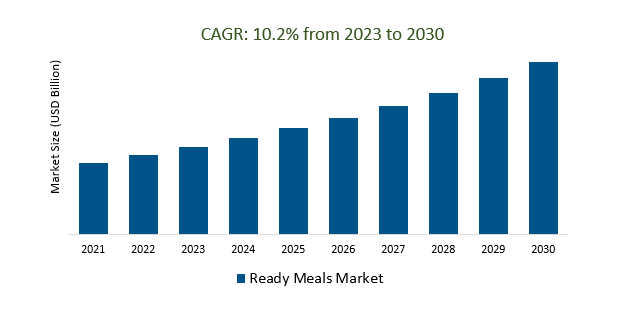
The Global Ready Meals Market Size is estimated to register 10.2% growth over the forecast period from 2023 to 2030.
Market growth is propelled by a surge in technology integration, with online ordering, food delivery apps, and meal kit subscriptions facilitating consumer access to an extensive range of ready-meal choices. Furthermore, advancements in food preparation technology, such as microwaveable and oven-ready packaging, enhance both convenience and cooking efficiency, contributing significantly to the expansion of the ready meals market. Leading Companies focusing on Functional and Nutritional Enhancement, Plant-Based and Alternative Proteins, Smart Packaging and IoT Integration, Personalized Nutrition, Sustainable Sourcing and Ethical Practices, and others to boost market shares in the industry.
Market Overview
The Ready Meals Market provides consumers with convenient, pre-packaged meal options suitable for busy lifestyles. It offers diverse, nutritionally improved, and sustainable products with a focus on customization, global expansion, e-commerce integration, and adherence to food safety standards. The market is highly competitive, and it continually evolves to cater to changing dietary preferences and consumer demands.
Market Dynamics
Market Trends- Busy consumers are increasingly turning to ready meals as a convenient and healthy option to fit their fast-paced lifestyles.
Busy consumers are turning to ready meals due to their convenience and health-conscious features. These pre-packaged meals accommodate fast-paced lifestyles and diverse dietary preferences, offering options like low-sodium and plant-based choices. With clean ingredients and reduced additives, they provide a balanced and hassle-free dining solution for health-conscious individuals.
Market Driver- Health-conscious consumers are driving the demand for ready meals that offer convenience and nutritional benefits.
The growing demand for ready meals is driven by health-conscious consumers who prioritize both convenience and nutritional benefits. In a fast-paced era where people are more conscious of their dietary choices, ready meals provide an attractive solution. These prepared meals address the needs of individuals who value their health, offering choices that are often low in sodium, reduced in saturated fats, and feature natural and organic ingredients. This trend mirrors the increasing desire for well-rounded, healthy dining options, as consumers search for swift and straightforward meal choices that support their health and wellness objectives.
Market Opportunity- Ready meals are expanding palates with a diverse range of global flavors, catering to adventurous eaters seeking culinary experiences from around the world.
Ready meals are expanding culinary horizons and enticing adventurous eaters with an extensive selection of global flavors. These conveniently packaged meals serve as a gateway to a world of diverse cuisines, enabling consumers to enjoy authentic tastes from around the globe. Whether it's the fiery spices of Thai curries, the richness of Indian dishes, or the zest of Mexican cuisine, ready meals are bringing global culinary experiences to households. In response to the growing demand for diverse flavors, the ready meals market is diversifying its offerings, providing individuals with the opportunity to embark on a gastronomic adventure without stepping out of their homes.
Market Share Analysis- Chilled Ready Meals Market will register the fastest growth
The Global Ready Meals Market is analyzed across Frozen, Chilled, Canned, Shelf-stable, and others. Chilled is poised to register the fastest growth. The "Chilled Ready Meals Market" focuses on refrigerated, pre-prepared meals that offer convenience and freshness. These meals cater to busy consumers looking for quick, high-quality dining options and include a variety of cuisines and dietary preferences. Positioned as a premium and fresher alternative to frozen or shelf-stable options, the market emphasizes innovation, sustainability, and digital integration to meet evolving consumer demands.
Market Share Analysis- Vegetarians held a significant market share in 2023
The Global Ready Meals Market is analyzed across various Meal Types including Vegetarian, Non-vegetarian, Vegan, and others. Of these, Vegetarian held a significant market share in 2023. The "Vegetarian Ready Meals Market" is a specialized segment offering plant-based, pre-packaged meal options for vegetarians and vegans. It caters to individuals who follow a meat-free diet, providing convenience, nutrition, and a variety of culinary experiences. The market responds to the growing demand for plant-based options, with an emphasis on sustainability and satisfying dietary preferences of those who prioritize both health and the environment.
Ready Meals Market News
Caroli Foods Group Introduces Innovative Chilled Ready Meals with Micvac Technology to Meet Growing Customer Demand.
Instacart Debuts Ready Meals Hub: Over 4,100 Stores in 35 States Offer Convenient In-App Options.
Israeli Food Tech Startup Anina Introduces Ready Meals from Upcycled Vegetables
Ready Meals Market Segmentation
By Type
- Frozen
- Chilled
- Canned
- Shelf-stable
By Meal Type
- Vegetarian
- Non-vegetarian
- Vegan
By Distribution Channel
- Supermarkets & Hypermarkets
- Convenience Stores
- Online
- Others
By Region
- North America (United States, Canada, Mexico)
- Europe (Germany, France, United Kingdom, Spain, Italy, Others)
- Asia Pacific (China, India, Japan, South Korea, Australia, Others)
- Latin America (Brazil, Argentina, Others)
- Middle East and Africa (Saudi Arabia, UAE, Kuwait, Other Middle East, South Africa, Nigeria, Other Africa)
Ready Meals Market Companies
- Kellogg Company
- Nestlé
- General Mills Inc
- Conagra Brands Inc
- Dr. Oetker
- Nomad Foods
- 2 Sisters Food Group
- Green Mill Foods
- Unilever
- Tyson Foods Inc
*List not exhaustive
Ready Meals Market Outlook 2023
1 Market Overview
1.1 Introduction to the Ready Meals Market
1.2 Scope of the Study
1.3 Research Objective
1.3.1 Key Market Scope and Segments
1.3.2 Players Covered
1.3.3 Years Considered
2 Executive Summary
2.1 2023 Ready Meals Industry- Market Statistics
3 Market Dynamics
3.1 Market Drivers
3.2 Market Challenges
3.3 Market Opportunities
3.4 Market Trends
4 Market Factor Analysis
4.1 Porter’s Five Forces
4.2 Market Entropy
4.2.1 Global Ready Meals Market Companies with Area Served
4.2.2 Products Offerings Global Ready Meals Market
5 COVID-19 Impact Analysis and Outlook Scenarios
5.1.1 Covid-19 Impact Analysis
5.1.2 Post-COVID-19 Scenario- Low Growth Case
5.1.3 Post-COVID-19 Scenario- Reference Growth Case
5.1.4 Post-COVID-19 Scenario- Low Growth Case
6 Global Ready Meals Market Trends
6.1 Global Ready Meals Revenue (USD Million) and CAGR (%) by Type (2018-2030)
6.2 Global Ready Meals Revenue (USD Million) and CAGR (%) by Applications (2018-2030)
6.3 Global Ready Meals Revenue (USD Million) and CAGR (%) by Regions (2018-2030)
7 Global Ready Meals Market Revenue (USD Million) by Type, and Applications (2018-2022)
7.1 Global Ready Meals Revenue (USD Million) by Type (2018-2022)
7.1.1 Global Ready Meals Revenue (USD Million), Market Share (%) by Type (2018-2022)
7.2 Global Ready Meals Revenue (USD Million) by Applications (2018-2022)
7.2.1 Global Ready Meals Revenue (USD Million), Market Share (%) by Applications (2018-2022)
8 Global Ready Meals Development Regional Status and Outlook
8.1 Global Ready Meals Revenue (USD Million) By Regions (2018-2022)
8.2 North America Ready Meals Revenue (USD Million) by Type, and Application (2018-2022)
8.2.1 North America Ready Meals Revenue (USD Million) by Country (2018-2022)
8.2.2 North America Ready Meals Revenue (USD Million) by Type (2018-2022)
8.2.3 North America Ready Meals Revenue (USD Million) by Applications (2018-2022)
8.3 Europe Ready Meals Revenue (USD Million), by Type, and Applications (USD Million) (2018-2022)
8.3.1 Europe Ready Meals Revenue (USD Million), by Country (2018-2022)
8.3.2 Europe Ready Meals Revenue (USD Million) by Type (2018-2022)
8.3.3 Europe Ready Meals Revenue (USD Million) by Applications (2018-2022)
8.4 Asia Pacific Ready Meals Revenue (USD Million), and Revenue (USD Million) by Type, and Applications (2018-2022)
8.4.1 Asia Pacific Ready Meals Revenue (USD Million) by Country (2018-2022)
8.4.2 Asia Pacific Ready Meals Revenue (USD Million) by Type (2018-2022)
8.4.3 Asia Pacific Ready Meals Revenue (USD Million) by Applications (2018-2022)
8.5 South America Ready Meals Revenue (USD Million), by Type, and Applications (2018-2022)
8.5.1 South America Ready Meals Revenue (USD Million), by Country (2018-2022)
8.5.2 South America Ready Meals Revenue (USD Million) by Type (2018-2022)
8.5.3 South America Ready Meals Revenue (USD Million) by Applications (2018-2022)
8.6 Middle East and Africa Ready Meals Revenue (USD Million), by Type, Technology, Application, Thickness (2018-2022)
8.6.1 Middle East and Africa Ready Meals Revenue (USD Million) by Country (2018-2022)
8.6.2 Middle East and Africa Ready Meals Revenue (USD Million) by Type (2018-2022)
8.6.3 Middle East and Africa Ready Meals Revenue (USD Million) by Applications (2018-2022)
9 Company Profiles
10 Global Ready Meals Market Revenue (USD Million), by Type, and Applications (2023-2030)
10.1 Global Ready Meals Revenue (USD Million) and Market Share (%) by Type (2023-2030)
10.1.1 Global Ready Meals Revenue (USD Million), and Market Share (%) by Type (2023-2030)
10.2 Global Ready Meals Revenue (USD Million) and Market Share (%) by Applications (2023-2030)
10.2.1 Global Ready Meals Revenue (USD Million), and Market Share (%) by Applications (2023-2030)
11 Global Ready Meals Development Regional Status and Outlook Forecast
11.1 Global Ready Meals Revenue (USD Million) By Regions (2023-2030)
11.2 North America Ready Meals Revenue (USD Million) by Type, and Applications (2023-2030)
11.2.1 North America Ready Meals Revenue (USD) Million by Country (2023-2030)
11.2.2 North America Ready Meals Revenue (USD Million), by Type (2023-2030)
11.2.3 North America Ready Meals Revenue (USD Million), Market Share (%) by Applications (2023-2030)
11.3 Europe Ready Meals Revenue (USD Million), by Type, and Applications (2023-2030)
11.3.1 Europe Ready Meals Revenue (USD Million), by Country (2023-2030)
11.3.2 Europe Ready Meals Revenue (USD Million), by Type (2023-2030)
11.3.3 Europe Ready Meals Revenue (USD Million), by Applications (2023-2030)
11.4 Asia Pacific Ready Meals Revenue (USD Million) by Type, and Applications (2023-2030)
11.4.1 Asia Pacific Ready Meals Revenue (USD Million), by Country (2023-2030)
11.4.2 Asia Pacific Ready Meals Revenue (USD Million), by Type (2023-2030)
11.4.3 Asia Pacific Ready Meals Revenue (USD Million), by Applications (2023-2030)
11.5 South America Ready Meals Revenue (USD Million), by Type, and Applications (2023-2030)
11.5.1 South America Ready Meals Revenue (USD Million), by Country (2023-2030)
11.5.2 South America Ready Meals Revenue (USD Million), by Type (2023-2030)
11.5.3 South America Ready Meals Revenue (USD Million), by Applications (2023-2030)
11.6 Middle East and Africa Ready Meals Revenue (USD Million), by Type, and Applications (2023-2030)
11.6.1 Middle East and Africa Ready Meals Revenue (USD Million), by Region (2023-2030)
11.6.2 Middle East and Africa Ready Meals Revenue (USD Million), by Type (2023-2030)
11.6.3 Middle East and Africa Ready Meals Revenue (USD Million), by Applications (2023-2030)
12 Methodology and Data Sources
12.1 Methodology/Research Approach
12.1.1 Research Programs/Design
12.1.2 Market Size Estimation
12.1.3 Market Breakdown and Data Triangulation
12.2 Data Sources
12.2.1 Secondary Sources
12.2.2 Primary Sources
12.3 Disclaimer
List of Tables
Table 1 Market Segmentation Analysis
Table 2 Global Ready Meals Market Companies with Areas Served
Table 3 Products Offerings Global Ready Meals Market
Table 4 Low Growth Scenario Forecasts
Table 5 Reference Case Growth Scenario
Table 6 High Growth Case Scenario
Table 7 Global Ready Meals Revenue (USD Million) And CAGR (%) By Type (2018-2030)
Table 8 Global Ready Meals Revenue (USD Million) And CAGR (%) By Applications (2018-2030)
Table 9 Global Ready Meals Revenue (USD Million) And CAGR (%) By Regions (2018-2030)
Table 10 Global Ready Meals Revenue (USD Million) By Type (2018-2022)
Table 11 Global Ready Meals Revenue Market Share (%) By Type (2018-2022)
Table 12 Global Ready Meals Revenue (USD Million) By Applications (2018-2022)
Table 13 Global Ready Meals Revenue Market Share (%) By Applications (2018-2022)
Table 14 Global Ready Meals Market Revenue (USD Million) By Regions (2018-2022)
Table 15 Global Ready Meals Market Share (%) By Regions (2018-2022)
Table 16 North America Ready Meals Revenue (USD Million) By Country (2018-2022)
Table 17 North America Ready Meals Revenue (USD Million) By Type (2018-2022)
Table 18 North America Ready Meals Revenue (USD Million) By Applications (2018-2022)
Table 19 Europe Ready Meals Revenue (USD Million) By Country (2018-2022)
Table 20 Europe Ready Meals Revenue (USD Million) By Type (2018-2022)
Table 21 Europe Ready Meals Revenue (USD Million) By Applications (2018-2022)
Table 22 Asia Pacific Ready Meals Revenue (USD Million) By Country (2018-2022)
Table 23 Asia Pacific Ready Meals Revenue (USD Million) By Type (2018-2022)
Table 24 Asia Pacific Ready Meals Revenue (USD Million) By Applications (2018-2022)
Table 25 South America Ready Meals Revenue (USD Million) By Country (2018-2022)
Table 26 South America Ready Meals Revenue (USD Million) By Type (2018-2022)
Table 27 South America Ready Meals Revenue (USD Million) By Applications (2018-2022)
Table 28 Middle East and Africa Ready Meals Revenue (USD Million) By Region (2018-2022)
Table 29 Middle East and Africa Ready Meals Revenue (USD Million) By Type (2018-2022)
Table 30 Middle East and Africa Ready Meals Revenue (USD Million) By Applications (2018-2022)
Table 31 Financial Analysis
Table 32 Global Ready Meals Revenue (USD Million) By Type (2023-2030)
Table 33 Global Ready Meals Revenue Market Share (%) By Type (2023-2030)
Table 34 Global Ready Meals Revenue (USD Million) By Applications (2023-2030)
Table 35 Global Ready Meals Revenue Market Share (%) By Applications (2023-2030)
Table 36 Global Ready Meals Market Revenue (USD Million), And Revenue (USD Million) By Regions (2023-2030)
Table 37 North America Ready Meals Revenue (USD)By Country (2023-2030)
Table 38 North America Ready Meals Revenue (USD Million) By Type (2023-2030)
Table 39 North America Ready Meals Revenue (USD Million) By Applications (2023-2030)
Table 40 Europe Ready Meals Revenue (USD Million) By Country (2023-2030)
Table 41 Europe Ready Meals Revenue (USD Million) By Type (2023-2030)
Table 42 Europe Ready Meals Revenue (USD Million) By Applications (2023-2030)
Table 43 Asia Pacific Ready Meals Revenue (USD Million) By Country (2023-2030)
Table 44 Asia Pacific Ready Meals Revenue (USD Million) By Type (2023-2030)
Table 45 Asia Pacific Ready Meals Revenue (USD Million) By Applications (2023-2030)
Table 46 South America Ready Meals Revenue (USD Million) By Country (2023-2030)
Table 47 South America Ready Meals Revenue (USD Million) By Type (2023-2030)
Table 48 South America Ready Meals Revenue (USD Million) By Applications (2023-2030)
Table 49 Middle East and Africa Ready Meals Revenue (USD Million) By Region (2023-2030)
Table 50 Middle East and Africa Ready Meals Revenue (USD Million) By Region (2023-2030)
Table 51 Middle East and Africa Ready Meals Revenue (USD Million) By Type (2023-2030)
Table 52 Middle East and Africa Ready Meals Revenue (USD Million) By Applications (2023-2030)
Table 53 Research Programs/Design for This Report
Table 54 Key Data Information from Secondary Sources
Table 55 Key Data Information from Primary Sources
List of Figures
Figure 1 Market Scope
Figure 2 Porter’s Five Forces
Figure 3 Global Ready Meals Revenue (USD Million) By Type (2018-2022)
Figure 4 Global Ready Meals Revenue Market Share (%) By Type (2022)
Figure 5 Global Ready Meals Revenue (USD Million) By Applications (2018-2022)
Figure 6 Global Ready Meals Revenue Market Share (%) By Applications (2022)
Figure 7 Global Ready Meals Market Revenue (USD Million) By Regions (2018-2022)
Figure 8 Global Ready Meals Market Share (%) By Regions (2022)
Figure 9 North America Ready Meals Revenue (USD Million) By Country (2018-2022)
Figure 10 North America Ready Meals Revenue (USD Million) By Type (2018-2022)
Figure 11 North America Ready Meals Revenue (USD Million) By Applications (2018-2022)
Figure 12 Europe Ready Meals Revenue (USD Million) By Country (2018-2022)
Figure 13 Europe Ready Meals Revenue (USD Million) By Type (2018-2022)
Figure 14 Europe Ready Meals Revenue (USD Million) By Applications (2018-2022)
Figure 15 Asia Pacific Ready Meals Revenue (USD Million) By Country (2018-2022)
Figure 16 Asia Pacific Ready Meals Revenue (USD Million) By Type (2018-2022)
Figure 17 Asia Pacific Ready Meals Revenue (USD Million) By Applications (2018-2022)
Figure 18 South America Ready Meals Revenue (USD Million) By Country (2018-2022)
Figure 19 South America Ready Meals Revenue (USD Million) By Type (2018-2022)
Figure 20 South America Ready Meals Revenue (USD Million) By Applications (2018-2022)
Figure 21 Middle East and Africa Ready Meals Revenue (USD Million) By Region (2018-2022)
Figure 22 Middle East and Africa Ready Meals Revenue (USD Million) By Type (2018-2022)
Figure 23 Middle East and Africa Ready Meals Revenue (USD Million) By Applications (2018-2022)
Figure 24 Global Ready Meals Revenue (USD Million) By Type (2023-2030)
Figure 25 Global Ready Meals Revenue Market Share (%) By Type (2030)
Figure 26 Global Ready Meals Revenue (USD Million) By Applications (2023-2030)
Figure 27 Global Ready Meals Revenue Market Share (%) By Applications (2030)
Figure 28 Global Ready Meals Market Revenue (USD Million) By Regions (2023-2030)
Figure 29 North America Ready Meals Revenue (USD Million) By Country (2023-2030)
Figure 30 North America Ready Meals Revenue (USD Million) By Type (2023-2030)
Figure 31 North America Ready Meals Revenue (USD Million) By Applications (2023-2030)
Figure 32 Europe Ready Meals Revenue (USD Million) By Country (2023-2030)
Figure 33 Europe Ready Meals Revenue (USD Million) By Type (2023-2030)
Figure 34 Europe Ready Meals Revenue (USD Million) By Applications (2023-2030)
Figure 35 Asia Pacific Ready Meals Revenue (USD Million) By Country (2023-2030)
Figure 36 Asia Pacific Ready Meals Revenue (USD Million) By Type (2023-2030)
Figure 37 Asia Pacific Ready Meals Revenue (USD Million) By Applications (2023-2030)
Figure 38 South America Ready Meals Revenue (USD Million) By Country (2023-2030)
Figure 39 South America Ready Meals Revenue (USD Million) By Type (2023-2030)
Figure 40 South America Ready Meals Revenue (USD Million) By Applications (2023-2030)
Figure 41 Middle East and Africa Ready Meals Revenue (USD Million) By Region (2023-2030)
Figure 42 Middle East and Africa Ready Meals Revenue (USD Million) By Region (2023-2030)
Figure 43 Middle East and Africa Ready Meals Revenue (USD Million) By Type (2023-2030)
Figure 44 Middle East and Africa Ready Meals Revenue (USD Million) By Applications (2023-2030)
Figure 45 Bottom-Up and Top-Down Approaches For This Report
Figure 46 Data Triangulation
