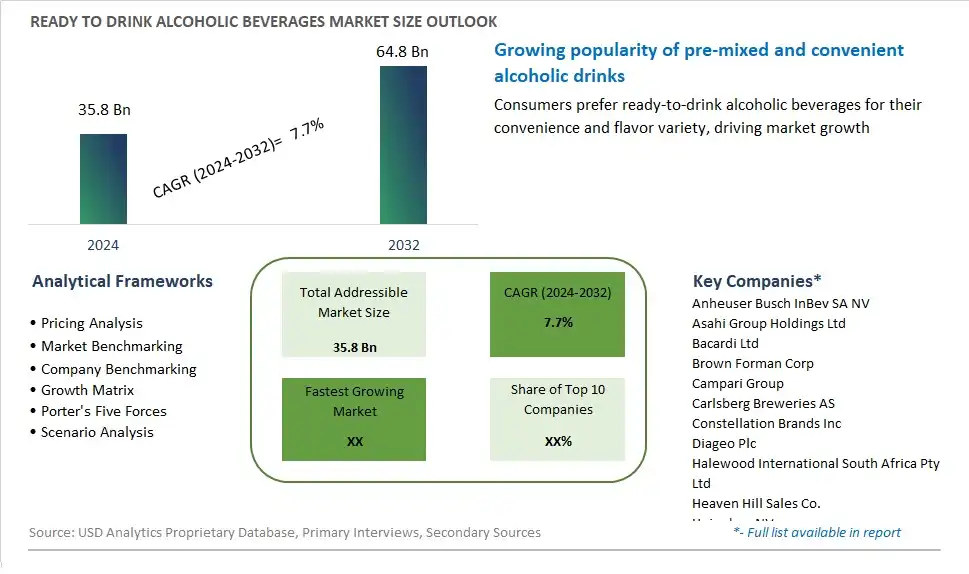
Global Ready to Drink Alcoholic Beverages Market Size is valued at $35.8 Billion in 2024 and is forecast to register a growth rate (CAGR) of 7.7% to reach $64.8 Billion by 2032.
The global Ready to Drink Alcoholic Beverages Market Comprehensive Study analyzes and forecasts the market size across 6 regions and 24 countries for diverse segments -By Packaging (Bottles, Cans, Others), By Distribution Channel (Off-trade, On-trade)
An Introduction to Ready to Drink Alcoholic Beverages Market
In 2024, the ready-to-drink (RTD) alcoholic beverages market is thriving, driven by the increasing preference for convenient, portable, and diverse drink options. RTD alcoholic beverages, including cocktails, hard seltzers, and pre-mixed spirits, are gaining popularity among younger consumers and those seeking new and exciting flavors. The market is characterized by innovation, with manufacturers experimenting with unique ingredients, natural flavors, and low-calorie options. The shift towards healthier lifestyles is also influencing the market, with a growing demand for low-alcohol and alcohol-free variants. Additionally, the rise of premium and craft RTD alcoholic beverages is appealing to discerning consumers looking for high-quality, ready-to-enjoy drinks.
Ready to Drink Alcoholic Beverages Competitive Landscape
The market report analyses the leading companies in the industry including Anheuser Busch InBev SA NV, Asahi Group Holdings Ltd, Bacardi Ltd, Brown Forman Corp, Campari Group, Carlsberg Breweries AS, Constellation Brands Inc, Diageo Plc, Halewood International South Africa Pty Ltd, Heaven Hill Sales Co., Heineken NV, Manchester Drinks Ltd, Mark Anthony Brands International Unlimited Co., MIKES HARD LEMONADE Co., Molson Coors Beverage Co., and Others.
Ready to Drink Alcoholic Beverages Market Dynamics
Ready to Drink Alcoholic Beverages Market Trend: Rising Popularity of Convenience and Socialization
A prominent market trend in the ready-to-drink alcoholic beverages segment is the increasing popularity of convenience and socialization. With changing lifestyles and busy schedules, consumers are seeking convenient options for enjoying alcoholic beverages without the need for extensive preparation or mixing. Ready-to-drink alcoholic beverages, such as canned cocktails, pre-mixed spirits, and wine coolers, cater to this demand by offering a hassle-free drinking experience that can be enjoyed on various occasions, whether at home, parties, picnics, or outdoor events. Furthermore, these products appeal to consumers who value convenience and prefer portable options for socializing with friends and family.
Market Driver: Shift Towards Premiumization and Crafted Offerings
The market driver for ready-to-drink alcoholic beverages is the shift towards premiumization and crafted offerings. As consumers become more discerning and sophisticated in their taste preferences, there is a growing demand for high-quality and artisanal beverages that offer unique flavor profiles and superior ingredients. Ready-to-drink brands are responding to this demand by introducing premium and craft options that use premium spirits, natural ingredients, and innovative flavor combinations to differentiate themselves in the market. This driver is fueled by the desire for elevated drinking experiences and the willingness of consumers to pay a premium for products that offer authenticity, craftsmanship, and superior taste.
Market Opportunity: Expansion into Health-Conscious and Low-Alcohol Segments
One potential opportunity for the ready-to-drink alcoholic beverages market lies in the expansion into health-conscious and low-alcohol segments. With a growing emphasis on wellness and moderation, there is an increasing demand for alcoholic beverages that offer lower alcohol content, reduced calories, and healthier ingredients. Ready-to-drink brands can capitalize on this opportunity by developing products tailored to health-conscious consumers, such as low-alcohol cocktails, light spirits, and botanical-infused beverages. Additionally, leveraging trends such as wellness-inspired ingredients, natural flavors, and functional additives can appeal to consumers seeking balance between indulgence and well-being, opening up new market segments and driving growth in the RTD alcoholic beverages category.
Ready to Drink Alcoholic Beverages Market Share Analysis: Bottles held the dominant market share in 2024
In the Ready to Drink Alcoholic Beverages market segmented by packaging, Bottles emerge as the largest segment, driven by their long-standing association with premium quality, brand recognition, and consumer preferences. Bottles offer a classic and sophisticated packaging option for alcoholic beverages, appealing to consumers seeking a premium drinking experience. Additionally, bottles provide better preservation of flavors and aromas compared to cans or other packaging formats, ensuring the integrity of the product over time. Further, the versatility of bottles allows for various sizes and shapes, catering to different product categories and marketing strategies. Furthermore, the perception of bottles as environmentally friendly, recyclable packaging further enhances their appeal among environmentally conscious consumers. Overall, the premium image, brand recognition, and superior preservation qualities associated with bottles position them as the largest and most dominant segment in the Ready to Drink Alcoholic Beverages market.
Ready to Drink Alcoholic Beverages Market Share Analysis: Off-trade market is poised to register the fastest growth rae over the forecast period to 2032
In the Ready to Drink Alcoholic Beverages market segmented by distribution channel, the Off-trade segment is the fastest-growing, propelled by changing consumer behavior, convenience, and the impact of the COVID-19 pandemic on consumption patterns. Off-trade channels, including supermarkets, liquor stores, convenience stores, and online platforms, offer consumers the convenience of purchasing alcoholic beverages for consumption at home or on-the-go. With lockdowns and restrictions limiting social gatherings and on-premise consumption, consumers increasingly turned to off-trade channels to purchase ready-to-drink alcoholic beverages. Further, the rise of e-commerce platforms and the expansion of delivery services further facilitated off-trade sales, allowing consumers to conveniently order their favorite beverages from the comfort of their homes. Additionally, the wider assortment and competitive pricing offered by off-trade channels compared to on-trade establishments contribute to their attractiveness among consumers. Furthermore, the lasting effects of the pandemic, coupled with evolving consumer preferences for at-home experiences, drive the continued growth of the Off-trade segment in the Ready to Drink Alcoholic Beverages market. Overall, the convenience, accessibility, and shifting consumption patterns position the Off-trade segment as the fastest-growing distribution channel in the market.
Ready to Drink Alcoholic Beverages Market Segmentation
By Packaging
Bottles
Cans
Others
By Distribution Channel
Off-trade
On-trade
Countries Analyzed
North America (US, Canada, Mexico)
Europe (Germany, UK, France, Spain, Italy, Russia, Rest of Europe)
Asia Pacific (China, India, Japan, South Korea, Australia, South East Asia, Rest of Asia)
South America (Brazil, Argentina, Rest of South America)
Middle East and Africa (Saudi Arabia, UAE, Rest of Middle East, South Africa, Egypt, Rest of Africa)
Ready to Drink Alcoholic Beverages Companies Profiled in the Study
Anheuser Busch InBev SA NV
Asahi Group Holdings Ltd
Bacardi Ltd
Brown Forman Corp
Campari Group
Carlsberg Breweries AS
Constellation Brands Inc
Diageo Plc
Halewood International South Africa Pty Ltd
Heaven Hill Sales Co.
Heineken NV
Manchester Drinks Ltd
Mark Anthony Brands International Unlimited Co.
MIKES HARD LEMONADE Co.
Molson Coors Beverage Co.
*- List Not Exhaustive
Chapter 1. TABLE OF CONTENTS
Chapter 2. Introduction to Ready to Drink Alcoholic Beverages Market
2.1. Market Overview
2.2. Key Statistics and Report Highlights
2.3. Scope of the Comprehensive Study
2.3.1. Market Definition
2.3.2 Countries and Regions Covered
2.3.3 Research Objective
2.3.4 Units, Currency, and Conversions
2.3.5 Industry Value Chain
2.4. Key Market Segments
2.5. Key Companies
2.6. Study Period
Chapter 3. Strategic Analysis Review
3.1. Ready to Drink Alcoholic Beverages Pricing Analysis and Forecast
3.2. Porter’s Five Forces
3.3. Market Ecosystem
3.4. SWOT Analysis
3.5. Regulatory Scenario
3.3. Effects of Inflation, Russia-Ukraine War, moderating economic growth, and other macroeconomic factors
Chapter 4. Competitive Landscape
4.1. Market Share Analysis
4.1.1. Global Ready to Drink Alcoholic Beverages Market Share by Company, 2023
4.1.2. Product Offerings of Leading Ready to Drink Alcoholic Beverages Companies
4.2. Market Entropy
4.2.1. New Product Launches in the Industry
4.2.2. Mergers, Acquisitions, Joint ventures, and Partnerships
4.3. Key Strategies and Best Practices
Chapter 5. Global Market Projections: Best, Reference, and Low Case Scenarios
5.1. Growth Analysis- Case Scenario Definitions
5.2. Low Growth Case Scenario Forecasts
5.3. Reference Growth Case Scenario Forecasts
5.4. High Growth Case Scenario Forecasts
Chapter 6. Market Dynamics
6.1. Ready to Drink Alcoholic Beverages Market Drivers
6.2. Ready to Drink Alcoholic Beverages Market Challenges
6.6. Ready to Drink Alcoholic Beverages Market Opportunities
6.4. Ready to Drink Alcoholic Beverages Market Trends
Chapter 7. Global Ready to Drink Alcoholic Beverages Market Outlook Trends
7.1. Global Ready to Drink Alcoholic Beverages Revenue (USD Million) and CAGR (%) by Type (2021-2032)
7.2. Global Ready to Drink Alcoholic Beverages Revenue (USD Million) and CAGR (%) by Application (2021-2032)
7.3. Global Ready to Drink Alcoholic Beverages Revenue (USD Million) and CAGR (%) by Product (2021-2032)
By Packaging
Bottles
Cans
Others
By Distribution Channel
Off-trade
On-trade
Chapter 8. Global Ready to Drink Alcoholic Beverages Regional Analysis and Outlook
8.1. Global Ready to Drink Alcoholic Beverages Revenue (USD Million) By Regions (2021- 2032)
8.2. North America Ready to Drink Alcoholic Beverages Revenue (USD Million) by Country (2021-2032)
8.2.1. United States Ready to Drink Alcoholic Beverages Regional Analysis and Outlook
8.2.2. Canada Ready to Drink Alcoholic Beverages Regional Analysis and Outlook
8.2.3. Mexico Ready to Drink Alcoholic Beverages Regional Analysis and Outlook
8.3. Europe Ready to Drink Alcoholic Beverages Revenue (USD Million), by Country (2021-2032)
8.3.1. Germany Ready to Drink Alcoholic Beverages Regional Analysis and Outlook
8.3.2. France Ready to Drink Alcoholic Beverages Regional Analysis and Outlook
8.3.3. United Kingdom Ready to Drink Alcoholic Beverages Regional Analysis and Outlook
8.3.4. Spain Ready to Drink Alcoholic Beverages Regional Analysis and Outlook
8.3.5. Italy Ready to Drink Alcoholic Beverages Regional Analysis and Outlook
8.3.6. Russia Ready to Drink Alcoholic Beverages Regional Analysis and Outlook
8.3.7. Rest of Europe Ready to Drink Alcoholic Beverages Regional Analysis and Outlook
8.4. Asia Pacific Ready to Drink Alcoholic Beverages Revenue (USD Million) by Country (2021-2032)
8.4.1. China Ready to Drink Alcoholic Beverages Regional Analysis and Outlook
8.4.2. Japan Ready to Drink Alcoholic Beverages Regional Analysis and Outlook
8.4.3. India Ready to Drink Alcoholic Beverages Regional Analysis and Outlook
8.4.4. South Korea Ready to Drink Alcoholic Beverages Regional Analysis and Outlook
8.4.5. Australia Ready to Drink Alcoholic Beverages Regional Analysis and Outlook
8.4.6. South East Asia Ready to Drink Alcoholic Beverages Regional Analysis and Outlook
8.4.7. Rest of Asia Pacific Ready to Drink Alcoholic Beverages Regional Analysis and Outlook
8.5. South America Ready to Drink Alcoholic Beverages Revenue (USD Million), by Country (2021-2032)
8.5.1. Brazil Ready to Drink Alcoholic Beverages Regional Analysis and Outlook
8.5.2. Argentina Ready to Drink Alcoholic Beverages Regional Analysis and Outlook
8.5.3. Rest of South America Ready to Drink Alcoholic Beverages Regional Analysis and Outlook
8.6. Middle East and Africa Ready to Drink Alcoholic Beverages Revenue (USD Million) by Country (2021-2032)
8.6.1. Middle East Ready to Drink Alcoholic Beverages Regional Analysis and Outlook
8.6.2. Africa Ready to Drink Alcoholic Beverages Regional Analysis and Outlook
Chapter 9. North America Ready to Drink Alcoholic Beverages Analysis and Outlook
9.1. North America Ready to Drink Alcoholic Beverages Revenue (USD Million) by Segments (2021-2032)
9.1.1. North America Ready to Drink Alcoholic Beverages Revenue (USD Million) by Type (2021-2032)
9.1.2. North America Ready to Drink Alcoholic Beverages Revenue (USD Million) by Application (2021-2032)
9.1.3. North America Ready to Drink Alcoholic Beverages Revenue (USD Million) by Product (2021-2032)
By Packaging
Bottles
Cans
Others
By Distribution Channel
Off-trade
On-trade
Chapter 10. Europe Ready to Drink Alcoholic Beverages Analysis and Outlook
10.1. Europe Ready to Drink Alcoholic Beverages Revenue (USD Million), by Segments (USD Million) (2021-2032)
10.1.1. Europe Ready to Drink Alcoholic Beverages Revenue (USD Million) by Type (2021-2032)
10.1.2. Europe Ready to Drink Alcoholic Beverages Revenue (USD Million) by Application (2021-2032)
10.1.3. Europe Ready to Drink Alcoholic Beverages Revenue (USD Million) by Product (2021-2032)
By Packaging
Bottles
Cans
Others
By Distribution Channel
Off-trade
On-trade
Chapter 11. Asia Pacific Ready to Drink Alcoholic Beverages Analysis and Outlook
11.1. Asia Pacific Ready to Drink Alcoholic Beverages Revenue (USD Million), and Revenue (USD Million) by Segments (2021-2032)
11.1.1. Asia Pacific Ready to Drink Alcoholic Beverages Revenue (USD Million) by Type (2021-2032)
11.1.2. Asia Pacific Ready to Drink Alcoholic Beverages Revenue (USD Million) by Application (2021-2032)
11.1.3. Asia Pacific Ready to Drink Alcoholic Beverages Revenue (USD Million) by Product (2021-2032)
By Packaging
Bottles
Cans
Others
By Distribution Channel
Off-trade
On-trade
Chapter 12. South America Ready to Drink Alcoholic Beverages Analysis and Outlook
12.1. South America Ready to Drink Alcoholic Beverages Revenue (USD Million), by Segments (2021-2032)
12.1.1. South America Ready to Drink Alcoholic Beverages Revenue (USD Million) by Type (2021-2032)
12.1.2. South America Ready to Drink Alcoholic Beverages Revenue (USD Million) by Application (2021-2032)
12.1.3. South America Ready to Drink Alcoholic Beverages Revenue (USD Million) by Product (2021-2032)
By Packaging
Bottles
Cans
Others
By Distribution Channel
Off-trade
On-trade
Chapter 13. Middle East and Africa Ready to Drink Alcoholic Beverages Analysis and Outlook
13.1. Middle East and Africa Ready to Drink Alcoholic Beverages Revenue (USD Million), by Segments (2021-2032)
13.1.1. Middle East and Africa Ready to Drink Alcoholic Beverages Revenue (USD Million) by Type (2021-2032)
13.1.2. Middle East and Africa Ready to Drink Alcoholic Beverages Revenue (USD Million) by Application (2021-2032)
13.1.3. Middle East and Africa Ready to Drink Alcoholic Beverages Revenue (USD Million) by Product (2021-2032)
By Packaging
Bottles
Cans
Others
By Distribution Channel
Off-trade
On-trade
Chapter 14. Ready to Drink Alcoholic Beverages Company Profiles
14.1 Business Overview
14.2 Product Profiles
14.3 SWOT Profiles
14.5 Recent Developments
14.6 Financial Profile
List of Companies
Anheuser Busch InBev SA NV
Asahi Group Holdings Ltd
Bacardi Ltd
Brown Forman Corp
Campari Group
Carlsberg Breweries AS
Constellation Brands Inc
Diageo Plc
Halewood International South Africa Pty Ltd
Heaven Hill Sales Co.
Heineken NV
Manchester Drinks Ltd
Mark Anthony Brands International Unlimited Co.
MIKES HARD LEMONADE Co.
Molson Coors Beverage Co.
15. Methodology and Data Sources
15.1 Customization Offerings
15.2 Subscription Services
15.3 Related Reports
15.4 Publisher Expertise
LIST OF TABLES
Table 1 Market Segmentation Analysis
Table 2 Global Ready to Drink Alcoholic Beverages Market Share of Leading Companies, 2023
Table 3 Product Offerings of Leading Companies
Table 4 Low Growth Scenario Forecasts
Table 5 Reference Case Growth Scenario
Table 6 High Growth Case Scenario
Table 7 Global Ready to Drink Alcoholic Beverages Revenue (USD Million) And CAGR (%) By Type (2021-2032)
Table 8 Global Ready to Drink Alcoholic Beverages Revenue (USD Million) And CAGR (%) By Application (2021-2032)
Table 9 Global Ready to Drink Alcoholic Beverages Revenue (USD Million) And CAGR (%) By Product (2021-2032)
Table 10 Global Ready to Drink Alcoholic Beverages Market Revenue (USD Million) By Regions (2021-2032)
Table 11 Global Ready to Drink Alcoholic Beverages Market Share (%) By Regions (2021-2032)
Table 12 North America Ready to Drink Alcoholic Beverages Revenue (USD Million) By Country (2021-2032)
Table 13 Europe Ready to Drink Alcoholic Beverages Revenue (USD Million) By Country (2021-2032)
Table 14 Asia Pacific Ready to Drink Alcoholic Beverages Revenue (USD Million) By Country (2021-2032)
Table 15 South America Ready to Drink Alcoholic Beverages Revenue (USD Million) By Country (2021-2032)
Table 16 Middle East and Africa Ready to Drink Alcoholic Beverages Revenue (USD Million) By Region (2021-2032)
Table 17 North America Ready to Drink Alcoholic Beverages Revenue (USD Million) By Type (2021-2032)
Table 18 North America Ready to Drink Alcoholic Beverages Revenue (USD Million) By Application (2021-2032)
Table 19 North America Ready to Drink Alcoholic Beverages Revenue (USD Million) By Product (2021-2032)
Table 20 Europe Ready to Drink Alcoholic Beverages Revenue (USD Million) By Type (2021-2032)
Table 21 Europe Ready to Drink Alcoholic Beverages Revenue (USD Million) By Application (2021-2032)
Table 22 Europe Ready to Drink Alcoholic Beverages Revenue (USD Million) By Product (2021-2032)
Table 23 Asia Pacific Ready to Drink Alcoholic Beverages Revenue (USD Million) By Type (2021-2032)
Table 24 Asia Pacific Ready to Drink Alcoholic Beverages Revenue (USD Million) By Application (2021-2032)
Table 25 Asia Pacific Ready to Drink Alcoholic Beverages Revenue (USD Million) By Product (2021-2032)
Table 26 South America Ready to Drink Alcoholic Beverages Revenue (USD Million) By Type (2021-2032)
Table 27 South America Ready to Drink Alcoholic Beverages Revenue (USD Million) By Application (2021-2032)
Table 28 South America Ready to Drink Alcoholic Beverages Revenue (USD Million) By Product (2021-2032)
Table 29 Middle East and Africa Ready to Drink Alcoholic Beverages Revenue (USD Million) By Type (2021-2032)
Table 30 Middle East and Africa Ready to Drink Alcoholic Beverages Revenue (USD Million) By Application (2021-2032)
Table 31 Middle East and Africa Ready to Drink Alcoholic Beverages Revenue (USD Million) By Product (2021-2032)
LIST OF FIGURES
Figure 1. Market Scope
Figure 2. Pricing Forecasts Per Unit, 2023- 2032
Figure 3. Porter’s Five Forces
Figure 4. Global Ready to Drink Alcoholic Beverages Market Revenue (USD Million) By Regions (2021-2032)
Figure 5. Global Ready to Drink Alcoholic Beverages Market Share (%) By Regions (2023)
Figure 6. North America Ready to Drink Alcoholic Beverages Revenue (USD Million) By Country (2021-2032)
Figure 7. United States Ready to Drink Alcoholic Beverages Revenue (USD Million) By Country (2021-2032)
Figure 8. Canada Ready to Drink Alcoholic Beverages Revenue (USD Million) By Country (2021-2032)
Figure 9. Mexico Ready to Drink Alcoholic Beverages Revenue (USD Million) By Country (2021-2032)
Figure 10. Europe Ready to Drink Alcoholic Beverages Revenue (USD Million) By Country (2021-2032)
Figure 11. Germany Ready to Drink Alcoholic Beverages Revenue (USD Million) By Country (2021-2032)
Figure 12. France Ready to Drink Alcoholic Beverages Revenue (USD Million) By Country (2021-2032)
Figure 13. United Kingdom Ready to Drink Alcoholic Beverages Revenue (USD Million) By Country (2021-2032)
Figure 14. Spain Ready to Drink Alcoholic Beverages Revenue (USD Million) By Country (2021-2032)
Figure 15. Italy Ready to Drink Alcoholic Beverages Revenue (USD Million) By Country (2021-2032)
Figure 16. Russia Ready to Drink Alcoholic Beverages Revenue (USD Million) By Country (2021-2032)
Figure 17. Rest of Europe Ready to Drink Alcoholic Beverages Revenue (USD Million) By Country (2021-2032)
Figure 11. Asia Pacific Ready to Drink Alcoholic Beverages Revenue (USD Million) By Country (2021-2032)
Figure 12. China Ready to Drink Alcoholic Beverages Revenue (USD Million) By Country (2021-2032)
Figure 13. Japan Ready to Drink Alcoholic Beverages Revenue (USD Million) By Country (2021-2032)
Figure 14. India Ready to Drink Alcoholic Beverages Revenue (USD Million) By Country (2021-2032)
Figure 15. South Korea Ready to Drink Alcoholic Beverages Revenue (USD Million) By Country (2021-2032)
Figure 16. Australia Ready to Drink Alcoholic Beverages Revenue (USD Million) By Country (2021-2032)
Figure 17. South East Asia Ready to Drink Alcoholic Beverages Revenue (USD Million) By Country (2021-2032)
Figure 18. South America Ready to Drink Alcoholic Beverages Revenue (USD Million) By Country (2021-2032)
Figure 19. Brazil Ready to Drink Alcoholic Beverages Revenue (USD Million) By Country (2021-2032)
Figure 20. Argentina Ready to Drink Alcoholic Beverages Revenue (USD Million) By Country (2021-2032)
Figure 21. Rest of Asia Pacific Ready to Drink Alcoholic Beverages Revenue (USD Million) By Country (2021-2032)
Figure 22. Middle East and Africa Ready to Drink Alcoholic Beverages Revenue (USD Million) By Region (2021-2032)
Figure 23. Saudi Arabia Ready to Drink Alcoholic Beverages Revenue (USD Million) By Region (2021-2032)
Figure 24. The UAE Ready to Drink Alcoholic Beverages Revenue (USD Million) By Region (2021-2032)
Figure 25. Rest of Middle East Ready to Drink Alcoholic Beverages Revenue (USD Million) By Region (2021-2032)
Figure 26. South Africa Ready to Drink Alcoholic Beverages Revenue (USD Million) By Region (2021-2032)
Figure 27. Africa Ready to Drink Alcoholic Beverages Revenue (USD Million) By Region (2021-2032)
Figure 28. North America Ready to Drink Alcoholic Beverages Revenue (USD Million) By Type (2021-2032)
Figure 29. North America Ready to Drink Alcoholic Beverages Revenue (USD Million) By Application (2021-2032)
Figure 30. North America Ready to Drink Alcoholic Beverages Revenue (USD Million) By Product (2021-2032)
Figure 31. Europe Ready to Drink Alcoholic Beverages Revenue (USD Million) By Type (2021-2032)
Figure 32. Europe Ready to Drink Alcoholic Beverages Revenue (USD Million) By Application (2021-2032)
Figure 33. Europe Ready to Drink Alcoholic Beverages Revenue (USD Million) By Product (2021-2032)
Figure 34. Asia Pacific Ready to Drink Alcoholic Beverages Revenue (USD Million) By Type (2021-2032)
Figure 35. Asia Pacific Ready to Drink Alcoholic Beverages Revenue (USD Million) By Application (2021-2032)
Figure 36. Asia Pacific Ready to Drink Alcoholic Beverages Revenue (USD Million) By Product (2021-2032)
Figure 37. South America Ready to Drink Alcoholic Beverages Revenue (USD Million) By Type (2021-2032)
Figure 38. South America Ready to Drink Alcoholic Beverages Revenue (USD Million) By Application (2021-2032)
Figure 39. South America Ready to Drink Alcoholic Beverages Revenue (USD Million) By Product (2021-2032)
Figure 40. Middle East and Africa Ready to Drink Alcoholic Beverages Revenue (USD Million) By Type (2021-2032)
Figure 41. Middle East and Africa Ready to Drink Alcoholic Beverages Revenue (USD Million) By Application (2021-2032)
Figure 42. Middle East and Africa Ready to Drink Alcoholic Beverages Revenue (USD Million) By Product (2021-2032)
By Packaging
Bottles
Cans
Others
By Distribution Channel
Off-trade
On-trade
Countries Analyzed
North America (US, Canada, Mexico)
Europe (Germany, UK, France, Spain, Italy, Russia, Rest of Europe)
Asia Pacific (China, India, Japan, South Korea, Australia, South East Asia, Rest of Asia)
South America (Brazil, Argentina, Rest of South America)
Middle East and Africa (Saudi Arabia, UAE, Rest of Middle East, South Africa, Egypt, Rest of Africa)
