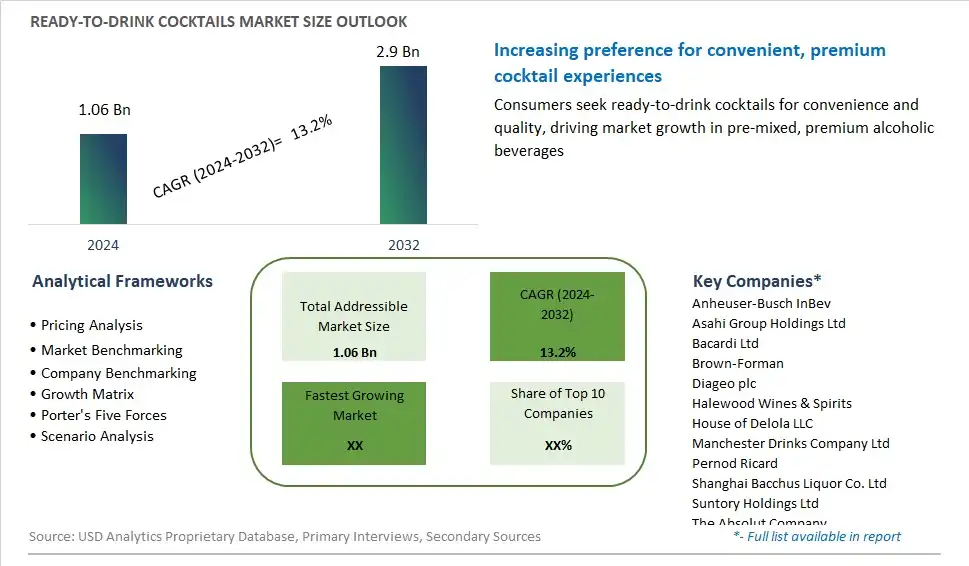
Global Ready-to-Drink Cocktails Market Size is valued at $1.06 Billion in 2024 and is forecast to register a growth rate (CAGR) of 13.2% to reach $2.9 Billion by 2032.
The global Ready-to-Drink Cocktails Market Comprehensive Study analyzes and forecasts the market size across 6 regions and 24 countries for diverse segments -By Alcohol Base (Malt-based, Spirit-based, Wine-based), By Packaging (Bottles, Cans), By Distribution Channel (Hypermarkets/Supermarkets, Online, Liquor Stores)
An Introduction to Ready-to-Drink Cocktails Market
In 2024, the ready-to-drink (RTD) cocktails market is booming, reflecting a growing consumer preference for convenient, premium-quality alcoholic beverages. RTD cocktails offer the flavors and sophistication of traditional cocktails without the need for mixing or measuring, making them an ideal choice for on-the-go consumption and social gatherings. This market includes a wide variety of products, from classic cocktails like margaritas and mojitos to innovative and craft-inspired creations. Health-conscious consumers are increasingly seeking RTD cocktails made with natural ingredients, lower sugar content, and premium spirits. The trend towards convenience and the growing popularity of canned beverages have significantly boosted demand for RTD cocktails. Innovations in packaging, such as eco-friendly cans and bottles, have further enhanced the appeal and portability of these products. As consumers continue to seek high-quality, ready-made beverage options, the RTD cocktails market is set for robust growth and innovation.
Ready To Drink Cocktails Competitive Landscape
The market report analyses the leading companies in the industry including Anheuser-Busch InBev, Asahi Group Holdings Ltd, Bacardi Ltd, Brown-Forman, Diageo plc, Halewood Wines & Spirits, House of Delola LLC, Manchester Drinks Company Ltd, Pernod Ricard, Shanghai Bacchus Liquor Co. Ltd, Suntory Holdings Ltd, The Absolut Company, and Others.
Ready To Drink Cocktails Market Dynamics
Market Trend: Convenience and On-the-Go Lifestyle
The most prominent trend in the Ready-to-Drink Cocktails Market is the increasing demand for convenience and on-the-go lifestyle products. Consumers are seeking ready-to-drink beverages that offer the same quality and experience as traditional cocktails but with the added convenience of portability and ease of use. This trend is driven by busy lifestyles, the rise of outdoor socializing, and the growing preference for pre-mixed beverages that eliminate the need for bartending skills. The market is seeing a surge in innovative packaging and flavor options to meet this demand
Market Driver: Shift Towards Premiumization
The shift towards premiumization is a major driver of the Ready-to-Drink Cocktails Market. Consumers are willing to pay a premium for high-quality, craft-inspired ready-to-drink cocktails that use premium ingredients and offer unique flavor profiles. This driver is supported by the growing trend of craft cocktails and the desire for sophisticated drinking experiences. The emphasis on quality and authenticity is driving manufacturers to focus on premium formulations and branding, which in turn is driving market growth
Market Opportunity: Expansion of Product Range
A significant opportunity in the Ready-to-Drink Cocktails Market lies in the expansion of the product range. As the market grows, there is potential for companies to introduce new and innovative ready-to-drink cocktail options that cater to diverse consumer preferences. This includes exploring different cocktail types, flavors, and alcohol bases, as well as offering non-alcoholic versions for sober curious consumers. By continuously expanding their product portfolios, companies can attract a broader audience and maintain consumer interest
Ready-to-Drink Cocktails Market Share Analysis: Alcohol Base (Malt-based, Spirit-based, Wine-based)
The spirit-based segment is anticipated to be the fastest-growing in the Ready-to-Drink Cocktails Market by alcohol base to 2032. Spirit-based ready-to-drink (RTD) cocktails offer a wide range of flavors and premium experiences, appealing to consumers looking for convenience without compromising on taste and quality. The increasing popularity of cocktail culture, coupled with the demand for innovative and sophisticated beverage options, drives the growth of the spirit-based segment. Additionally, the rise of at-home entertaining and the growing trend of premiumization in the alcoholic beverage market further boost the demand for spirit-based RTD cocktails. The availability of a variety of spirit options, such as vodka, gin, rum, and tequila, in RTD formats supports the segment's expansion.
Ready-to-Drink Cocktails Market Share Analysis: Packaging (Bottles, Cans)
The cans segment is expected to be the fastest-growing in the Ready-to-Drink Cocktails Market by packaging to 2032. Canned RTD cocktails offer several advantages, including portability, convenience, and portion control, which appeal to modern consumers with active lifestyles. The rise of outdoor activities, picnics, and on-the-go consumption has increased the demand for canned beverages. Additionally, cans are more environmentally friendly and easier to recycle than glass bottles, aligning with the growing consumer preference for sustainable packaging. The expanding variety of canned RTD cocktail options in different flavors and styles further drives the segment's growth.
Ready-to-Drink Cocktails Market Share Analysis: Distribution Channel (Hypermarkets/Supermarkets, Online, Liquor Stores)
The online distribution channel is projected to be the fastest-growing segment in the Ready-to-Drink Cocktails Market by distribution channel to 2032. The convenience and accessibility of online shopping, combined with the growing consumer preference for e-commerce, drive the rapid growth of this segment. Online platforms offer a wide variety of RTD cocktails, detailed product descriptions, and customer reviews, making it easier for consumers to make informed purchasing decisions. The COVID-19 pandemic has further accelerated the shift towards online shopping, as consumers seek contactless and convenient ways to purchase their favorite beverages. Subscription services and direct-to-consumer models also contribute to the segment's expansion, providing consumers with regular deliveries of their preferred RTD cocktails.
Ready To Drink Cocktails Market Segmentation
By Alcohol Base
Malt-based
Spirit-based
Wine-based
By Packaging
Bottles
Cans
By Distribution Channel
Hypermarkets/Supermarkets
Online
Liquor Stores
Countries Analyzed
North America (US, Canada, Mexico)
Europe (Germany, UK, France, Spain, Italy, Russia, Rest of Europe)
Asia Pacific (China, India, Japan, South Korea, Australia, South East Asia, Rest of Asia)
South America (Brazil, Argentina, Rest of South America)
Middle East and Africa (Saudi Arabia, UAE, Rest of Middle East, South Africa, Egypt, Rest of Africa)
Ready To Drink Cocktails Companies Profiled in the Study
Anheuser-Busch InBev
Asahi Group Holdings Ltd
Bacardi Ltd
Brown-Forman
Diageo plc
Halewood Wines & Spirits
House of Delola LLC
Manchester Drinks Company Ltd
Pernod Ricard
Shanghai Bacchus Liquor Co. Ltd
Suntory Holdings Ltd
The Absolut Company
*- List Not Exhaustive
Chapter 1. TABLE OF CONTENTS
Chapter 2. Introduction to Ready To Drink Cocktails Market
2.1. Market Overview
2.2. Key Statistics and Report Highlights
2.3. Scope of the Comprehensive Study
2.3.1. Market Definition
2.3.2 Countries and Regions Covered
2.3.3 Research Objective
2.3.4 Units, Currency, and Conversions
2.3.5 Industry Value Chain
2.4. Key Market Segments
2.5. Key Companies
2.6. Study Period
Chapter 3. Strategic Analysis Review
3.1. Ready To Drink Cocktails Pricing Analysis and Forecast
3.2. Porter’s Five Forces
3.3. Market Ecosystem
3.4. SWOT Analysis
3.5. Regulatory Scenario
3.3. Effects of Inflation, Russia-Ukraine War, moderating economic growth, and other macroeconomic factors
Chapter 4. Competitive Landscape
4.1. Market Share Analysis
4.1.1. Global Ready To Drink Cocktails Market Share by Company, 2023
4.1.2. Product Offerings of Leading Ready To Drink Cocktails Companies
4.2. Market Entropy
4.2.1. New Product Launches in the Industry
4.2.2. Mergers, Acquisitions, Joint ventures, and Partnerships
4.3. Key Strategies and Best Practices
Chapter 5. Global Market Projections: Best, Reference, and Low Case Scenarios
5.1. Growth Analysis- Case Scenario Definitions
5.2. Low Growth Case Scenario Forecasts
5.3. Reference Growth Case Scenario Forecasts
5.4. High Growth Case Scenario Forecasts
Chapter 6. Market Dynamics
6.1. Ready To Drink Cocktails Market Drivers
6.2. Ready To Drink Cocktails Market Challenges
6.6. Ready To Drink Cocktails Market Opportunities
6.4. Ready To Drink Cocktails Market Trends
Chapter 7. Global Ready To Drink Cocktails Market Outlook Trends
7.1. Global Ready To Drink Cocktails Revenue (USD Million) and CAGR (%) by Type (2021-2032)
7.2. Global Ready To Drink Cocktails Revenue (USD Million) and CAGR (%) by Application (2021-2032)
7.3. Global Ready To Drink Cocktails Revenue (USD Million) and CAGR (%) by Product (2021-2032)
By Alcohol Base
Malt-based
Spirit-based
Wine-based
By Packaging
Bottles
Cans
By Distribution Channel
Hypermarkets/Supermarkets
Online
Liquor Stores
Chapter 8. Global Ready To Drink Cocktails Regional Analysis and Outlook
8.1. Global Ready To Drink Cocktails Revenue (USD Million) By Regions (2021- 2032)
8.2. North America Ready To Drink Cocktails Revenue (USD Million) by Country (2021-2032)
8.2.1. United States Ready To Drink Cocktails Regional Analysis and Outlook
8.2.2. Canada Ready To Drink Cocktails Regional Analysis and Outlook
8.2.3. Mexico Ready To Drink Cocktails Regional Analysis and Outlook
8.3. Europe Ready To Drink Cocktails Revenue (USD Million), by Country (2021-2032)
8.3.1. Germany Ready To Drink Cocktails Regional Analysis and Outlook
8.3.2. France Ready To Drink Cocktails Regional Analysis and Outlook
8.3.3. United Kingdom Ready To Drink Cocktails Regional Analysis and Outlook
8.3.4. Spain Ready To Drink Cocktails Regional Analysis and Outlook
8.3.5. Italy Ready To Drink Cocktails Regional Analysis and Outlook
8.3.6. Russia Ready To Drink Cocktails Regional Analysis and Outlook
8.3.7. Rest of Europe Ready To Drink Cocktails Regional Analysis and Outlook
8.4. Asia Pacific Ready To Drink Cocktails Revenue (USD Million) by Country (2021-2032)
8.4.1. China Ready To Drink Cocktails Regional Analysis and Outlook
8.4.2. Japan Ready To Drink Cocktails Regional Analysis and Outlook
8.4.3. India Ready To Drink Cocktails Regional Analysis and Outlook
8.4.4. South Korea Ready To Drink Cocktails Regional Analysis and Outlook
8.4.5. Australia Ready To Drink Cocktails Regional Analysis and Outlook
8.4.6. South East Asia Ready To Drink Cocktails Regional Analysis and Outlook
8.4.7. Rest of Asia Pacific Ready To Drink Cocktails Regional Analysis and Outlook
8.5. South America Ready To Drink Cocktails Revenue (USD Million), by Country (2021-2032)
8.5.1. Brazil Ready To Drink Cocktails Regional Analysis and Outlook
8.5.2. Argentina Ready To Drink Cocktails Regional Analysis and Outlook
8.5.3. Rest of South America Ready To Drink Cocktails Regional Analysis and Outlook
8.6. Middle East and Africa Ready To Drink Cocktails Revenue (USD Million) by Country (2021-2032)
8.6.1. Middle East Ready To Drink Cocktails Regional Analysis and Outlook
8.6.2. Africa Ready To Drink Cocktails Regional Analysis and Outlook
Chapter 9. North America Ready To Drink Cocktails Analysis and Outlook
9.1. North America Ready To Drink Cocktails Revenue (USD Million) by Segments (2021-2032)
9.1.1. North America Ready To Drink Cocktails Revenue (USD Million) by Type (2021-2032)
9.1.2. North America Ready To Drink Cocktails Revenue (USD Million) by Application (2021-2032)
9.1.3. North America Ready To Drink Cocktails Revenue (USD Million) by Product (2021-2032)
By Alcohol Base
Malt-based
Spirit-based
Wine-based
By Packaging
Bottles
Cans
By Distribution Channel
Hypermarkets/Supermarkets
Online
Liquor Stores
Chapter 10. Europe Ready To Drink Cocktails Analysis and Outlook
10.1. Europe Ready To Drink Cocktails Revenue (USD Million), by Segments (USD Million) (2021-2032)
10.1.1. Europe Ready To Drink Cocktails Revenue (USD Million) by Type (2021-2032)
10.1.2. Europe Ready To Drink Cocktails Revenue (USD Million) by Application (2021-2032)
10.1.3. Europe Ready To Drink Cocktails Revenue (USD Million) by Product (2021-2032)
By Alcohol Base
Malt-based
Spirit-based
Wine-based
By Packaging
Bottles
Cans
By Distribution Channel
Hypermarkets/Supermarkets
Online
Liquor Stores
Chapter 11. Asia Pacific Ready To Drink Cocktails Analysis and Outlook
11.1. Asia Pacific Ready To Drink Cocktails Revenue (USD Million), and Revenue (USD Million) by Segments (2021-2032)
11.1.1. Asia Pacific Ready To Drink Cocktails Revenue (USD Million) by Type (2021-2032)
11.1.2. Asia Pacific Ready To Drink Cocktails Revenue (USD Million) by Application (2021-2032)
11.1.3. Asia Pacific Ready To Drink Cocktails Revenue (USD Million) by Product (2021-2032)
By Alcohol Base
Malt-based
Spirit-based
Wine-based
By Packaging
Bottles
Cans
By Distribution Channel
Hypermarkets/Supermarkets
Online
Liquor Stores
Chapter 12. South America Ready To Drink Cocktails Analysis and Outlook
12.1. South America Ready To Drink Cocktails Revenue (USD Million), by Segments (2021-2032)
12.1.1. South America Ready To Drink Cocktails Revenue (USD Million) by Type (2021-2032)
12.1.2. South America Ready To Drink Cocktails Revenue (USD Million) by Application (2021-2032)
12.1.3. South America Ready To Drink Cocktails Revenue (USD Million) by Product (2021-2032)
By Alcohol Base
Malt-based
Spirit-based
Wine-based
By Packaging
Bottles
Cans
By Distribution Channel
Hypermarkets/Supermarkets
Online
Liquor Stores
Chapter 13. Middle East and Africa Ready To Drink Cocktails Analysis and Outlook
13.1. Middle East and Africa Ready To Drink Cocktails Revenue (USD Million), by Segments (2021-2032)
13.1.1. Middle East and Africa Ready To Drink Cocktails Revenue (USD Million) by Type (2021-2032)
13.1.2. Middle East and Africa Ready To Drink Cocktails Revenue (USD Million) by Application (2021-2032)
13.1.3. Middle East and Africa Ready To Drink Cocktails Revenue (USD Million) by Product (2021-2032)
By Alcohol Base
Malt-based
Spirit-based
Wine-based
By Packaging
Bottles
Cans
By Distribution Channel
Hypermarkets/Supermarkets
Online
Liquor Stores
Chapter 14. Ready To Drink Cocktails Company Profiles
14.1 Business Overview
14.2 Product Profiles
14.3 SWOT Profiles
14.5 Recent Developments
14.6 Financial Profile
List of Companies
Anheuser-Busch InBev
Asahi Group Holdings Ltd
Bacardi Ltd
Brown-Forman
Diageo plc
Halewood Wines & Spirits
House of Delola LLC
Manchester Drinks Company Ltd
Pernod Ricard
Shanghai Bacchus Liquor Co. Ltd
Suntory Holdings Ltd
The Absolut Company
15. Methodology and Data Sources
15.1 Customization Offerings
15.2 Subscription Services
15.3 Related Reports
15.4 Publisher Expertise
LIST OF TABLES
Table 1 Market Segmentation Analysis
Table 2 Global Ready To Drink Cocktails Market Share of Leading Companies, 2023
Table 3 Product Offerings of Leading Companies
Table 4 Low Growth Scenario Forecasts
Table 5 Reference Case Growth Scenario
Table 6 High Growth Case Scenario
Table 7 Global Ready To Drink Cocktails Revenue (USD Million) And CAGR (%) By Type (2021-2032)
Table 8 Global Ready To Drink Cocktails Revenue (USD Million) And CAGR (%) By Application (2021-2032)
Table 9 Global Ready To Drink Cocktails Revenue (USD Million) And CAGR (%) By Product (2021-2032)
Table 10 Global Ready To Drink Cocktails Market Revenue (USD Million) By Regions (2021-2032)
Table 11 Global Ready To Drink Cocktails Market Share (%) By Regions (2021-2032)
Table 12 North America Ready To Drink Cocktails Revenue (USD Million) By Country (2021-2032)
Table 13 Europe Ready To Drink Cocktails Revenue (USD Million) By Country (2021-2032)
Table 14 Asia Pacific Ready To Drink Cocktails Revenue (USD Million) By Country (2021-2032)
Table 15 South America Ready To Drink Cocktails Revenue (USD Million) By Country (2021-2032)
Table 16 Middle East and Africa Ready To Drink Cocktails Revenue (USD Million) By Region (2021-2032)
Table 17 North America Ready To Drink Cocktails Revenue (USD Million) By Type (2021-2032)
Table 18 North America Ready To Drink Cocktails Revenue (USD Million) By Application (2021-2032)
Table 19 North America Ready To Drink Cocktails Revenue (USD Million) By Product (2021-2032)
Table 20 Europe Ready To Drink Cocktails Revenue (USD Million) By Type (2021-2032)
Table 21 Europe Ready To Drink Cocktails Revenue (USD Million) By Application (2021-2032)
Table 22 Europe Ready To Drink Cocktails Revenue (USD Million) By Product (2021-2032)
Table 23 Asia Pacific Ready To Drink Cocktails Revenue (USD Million) By Type (2021-2032)
Table 24 Asia Pacific Ready To Drink Cocktails Revenue (USD Million) By Application (2021-2032)
Table 25 Asia Pacific Ready To Drink Cocktails Revenue (USD Million) By Product (2021-2032)
Table 26 South America Ready To Drink Cocktails Revenue (USD Million) By Type (2021-2032)
Table 27 South America Ready To Drink Cocktails Revenue (USD Million) By Application (2021-2032)
Table 28 South America Ready To Drink Cocktails Revenue (USD Million) By Product (2021-2032)
Table 29 Middle East and Africa Ready To Drink Cocktails Revenue (USD Million) By Type (2021-2032)
Table 30 Middle East and Africa Ready To Drink Cocktails Revenue (USD Million) By Application (2021-2032)
Table 31 Middle East and Africa Ready To Drink Cocktails Revenue (USD Million) By Product (2021-2032)
LIST OF FIGURES
Figure 1. Market Scope
Figure 2. Pricing Forecasts Per Unit, 2023- 2032
Figure 3. Porter’s Five Forces
Figure 4. Global Ready To Drink Cocktails Market Revenue (USD Million) By Regions (2021-2032)
Figure 5. Global Ready To Drink Cocktails Market Share (%) By Regions (2023)
Figure 6. North America Ready To Drink Cocktails Revenue (USD Million) By Country (2021-2032)
Figure 7. United States Ready To Drink Cocktails Revenue (USD Million) By Country (2021-2032)
Figure 8. Canada Ready To Drink Cocktails Revenue (USD Million) By Country (2021-2032)
Figure 9. Mexico Ready To Drink Cocktails Revenue (USD Million) By Country (2021-2032)
Figure 10. Europe Ready To Drink Cocktails Revenue (USD Million) By Country (2021-2032)
Figure 11. Germany Ready To Drink Cocktails Revenue (USD Million) By Country (2021-2032)
Figure 12. France Ready To Drink Cocktails Revenue (USD Million) By Country (2021-2032)
Figure 13. United Kingdom Ready To Drink Cocktails Revenue (USD Million) By Country (2021-2032)
Figure 14. Spain Ready To Drink Cocktails Revenue (USD Million) By Country (2021-2032)
Figure 15. Italy Ready To Drink Cocktails Revenue (USD Million) By Country (2021-2032)
Figure 16. Russia Ready To Drink Cocktails Revenue (USD Million) By Country (2021-2032)
Figure 17. Rest of Europe Ready To Drink Cocktails Revenue (USD Million) By Country (2021-2032)
Figure 11. Asia Pacific Ready To Drink Cocktails Revenue (USD Million) By Country (2021-2032)
Figure 12. China Ready To Drink Cocktails Revenue (USD Million) By Country (2021-2032)
Figure 13. Japan Ready To Drink Cocktails Revenue (USD Million) By Country (2021-2032)
Figure 14. India Ready To Drink Cocktails Revenue (USD Million) By Country (2021-2032)
Figure 15. South Korea Ready To Drink Cocktails Revenue (USD Million) By Country (2021-2032)
Figure 16. Australia Ready To Drink Cocktails Revenue (USD Million) By Country (2021-2032)
Figure 17. South East Asia Ready To Drink Cocktails Revenue (USD Million) By Country (2021-2032)
Figure 18. South America Ready To Drink Cocktails Revenue (USD Million) By Country (2021-2032)
Figure 19. Brazil Ready To Drink Cocktails Revenue (USD Million) By Country (2021-2032)
Figure 20. Argentina Ready To Drink Cocktails Revenue (USD Million) By Country (2021-2032)
Figure 21. Rest of Asia Pacific Ready To Drink Cocktails Revenue (USD Million) By Country (2021-2032)
Figure 22. Middle East and Africa Ready To Drink Cocktails Revenue (USD Million) By Region (2021-2032)
Figure 23. Saudi Arabia Ready To Drink Cocktails Revenue (USD Million) By Region (2021-2032)
Figure 24. The UAE Ready To Drink Cocktails Revenue (USD Million) By Region (2021-2032)
Figure 25. Rest of Middle East Ready To Drink Cocktails Revenue (USD Million) By Region (2021-2032)
Figure 26. South Africa Ready To Drink Cocktails Revenue (USD Million) By Region (2021-2032)
Figure 27. Africa Ready To Drink Cocktails Revenue (USD Million) By Region (2021-2032)
Figure 28. North America Ready To Drink Cocktails Revenue (USD Million) By Type (2021-2032)
Figure 29. North America Ready To Drink Cocktails Revenue (USD Million) By Application (2021-2032)
Figure 30. North America Ready To Drink Cocktails Revenue (USD Million) By Product (2021-2032)
Figure 31. Europe Ready To Drink Cocktails Revenue (USD Million) By Type (2021-2032)
Figure 32. Europe Ready To Drink Cocktails Revenue (USD Million) By Application (2021-2032)
Figure 33. Europe Ready To Drink Cocktails Revenue (USD Million) By Product (2021-2032)
Figure 34. Asia Pacific Ready To Drink Cocktails Revenue (USD Million) By Type (2021-2032)
Figure 35. Asia Pacific Ready To Drink Cocktails Revenue (USD Million) By Application (2021-2032)
Figure 36. Asia Pacific Ready To Drink Cocktails Revenue (USD Million) By Product (2021-2032)
Figure 37. South America Ready To Drink Cocktails Revenue (USD Million) By Type (2021-2032)
Figure 38. South America Ready To Drink Cocktails Revenue (USD Million) By Application (2021-2032)
Figure 39. South America Ready To Drink Cocktails Revenue (USD Million) By Product (2021-2032)
Figure 40. Middle East and Africa Ready To Drink Cocktails Revenue (USD Million) By Type (2021-2032)
Figure 41. Middle East and Africa Ready To Drink Cocktails Revenue (USD Million) By Application (2021-2032)
Figure 42. Middle East and Africa Ready To Drink Cocktails Revenue (USD Million) By Product (2021-2032)
By Alcohol Base
Malt-based
Spirit-based
Wine-based
By Packaging
Bottles
Cans
By Distribution Channel
Hypermarkets/Supermarkets
Online
Liquor Stores
Countries Analyzed
North America (US, Canada, Mexico)
Europe (Germany, UK, France, Spain, Italy, Russia, Rest of Europe)
Asia Pacific (China, India, Japan, South Korea, Australia, South East Asia, Rest of Asia)
South America (Brazil, Argentina, Rest of South America)
Middle East and Africa (Saudi Arabia, UAE, Rest of Middle East, South Africa, Egypt, Rest of Africa)
