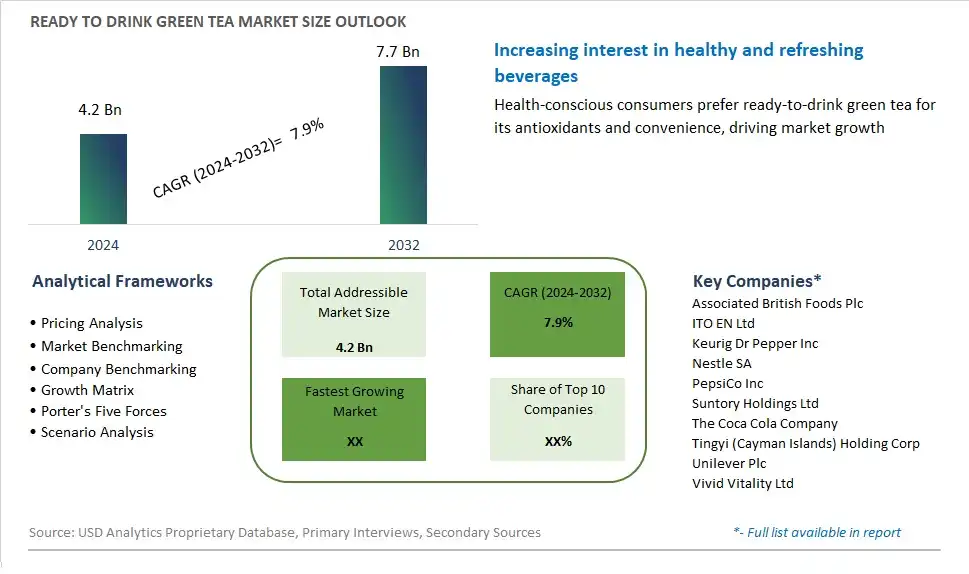
Global Ready to Drink Green Tea Market Size is valued at $4.2 Billion in 2024 and is forecast to register a growth rate (CAGR) of 7.9% to reach $7.7 Billion by 2032.
The global Ready to Drink Green Tea Market Comprehensive Study analyzes and forecasts the market size across 6 regions and 24 countries for diverse segments -By Packaging (Plastic Bottles, Cans, Others), By Type (Flavored, Unflavored), By Distribution Channel (Supermarkets/Hypermarkets, Convenience Stores, Specialty Stores, Online stores, Others)
An Introduction to Ready to Drink Green Tea Market
In 2024, the ready-to-drink (RTD) green tea market is expanding rapidly, driven by increasing health consciousness and the demand for convenient beverage options. Green tea, known for its antioxidant properties and health benefits, is gaining popularity as a refreshing and healthy alternative to sugary drinks. The market is characterized by a wide variety of flavors and formulations, including unsweetened, lightly sweetened, and flavored options. Innovations in packaging, such as eco-friendly materials and single-serve bottles, are also driving growth. Additionally, the trend towards natural and organic products is influencing the market, with many consumers seeking clean label and sustainably sourced green tea beverages.
Ready To Drink Green Tea Competitive Landscape
The market report analyses the leading companies in the industry including Associated British Foods Plc, ITO EN Ltd, Keurig Dr Pepper Inc, Nestle SA, PepsiCo Inc, Suntory Holdings Ltd, The Coca Cola Company, Tingyi (Cayman Islands) Holding Corp, Unilever Plc, Vivid Vitality Ltd, and Others.
Ready To Drink Green Tea Market Dynamics
Ready To Drink Green Tea Market Trend: Growing Health Consciousness and Preference for Natural Beverages
A prominent market trend in the ready-to-drink green tea segment is the growing health consciousness among consumers and their preference for natural beverages. With increasing awareness of the health benefits associated with green tea, such as antioxidants and potential weight management properties, consumers are gravitating towards healthier beverage options. Ready-to-drink green tea products offer a convenient and refreshing way for consumers to incorporate the health benefits of green tea into their daily routines, aligning with their desire for natural, functional beverages that support their wellness goals.
Market Driver: Demand for Convenient and On-the-Go Beverage Solutions
The market driver for ready-to-drink green tea is the demand for convenient and on-the-go beverage solutions. In today's fast-paced lifestyle, consumers are seeking convenient options that fit seamlessly into their busy schedules. Ready-to-drink green tea provides a convenient and portable alternative to brewing tea at home or purchasing it from cafes, allowing consumers to enjoy the refreshing taste and health benefits of green tea wherever they go. This driver is reinforced by the increasing urbanization, longer work hours, and desire for quick, yet nutritious beverage choices that cater to on-the-go lifestyles.
Market Opportunity: Innovation in Flavor Varieties and Functional Additives
One potential opportunity for the ready-to-drink green tea market lies in innovation in flavor varieties and functional additives. While traditional green tea remains popular, there is room for expansion by offering a diverse range of flavor options to appeal to different taste preferences and market segments. Additionally, incorporating functional additives such as herbs, fruit extracts, vitamins, and adaptogens into ready-to-drink green tea formulations can enhance their nutritional profile and provide added health benefits. By leveraging flavor innovation and functional ingredients, brands can differentiate their products, attract a broader consumer base, and capitalize on the growing demand for premium and functional beverages in the green tea market segment.
Ready To Drink Green Tea Market Share Analysis: Plastic Bottles held the dominant market share in 2024
In the Ready to Drink Green Tea market segmented by packaging, Plastic Bottles emerge as the largest segment, driven by their convenience, durability, and widespread availability. Plastic bottles offer a lightweight and portable packaging solution, making them ideal for on-the-go consumption of ready-to-drink green tea. Their durability ensures product integrity during transportation and handling, while their shatter-resistant properties make them suitable for various environments, including outdoor activities and travel. Additionally, plastic bottles are widely accepted by consumers due to their familiarity and ease of use. Further, the dominance of plastic bottles in the market is reinforced by the extensive presence of green tea brands offering their products in this packaging format, as well as the cost-effectiveness of plastic compared to other packaging materials. Furthermore, the convenience of plastic bottles aligns with consumer preferences for quick and convenient beverage options, contributing to their popularity and dominance as the largest segment in the Ready to Drink Green Tea market.
Ready To Drink Green Tea Market Share Analysis: Flavored market is poised to register the fastest growth rae over the forecast period to 2032
In the Ready to Drink Green Tea market segmented by type, the Flavored segment is the fastest-growing, driven by evolving consumer preferences for innovative and diverse beverage options. Flavored green teas offer consumers a refreshing twist on traditional green tea, with a variety of fruit, floral, and herbal flavor infusions that appeal to different taste preferences. These flavored varieties provide a more enticing and enjoyable drinking experience, attracting consumers seeking novel flavors and sensory experiences. Further, flavored green teas often incorporate natural ingredients and botanical extracts, aligning with consumer demand for healthier and more natural beverage choices. Additionally, the versatility of flavored green teas allows for creativity in product development, leading to a wide range of flavor combinations and product offerings that cater to changing consumer trends and preferences. Furthermore, the growing awareness of the health benefits associated with green tea, combined with the appeal of flavorful options, drives the rapid growth of the Flavored segment in the Ready to Drink Green Tea market. Overall, the combination of unique flavors, health benefits, and consumer demand for variety positions the Flavored segment as the fastest-growing in the market.
Ready To Drink Green Tea Market Share Analysis: Supermarkets/Hypermarkets held the dominant market share in 2024
In the Ready to Drink Green Tea market segmented by distribution channel, Supermarkets/Hypermarkets emerge as the largest segment, driven by their extensive reach, diverse product offerings, and consumer convenience. Supermarkets and hypermarkets serve as key destinations for consumers to purchase ready-to-drink green tea due to their wide selection of beverage options and one-stop shopping convenience. These retail giants leverage their expansive floor space and strategic placement of products to ensure high visibility and accessibility for consumers. Further, supermarkets and hypermarkets often run promotional campaigns and offer discounts on ready-to-drink green tea, attracting budget-conscious shoppers. Additionally, the established distribution networks of supermarkets and hypermarkets enable efficient supply chain management, ensuring consistent availability of green tea products to meet consumer demand. Furthermore, the growing trend of health-consciousness among consumers has led supermarkets and hypermarkets to expand their selection of healthier beverage options, including ready-to-drink green tea, further solidifying their dominance as the largest distribution channel in the market.
Ready To Drink Green Tea Market Segmentation
By Packaging
Plastic Bottles
Cans
Others
By Type
Flavored
Unflavored
By Distribution Channel
Supermarkets/Hypermarkets
Convenience Stores
Specialty Stores
Online stores
Others
Countries Analyzed
North America (US, Canada, Mexico)
Europe (Germany, UK, France, Spain, Italy, Russia, Rest of Europe)
Asia Pacific (China, India, Japan, South Korea, Australia, South East Asia, Rest of Asia)
South America (Brazil, Argentina, Rest of South America)
Middle East and Africa (Saudi Arabia, UAE, Rest of Middle East, South Africa, Egypt, Rest of Africa)
Ready To Drink Green Tea Companies Profiled in the Study
Associated British Foods Plc
ITO EN Ltd
Keurig Dr Pepper Inc
Nestle SA
PepsiCo Inc
Suntory Holdings Ltd
The Coca Cola Company
Tingyi (Cayman Islands) Holding Corp
Unilever Plc
Vivid Vitality Ltd
*- List Not Exhaustive
Chapter 1. TABLE OF CONTENTS
Chapter 2. Introduction to Ready To Drink Green Tea Market
2.1. Market Overview
2.2. Key Statistics and Report Highlights
2.3. Scope of the Comprehensive Study
2.3.1. Market Definition
2.3.2 Countries and Regions Covered
2.3.3 Research Objective
2.3.4 Units, Currency, and Conversions
2.3.5 Industry Value Chain
2.4. Key Market Segments
2.5. Key Companies
2.6. Study Period
Chapter 3. Strategic Analysis Review
3.1. Ready To Drink Green Tea Pricing Analysis and Forecast
3.2. Porter’s Five Forces
3.3. Market Ecosystem
3.4. SWOT Analysis
3.5. Regulatory Scenario
3.3. Effects of Inflation, Russia-Ukraine War, moderating economic growth, and other macroeconomic factors
Chapter 4. Competitive Landscape
4.1. Market Share Analysis
4.1.1. Global Ready To Drink Green Tea Market Share by Company, 2023
4.1.2. Product Offerings of Leading Ready To Drink Green Tea Companies
4.2. Market Entropy
4.2.1. New Product Launches in the Industry
4.2.2. Mergers, Acquisitions, Joint ventures, and Partnerships
4.3. Key Strategies and Best Practices
Chapter 5. Global Market Projections: Best, Reference, and Low Case Scenarios
5.1. Growth Analysis- Case Scenario Definitions
5.2. Low Growth Case Scenario Forecasts
5.3. Reference Growth Case Scenario Forecasts
5.4. High Growth Case Scenario Forecasts
Chapter 6. Market Dynamics
6.1. Ready To Drink Green Tea Market Drivers
6.2. Ready To Drink Green Tea Market Challenges
6.6. Ready To Drink Green Tea Market Opportunities
6.4. Ready To Drink Green Tea Market Trends
Chapter 7. Global Ready To Drink Green Tea Market Outlook Trends
7.1. Global Ready To Drink Green Tea Revenue (USD Million) and CAGR (%) by Type (2021-2032)
7.2. Global Ready To Drink Green Tea Revenue (USD Million) and CAGR (%) by Application (2021-2032)
7.3. Global Ready To Drink Green Tea Revenue (USD Million) and CAGR (%) by Product (2021-2032)
By Packaging
Plastic Bottles
Cans
Others
By Type
Flavored
Unflavored
By Distribution Channel
Supermarkets/Hypermarkets
Convenience Stores
Specialty Stores
Online stores
Others
Chapter 8. Global Ready To Drink Green Tea Regional Analysis and Outlook
8.1. Global Ready To Drink Green Tea Revenue (USD Million) By Regions (2021- 2032)
8.2. North America Ready To Drink Green Tea Revenue (USD Million) by Country (2021-2032)
8.2.1. United States Ready To Drink Green Tea Regional Analysis and Outlook
8.2.2. Canada Ready To Drink Green Tea Regional Analysis and Outlook
8.2.3. Mexico Ready To Drink Green Tea Regional Analysis and Outlook
8.3. Europe Ready To Drink Green Tea Revenue (USD Million), by Country (2021-2032)
8.3.1. Germany Ready To Drink Green Tea Regional Analysis and Outlook
8.3.2. France Ready To Drink Green Tea Regional Analysis and Outlook
8.3.3. United Kingdom Ready To Drink Green Tea Regional Analysis and Outlook
8.3.4. Spain Ready To Drink Green Tea Regional Analysis and Outlook
8.3.5. Italy Ready To Drink Green Tea Regional Analysis and Outlook
8.3.6. Russia Ready To Drink Green Tea Regional Analysis and Outlook
8.3.7. Rest of Europe Ready To Drink Green Tea Regional Analysis and Outlook
8.4. Asia Pacific Ready To Drink Green Tea Revenue (USD Million) by Country (2021-2032)
8.4.1. China Ready To Drink Green Tea Regional Analysis and Outlook
8.4.2. Japan Ready To Drink Green Tea Regional Analysis and Outlook
8.4.3. India Ready To Drink Green Tea Regional Analysis and Outlook
8.4.4. South Korea Ready To Drink Green Tea Regional Analysis and Outlook
8.4.5. Australia Ready To Drink Green Tea Regional Analysis and Outlook
8.4.6. South East Asia Ready To Drink Green Tea Regional Analysis and Outlook
8.4.7. Rest of Asia Pacific Ready To Drink Green Tea Regional Analysis and Outlook
8.5. South America Ready To Drink Green Tea Revenue (USD Million), by Country (2021-2032)
8.5.1. Brazil Ready To Drink Green Tea Regional Analysis and Outlook
8.5.2. Argentina Ready To Drink Green Tea Regional Analysis and Outlook
8.5.3. Rest of South America Ready To Drink Green Tea Regional Analysis and Outlook
8.6. Middle East and Africa Ready To Drink Green Tea Revenue (USD Million) by Country (2021-2032)
8.6.1. Middle East Ready To Drink Green Tea Regional Analysis and Outlook
8.6.2. Africa Ready To Drink Green Tea Regional Analysis and Outlook
Chapter 9. North America Ready To Drink Green Tea Analysis and Outlook
9.1. North America Ready To Drink Green Tea Revenue (USD Million) by Segments (2021-2032)
9.1.1. North America Ready To Drink Green Tea Revenue (USD Million) by Type (2021-2032)
9.1.2. North America Ready To Drink Green Tea Revenue (USD Million) by Application (2021-2032)
9.1.3. North America Ready To Drink Green Tea Revenue (USD Million) by Product (2021-2032)
By Packaging
Plastic Bottles
Cans
Others
By Type
Flavored
Unflavored
By Distribution Channel
Supermarkets/Hypermarkets
Convenience Stores
Specialty Stores
Online stores
Others
Chapter 10. Europe Ready To Drink Green Tea Analysis and Outlook
10.1. Europe Ready To Drink Green Tea Revenue (USD Million), by Segments (USD Million) (2021-2032)
10.1.1. Europe Ready To Drink Green Tea Revenue (USD Million) by Type (2021-2032)
10.1.2. Europe Ready To Drink Green Tea Revenue (USD Million) by Application (2021-2032)
10.1.3. Europe Ready To Drink Green Tea Revenue (USD Million) by Product (2021-2032)
By Packaging
Plastic Bottles
Cans
Others
By Type
Flavored
Unflavored
By Distribution Channel
Supermarkets/Hypermarkets
Convenience Stores
Specialty Stores
Online stores
Others
Chapter 11. Asia Pacific Ready To Drink Green Tea Analysis and Outlook
11.1. Asia Pacific Ready To Drink Green Tea Revenue (USD Million), and Revenue (USD Million) by Segments (2021-2032)
11.1.1. Asia Pacific Ready To Drink Green Tea Revenue (USD Million) by Type (2021-2032)
11.1.2. Asia Pacific Ready To Drink Green Tea Revenue (USD Million) by Application (2021-2032)
11.1.3. Asia Pacific Ready To Drink Green Tea Revenue (USD Million) by Product (2021-2032)
By Packaging
Plastic Bottles
Cans
Others
By Type
Flavored
Unflavored
By Distribution Channel
Supermarkets/Hypermarkets
Convenience Stores
Specialty Stores
Online stores
Others
Chapter 12. South America Ready To Drink Green Tea Analysis and Outlook
12.1. South America Ready To Drink Green Tea Revenue (USD Million), by Segments (2021-2032)
12.1.1. South America Ready To Drink Green Tea Revenue (USD Million) by Type (2021-2032)
12.1.2. South America Ready To Drink Green Tea Revenue (USD Million) by Application (2021-2032)
12.1.3. South America Ready To Drink Green Tea Revenue (USD Million) by Product (2021-2032)
By Packaging
Plastic Bottles
Cans
Others
By Type
Flavored
Unflavored
By Distribution Channel
Supermarkets/Hypermarkets
Convenience Stores
Specialty Stores
Online stores
Others
Chapter 13. Middle East and Africa Ready To Drink Green Tea Analysis and Outlook
13.1. Middle East and Africa Ready To Drink Green Tea Revenue (USD Million), by Segments (2021-2032)
13.1.1. Middle East and Africa Ready To Drink Green Tea Revenue (USD Million) by Type (2021-2032)
13.1.2. Middle East and Africa Ready To Drink Green Tea Revenue (USD Million) by Application (2021-2032)
13.1.3. Middle East and Africa Ready To Drink Green Tea Revenue (USD Million) by Product (2021-2032)
By Packaging
Plastic Bottles
Cans
Others
By Type
Flavored
Unflavored
By Distribution Channel
Supermarkets/Hypermarkets
Convenience Stores
Specialty Stores
Online stores
Others
Chapter 14. Ready To Drink Green Tea Company Profiles
14.1 Business Overview
14.2 Product Profiles
14.3 SWOT Profiles
14.5 Recent Developments
14.6 Financial Profile
List of Companies
Associated British Foods Plc
ITO EN Ltd
Keurig Dr Pepper Inc
Nestle SA
PepsiCo Inc
Suntory Holdings Ltd
The Coca Cola Company
Tingyi (Cayman Islands) Holding Corp
Unilever Plc
Vivid Vitality Ltd
15. Methodology and Data Sources
15.1 Customization Offerings
15.2 Subscription Services
15.3 Related Reports
15.4 Publisher Expertise
LIST OF TABLES
Table 1 Market Segmentation Analysis
Table 2 Global Ready To Drink Green Tea Market Share of Leading Companies, 2023
Table 3 Product Offerings of Leading Companies
Table 4 Low Growth Scenario Forecasts
Table 5 Reference Case Growth Scenario
Table 6 High Growth Case Scenario
Table 7 Global Ready To Drink Green Tea Revenue (USD Million) And CAGR (%) By Type (2021-2032)
Table 8 Global Ready To Drink Green Tea Revenue (USD Million) And CAGR (%) By Application (2021-2032)
Table 9 Global Ready To Drink Green Tea Revenue (USD Million) And CAGR (%) By Product (2021-2032)
Table 10 Global Ready To Drink Green Tea Market Revenue (USD Million) By Regions (2021-2032)
Table 11 Global Ready To Drink Green Tea Market Share (%) By Regions (2021-2032)
Table 12 North America Ready To Drink Green Tea Revenue (USD Million) By Country (2021-2032)
Table 13 Europe Ready To Drink Green Tea Revenue (USD Million) By Country (2021-2032)
Table 14 Asia Pacific Ready To Drink Green Tea Revenue (USD Million) By Country (2021-2032)
Table 15 South America Ready To Drink Green Tea Revenue (USD Million) By Country (2021-2032)
Table 16 Middle East and Africa Ready To Drink Green Tea Revenue (USD Million) By Region (2021-2032)
Table 17 North America Ready To Drink Green Tea Revenue (USD Million) By Type (2021-2032)
Table 18 North America Ready To Drink Green Tea Revenue (USD Million) By Application (2021-2032)
Table 19 North America Ready To Drink Green Tea Revenue (USD Million) By Product (2021-2032)
Table 20 Europe Ready To Drink Green Tea Revenue (USD Million) By Type (2021-2032)
Table 21 Europe Ready To Drink Green Tea Revenue (USD Million) By Application (2021-2032)
Table 22 Europe Ready To Drink Green Tea Revenue (USD Million) By Product (2021-2032)
Table 23 Asia Pacific Ready To Drink Green Tea Revenue (USD Million) By Type (2021-2032)
Table 24 Asia Pacific Ready To Drink Green Tea Revenue (USD Million) By Application (2021-2032)
Table 25 Asia Pacific Ready To Drink Green Tea Revenue (USD Million) By Product (2021-2032)
Table 26 South America Ready To Drink Green Tea Revenue (USD Million) By Type (2021-2032)
Table 27 South America Ready To Drink Green Tea Revenue (USD Million) By Application (2021-2032)
Table 28 South America Ready To Drink Green Tea Revenue (USD Million) By Product (2021-2032)
Table 29 Middle East and Africa Ready To Drink Green Tea Revenue (USD Million) By Type (2021-2032)
Table 30 Middle East and Africa Ready To Drink Green Tea Revenue (USD Million) By Application (2021-2032)
Table 31 Middle East and Africa Ready To Drink Green Tea Revenue (USD Million) By Product (2021-2032)
LIST OF FIGURES
Figure 1. Market Scope
Figure 2. Pricing Forecasts Per Unit, 2023- 2032
Figure 3. Porter’s Five Forces
Figure 4. Global Ready To Drink Green Tea Market Revenue (USD Million) By Regions (2021-2032)
Figure 5. Global Ready To Drink Green Tea Market Share (%) By Regions (2023)
Figure 6. North America Ready To Drink Green Tea Revenue (USD Million) By Country (2021-2032)
Figure 7. United States Ready To Drink Green Tea Revenue (USD Million) By Country (2021-2032)
Figure 8. Canada Ready To Drink Green Tea Revenue (USD Million) By Country (2021-2032)
Figure 9. Mexico Ready To Drink Green Tea Revenue (USD Million) By Country (2021-2032)
Figure 10. Europe Ready To Drink Green Tea Revenue (USD Million) By Country (2021-2032)
Figure 11. Germany Ready To Drink Green Tea Revenue (USD Million) By Country (2021-2032)
Figure 12. France Ready To Drink Green Tea Revenue (USD Million) By Country (2021-2032)
Figure 13. United Kingdom Ready To Drink Green Tea Revenue (USD Million) By Country (2021-2032)
Figure 14. Spain Ready To Drink Green Tea Revenue (USD Million) By Country (2021-2032)
Figure 15. Italy Ready To Drink Green Tea Revenue (USD Million) By Country (2021-2032)
Figure 16. Russia Ready To Drink Green Tea Revenue (USD Million) By Country (2021-2032)
Figure 17. Rest of Europe Ready To Drink Green Tea Revenue (USD Million) By Country (2021-2032)
Figure 11. Asia Pacific Ready To Drink Green Tea Revenue (USD Million) By Country (2021-2032)
Figure 12. China Ready To Drink Green Tea Revenue (USD Million) By Country (2021-2032)
Figure 13. Japan Ready To Drink Green Tea Revenue (USD Million) By Country (2021-2032)
Figure 14. India Ready To Drink Green Tea Revenue (USD Million) By Country (2021-2032)
Figure 15. South Korea Ready To Drink Green Tea Revenue (USD Million) By Country (2021-2032)
Figure 16. Australia Ready To Drink Green Tea Revenue (USD Million) By Country (2021-2032)
Figure 17. South East Asia Ready To Drink Green Tea Revenue (USD Million) By Country (2021-2032)
Figure 18. South America Ready To Drink Green Tea Revenue (USD Million) By Country (2021-2032)
Figure 19. Brazil Ready To Drink Green Tea Revenue (USD Million) By Country (2021-2032)
Figure 20. Argentina Ready To Drink Green Tea Revenue (USD Million) By Country (2021-2032)
Figure 21. Rest of Asia Pacific Ready To Drink Green Tea Revenue (USD Million) By Country (2021-2032)
Figure 22. Middle East and Africa Ready To Drink Green Tea Revenue (USD Million) By Region (2021-2032)
Figure 23. Saudi Arabia Ready To Drink Green Tea Revenue (USD Million) By Region (2021-2032)
Figure 24. The UAE Ready To Drink Green Tea Revenue (USD Million) By Region (2021-2032)
Figure 25. Rest of Middle East Ready To Drink Green Tea Revenue (USD Million) By Region (2021-2032)
Figure 26. South Africa Ready To Drink Green Tea Revenue (USD Million) By Region (2021-2032)
Figure 27. Africa Ready To Drink Green Tea Revenue (USD Million) By Region (2021-2032)
Figure 28. North America Ready To Drink Green Tea Revenue (USD Million) By Type (2021-2032)
Figure 29. North America Ready To Drink Green Tea Revenue (USD Million) By Application (2021-2032)
Figure 30. North America Ready To Drink Green Tea Revenue (USD Million) By Product (2021-2032)
Figure 31. Europe Ready To Drink Green Tea Revenue (USD Million) By Type (2021-2032)
Figure 32. Europe Ready To Drink Green Tea Revenue (USD Million) By Application (2021-2032)
Figure 33. Europe Ready To Drink Green Tea Revenue (USD Million) By Product (2021-2032)
Figure 34. Asia Pacific Ready To Drink Green Tea Revenue (USD Million) By Type (2021-2032)
Figure 35. Asia Pacific Ready To Drink Green Tea Revenue (USD Million) By Application (2021-2032)
Figure 36. Asia Pacific Ready To Drink Green Tea Revenue (USD Million) By Product (2021-2032)
Figure 37. South America Ready To Drink Green Tea Revenue (USD Million) By Type (2021-2032)
Figure 38. South America Ready To Drink Green Tea Revenue (USD Million) By Application (2021-2032)
Figure 39. South America Ready To Drink Green Tea Revenue (USD Million) By Product (2021-2032)
Figure 40. Middle East and Africa Ready To Drink Green Tea Revenue (USD Million) By Type (2021-2032)
Figure 41. Middle East and Africa Ready To Drink Green Tea Revenue (USD Million) By Application (2021-2032)
Figure 42. Middle East and Africa Ready To Drink Green Tea Revenue (USD Million) By Product (2021-2032)
By Packaging
Plastic Bottles
Cans
Others
By Type
Flavored
Unflavored
By Distribution Channel
Supermarkets/Hypermarkets
Convenience Stores
Specialty Stores
Online stores
Others
Countries Analyzed
North America (US, Canada, Mexico)
Europe (Germany, UK, France, Spain, Italy, Russia, Rest of Europe)
Asia Pacific (China, India, Japan, South Korea, Australia, South East Asia, Rest of Asia)
South America (Brazil, Argentina, Rest of South America)
Middle East and Africa (Saudi Arabia, UAE, Rest of Middle East, South Africa, Egypt, Rest of Africa)
