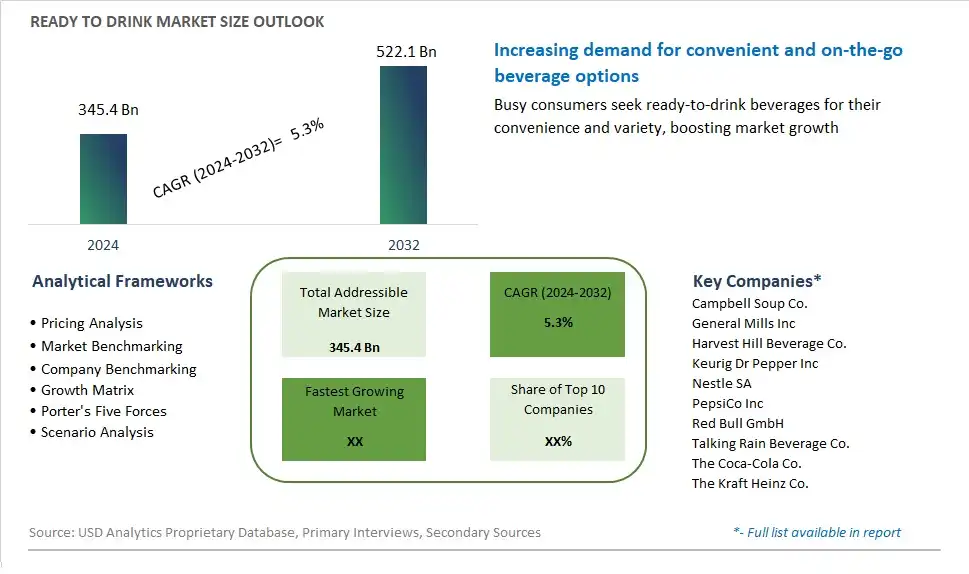
Global Ready to Drink Market Size is valued at $345.4 Billion in 2024 and is forecast to register a growth rate (CAGR) of 5.3% to reach $522.1 Billion by 2032.
The global Ready to Drink Market Comprehensive Study analyzes and forecasts the market size across 6 regions and 24 countries for diverse segments -By Type (Non-Alcoholic, Alcoholic), By Distribution Channel (Supermarkets/Hypermarkets, Convenience/Grocery Stores, Online Stores, Specialty Retail Stores, Others)
An Introduction to Ready to Drink Market
The ready-to-drink (RTD) market in 2024 is booming, fueled by consumer demand for convenience, health benefits, and innovative flavors. RTD beverages encompass a wide range of products, including teas, coffees, juices, smoothies, and functional drinks. The market is driven by busy lifestyles, increasing health awareness, and the desire for on-the-go nutrition. Manufacturers are focusing on clean label ingredients, reduced sugar content, and functional benefits such as energy-boosting, hydration, and digestive health. The rise of e-commerce and direct-to-consumer sales channels is also enhancing market accessibility and growth. Additionally, sustainability trends are pushing companies to adopt eco-friendly packaging solutions.
Ready to Drink Competitive Landscape
The market report analyses the leading companies in the industry including Campbell Soup Co., General Mills Inc, Harvest Hill Beverage Co., Keurig Dr Pepper Inc, Nestle SA, PepsiCo Inc, Red Bull GmbH, Talking Rain Beverage Co., The Coca-Cola Co. , The Kraft Heinz Co., and Others.
Ready to Drink Market Dynamics
Market Trend: Growing Demand for Convenient Beverage Options
The most prominent trend in the Ready-to-Drink (RTD) Market is the growing demand for convenient beverage options. As consumers lead increasingly busy lifestyles, there is a rising preference for beverages that are ready to consume without any preparation. This trend is driven by the need for convenience, portability, and on-the-go consumption, making RTD beverages an attractive choice for modern consumers
Market Driver: Health and Wellness Movement
The health and wellness movement is a major driver of the Ready-to-Drink (RTD) Market. Consumers are seeking RTD beverages that offer health benefits, such as functional ingredients, low sugar content, and natural flavors. The demand for healthier beverage options is driving the development and popularity of RTD products that align with consumers' wellness goals, such as fortified waters, protein shakes, and herbal teas
Market Opportunity: Innovation in Flavor and Packaging
A significant opportunity in the Ready-to-Drink (RTD) Market lies in innovation in flavor and packaging. Companies can attract consumers by offering unique and exotic flavors, as well as innovative packaging designs that enhance convenience and sustainability. By focusing on flavor diversity and eco-friendly packaging solutions, brands can differentiate their products and capture a larger share of the growing RTD market
Ready to Drink Market Share Analysis: Non-Alcoholic held the dominant market share in 2024
In the Ready to Drink market segmented by type, the Non-Alcoholic segment is the largest, driven by its broader consumer base, diverse product offerings, and increasing health-consciousness among consumers. Non-alcoholic ready-to-drink beverages cater to a wide range of consumers, including individuals of all ages, dietary preferences, and lifestyles, making them a staple in households and on-the-go consumption. These beverages include a variety of options such as soft drinks, juices, energy drinks, ready-to-drink teas and coffees, flavored waters, and functional beverages, offering something for everyone. Additionally, the growing trend towards health and wellness fuels the demand for non-alcoholic options, as consumers seek healthier alternatives to sugary sodas and alcoholic beverages. Further, non-alcoholic ready-to-drink beverages are often marketed as refreshing, hydrating, and convenient options for various occasions, including sports events, picnics, and social gatherings. Furthermore, the accessibility of non-alcoholic beverages in supermarkets, convenience stores, vending machines, and online platforms ensures widespread availability and consumer access, contributing to the dominance of the Non-Alcoholic segment in the Ready to Drink market. Overall, the broad appeal, diverse product offerings, and health-conscious consumer trends position the Non-Alcoholic segment as the largest and most dominant in the market.
Ready to Drink Market Share Analysis: Online Stores market is poised to register the fastest growth rae over the forecast period to 2032
In the Ready to Drink market segmented by distribution channel, the Online Stores segment is the fastest-growing, driven by the increasing prevalence of e-commerce platforms, changing consumer shopping habits, and the convenience of online shopping. Online stores offer consumers a convenient and hassle-free way to purchase ready-to-drink beverages from the comfort of their homes, with the added benefit of a wide selection and competitive pricing. Additionally, the COVID-19 pandemic has accelerated the shift towards online shopping, as consumers prioritize safety and social distancing measures. Further, online platforms provide opportunities for ready-to-drink beverage brands to reach a broader audience, including consumers in remote areas or those with limited access to physical stores. Furthermore, the availability of subscription services, personalized recommendations, and promotional offers on online platforms incentivizes consumers to explore and purchase ready-to-drink beverages online. Overall, the convenience, accessibility, and evolving consumer preferences towards online shopping drive the rapid growth of the Online Stores segment in the Ready to Drink market.
Ready to Drink Market Segmentation
By Type
Non-Alcoholic
Alcoholic
By Distribution Channel
Supermarkets/Hypermarkets
Convenience/Grocery Stores
Online Stores
Specialty Retail Stores
Others
Countries Analyzed
North America (US, Canada, Mexico)
Europe (Germany, UK, France, Spain, Italy, Russia, Rest of Europe)
Asia Pacific (China, India, Japan, South Korea, Australia, South East Asia, Rest of Asia)
South America (Brazil, Argentina, Rest of South America)
Middle East and Africa (Saudi Arabia, UAE, Rest of Middle East, South Africa, Egypt, Rest of Africa)
Ready to Drink Companies Profiled in the Study
Campbell Soup Co.
General Mills Inc
Harvest Hill Beverage Co.
Keurig Dr Pepper Inc
Nestle SA
PepsiCo Inc
Red Bull GmbH
Talking Rain Beverage Co.
The Coca-Cola Co.
The Kraft Heinz Co.
*- List Not Exhaustive
Chapter 1. TABLE OF CONTENTS
Chapter 2. Introduction to Ready to Drink Market
2.1. Market Overview
2.2. Key Statistics and Report Highlights
2.3. Scope of the Comprehensive Study
2.3.1. Market Definition
2.3.2 Countries and Regions Covered
2.3.3 Research Objective
2.3.4 Units, Currency, and Conversions
2.3.5 Industry Value Chain
2.4. Key Market Segments
2.5. Key Companies
2.6. Study Period
Chapter 3. Strategic Analysis Review
3.1. Ready to Drink Pricing Analysis and Forecast
3.2. Porter’s Five Forces
3.3. Market Ecosystem
3.4. SWOT Analysis
3.5. Regulatory Scenario
3.3. Effects of Inflation, Russia-Ukraine War, moderating economic growth, and other macroeconomic factors
Chapter 4. Competitive Landscape
4.1. Market Share Analysis
4.1.1. Global Ready to Drink Market Share by Company, 2023
4.1.2. Product Offerings of Leading Ready to Drink Companies
4.2. Market Entropy
4.2.1. New Product Launches in the Industry
4.2.2. Mergers, Acquisitions, Joint ventures, and Partnerships
4.3. Key Strategies and Best Practices
Chapter 5. Global Market Projections: Best, Reference, and Low Case Scenarios
5.1. Growth Analysis- Case Scenario Definitions
5.2. Low Growth Case Scenario Forecasts
5.3. Reference Growth Case Scenario Forecasts
5.4. High Growth Case Scenario Forecasts
Chapter 6. Market Dynamics
6.1. Ready to Drink Market Drivers
6.2. Ready to Drink Market Challenges
6.6. Ready to Drink Market Opportunities
6.4. Ready to Drink Market Trends
Chapter 7. Global Ready to Drink Market Outlook Trends
7.1. Global Ready to Drink Revenue (USD Million) and CAGR (%) by Type (2021-2032)
7.2. Global Ready to Drink Revenue (USD Million) and CAGR (%) by Application (2021-2032)
7.3. Global Ready to Drink Revenue (USD Million) and CAGR (%) by Product (2021-2032)
By Type
Non-Alcoholic
Alcoholic
By Distribution Channel
Supermarkets/Hypermarkets
Convenience/Grocery Stores
Online Stores
Specialty Retail Stores
Others
Chapter 8. Global Ready to Drink Regional Analysis and Outlook
8.1. Global Ready to Drink Revenue (USD Million) By Regions (2021- 2032)
8.2. North America Ready to Drink Revenue (USD Million) by Country (2021-2032)
8.2.1. United States Ready to Drink Regional Analysis and Outlook
8.2.2. Canada Ready to Drink Regional Analysis and Outlook
8.2.3. Mexico Ready to Drink Regional Analysis and Outlook
8.3. Europe Ready to Drink Revenue (USD Million), by Country (2021-2032)
8.3.1. Germany Ready to Drink Regional Analysis and Outlook
8.3.2. France Ready to Drink Regional Analysis and Outlook
8.3.3. United Kingdom Ready to Drink Regional Analysis and Outlook
8.3.4. Spain Ready to Drink Regional Analysis and Outlook
8.3.5. Italy Ready to Drink Regional Analysis and Outlook
8.3.6. Russia Ready to Drink Regional Analysis and Outlook
8.3.7. Rest of Europe Ready to Drink Regional Analysis and Outlook
8.4. Asia Pacific Ready to Drink Revenue (USD Million) by Country (2021-2032)
8.4.1. China Ready to Drink Regional Analysis and Outlook
8.4.2. Japan Ready to Drink Regional Analysis and Outlook
8.4.3. India Ready to Drink Regional Analysis and Outlook
8.4.4. South Korea Ready to Drink Regional Analysis and Outlook
8.4.5. Australia Ready to Drink Regional Analysis and Outlook
8.4.6. South East Asia Ready to Drink Regional Analysis and Outlook
8.4.7. Rest of Asia Pacific Ready to Drink Regional Analysis and Outlook
8.5. South America Ready to Drink Revenue (USD Million), by Country (2021-2032)
8.5.1. Brazil Ready to Drink Regional Analysis and Outlook
8.5.2. Argentina Ready to Drink Regional Analysis and Outlook
8.5.3. Rest of South America Ready to Drink Regional Analysis and Outlook
8.6. Middle East and Africa Ready to Drink Revenue (USD Million) by Country (2021-2032)
8.6.1. Middle East Ready to Drink Regional Analysis and Outlook
8.6.2. Africa Ready to Drink Regional Analysis and Outlook
Chapter 9. North America Ready to Drink Analysis and Outlook
9.1. North America Ready to Drink Revenue (USD Million) by Segments (2021-2032)
9.1.1. North America Ready to Drink Revenue (USD Million) by Type (2021-2032)
9.1.2. North America Ready to Drink Revenue (USD Million) by Application (2021-2032)
9.1.3. North America Ready to Drink Revenue (USD Million) by Product (2021-2032)
By Type
Non-Alcoholic
Alcoholic
By Distribution Channel
Supermarkets/Hypermarkets
Convenience/Grocery Stores
Online Stores
Specialty Retail Stores
Others
Chapter 10. Europe Ready to Drink Analysis and Outlook
10.1. Europe Ready to Drink Revenue (USD Million), by Segments (USD Million) (2021-2032)
10.1.1. Europe Ready to Drink Revenue (USD Million) by Type (2021-2032)
10.1.2. Europe Ready to Drink Revenue (USD Million) by Application (2021-2032)
10.1.3. Europe Ready to Drink Revenue (USD Million) by Product (2021-2032)
By Type
Non-Alcoholic
Alcoholic
By Distribution Channel
Supermarkets/Hypermarkets
Convenience/Grocery Stores
Online Stores
Specialty Retail Stores
Others
Chapter 11. Asia Pacific Ready to Drink Analysis and Outlook
11.1. Asia Pacific Ready to Drink Revenue (USD Million), and Revenue (USD Million) by Segments (2021-2032)
11.1.1. Asia Pacific Ready to Drink Revenue (USD Million) by Type (2021-2032)
11.1.2. Asia Pacific Ready to Drink Revenue (USD Million) by Application (2021-2032)
11.1.3. Asia Pacific Ready to Drink Revenue (USD Million) by Product (2021-2032)
By Type
Non-Alcoholic
Alcoholic
By Distribution Channel
Supermarkets/Hypermarkets
Convenience/Grocery Stores
Online Stores
Specialty Retail Stores
Others
Chapter 12. South America Ready to Drink Analysis and Outlook
12.1. South America Ready to Drink Revenue (USD Million), by Segments (2021-2032)
12.1.1. South America Ready to Drink Revenue (USD Million) by Type (2021-2032)
12.1.2. South America Ready to Drink Revenue (USD Million) by Application (2021-2032)
12.1.3. South America Ready to Drink Revenue (USD Million) by Product (2021-2032)
By Type
Non-Alcoholic
Alcoholic
By Distribution Channel
Supermarkets/Hypermarkets
Convenience/Grocery Stores
Online Stores
Specialty Retail Stores
Others
Chapter 13. Middle East and Africa Ready to Drink Analysis and Outlook
13.1. Middle East and Africa Ready to Drink Revenue (USD Million), by Segments (2021-2032)
13.1.1. Middle East and Africa Ready to Drink Revenue (USD Million) by Type (2021-2032)
13.1.2. Middle East and Africa Ready to Drink Revenue (USD Million) by Application (2021-2032)
13.1.3. Middle East and Africa Ready to Drink Revenue (USD Million) by Product (2021-2032)
By Type
Non-Alcoholic
Alcoholic
By Distribution Channel
Supermarkets/Hypermarkets
Convenience/Grocery Stores
Online Stores
Specialty Retail Stores
Others
Chapter 14. Ready to Drink Company Profiles
14.1 Business Overview
14.2 Product Profiles
14.3 SWOT Profiles
14.5 Recent Developments
14.6 Financial Profile
List of Companies
Campbell Soup Co.
General Mills Inc
Harvest Hill Beverage Co.
Keurig Dr Pepper Inc
Nestle SA
PepsiCo Inc
Red Bull GmbH
Talking Rain Beverage Co.
The Coca-Cola Co.
The Kraft Heinz Co.
15. Methodology and Data Sources
15.1 Customization Offerings
15.2 Subscription Services
15.3 Related Reports
15.4 Publisher Expertise
LIST OF TABLES
Table 1 Market Segmentation Analysis
Table 2 Global Ready to Drink Market Share of Leading Companies, 2023
Table 3 Product Offerings of Leading Companies
Table 4 Low Growth Scenario Forecasts
Table 5 Reference Case Growth Scenario
Table 6 High Growth Case Scenario
Table 7 Global Ready to Drink Revenue (USD Million) And CAGR (%) By Type (2021-2032)
Table 8 Global Ready to Drink Revenue (USD Million) And CAGR (%) By Application (2021-2032)
Table 9 Global Ready to Drink Revenue (USD Million) And CAGR (%) By Product (2021-2032)
Table 10 Global Ready to Drink Market Revenue (USD Million) By Regions (2021-2032)
Table 11 Global Ready to Drink Market Share (%) By Regions (2021-2032)
Table 12 North America Ready to Drink Revenue (USD Million) By Country (2021-2032)
Table 13 Europe Ready to Drink Revenue (USD Million) By Country (2021-2032)
Table 14 Asia Pacific Ready to Drink Revenue (USD Million) By Country (2021-2032)
Table 15 South America Ready to Drink Revenue (USD Million) By Country (2021-2032)
Table 16 Middle East and Africa Ready to Drink Revenue (USD Million) By Region (2021-2032)
Table 17 North America Ready to Drink Revenue (USD Million) By Type (2021-2032)
Table 18 North America Ready to Drink Revenue (USD Million) By Application (2021-2032)
Table 19 North America Ready to Drink Revenue (USD Million) By Product (2021-2032)
Table 20 Europe Ready to Drink Revenue (USD Million) By Type (2021-2032)
Table 21 Europe Ready to Drink Revenue (USD Million) By Application (2021-2032)
Table 22 Europe Ready to Drink Revenue (USD Million) By Product (2021-2032)
Table 23 Asia Pacific Ready to Drink Revenue (USD Million) By Type (2021-2032)
Table 24 Asia Pacific Ready to Drink Revenue (USD Million) By Application (2021-2032)
Table 25 Asia Pacific Ready to Drink Revenue (USD Million) By Product (2021-2032)
Table 26 South America Ready to Drink Revenue (USD Million) By Type (2021-2032)
Table 27 South America Ready to Drink Revenue (USD Million) By Application (2021-2032)
Table 28 South America Ready to Drink Revenue (USD Million) By Product (2021-2032)
Table 29 Middle East and Africa Ready to Drink Revenue (USD Million) By Type (2021-2032)
Table 30 Middle East and Africa Ready to Drink Revenue (USD Million) By Application (2021-2032)
Table 31 Middle East and Africa Ready to Drink Revenue (USD Million) By Product (2021-2032)
LIST OF FIGURES
Figure 1. Market Scope
Figure 2. Pricing Forecasts Per Unit, 2023- 2032
Figure 3. Porter’s Five Forces
Figure 4. Global Ready to Drink Market Revenue (USD Million) By Regions (2021-2032)
Figure 5. Global Ready to Drink Market Share (%) By Regions (2023)
Figure 6. North America Ready to Drink Revenue (USD Million) By Country (2021-2032)
Figure 7. United States Ready to Drink Revenue (USD Million) By Country (2021-2032)
Figure 8. Canada Ready to Drink Revenue (USD Million) By Country (2021-2032)
Figure 9. Mexico Ready to Drink Revenue (USD Million) By Country (2021-2032)
Figure 10. Europe Ready to Drink Revenue (USD Million) By Country (2021-2032)
Figure 11. Germany Ready to Drink Revenue (USD Million) By Country (2021-2032)
Figure 12. France Ready to Drink Revenue (USD Million) By Country (2021-2032)
Figure 13. United Kingdom Ready to Drink Revenue (USD Million) By Country (2021-2032)
Figure 14. Spain Ready to Drink Revenue (USD Million) By Country (2021-2032)
Figure 15. Italy Ready to Drink Revenue (USD Million) By Country (2021-2032)
Figure 16. Russia Ready to Drink Revenue (USD Million) By Country (2021-2032)
Figure 17. Rest of Europe Ready to Drink Revenue (USD Million) By Country (2021-2032)
Figure 11. Asia Pacific Ready to Drink Revenue (USD Million) By Country (2021-2032)
Figure 12. China Ready to Drink Revenue (USD Million) By Country (2021-2032)
Figure 13. Japan Ready to Drink Revenue (USD Million) By Country (2021-2032)
Figure 14. India Ready to Drink Revenue (USD Million) By Country (2021-2032)
Figure 15. South Korea Ready to Drink Revenue (USD Million) By Country (2021-2032)
Figure 16. Australia Ready to Drink Revenue (USD Million) By Country (2021-2032)
Figure 17. South East Asia Ready to Drink Revenue (USD Million) By Country (2021-2032)
Figure 18. South America Ready to Drink Revenue (USD Million) By Country (2021-2032)
Figure 19. Brazil Ready to Drink Revenue (USD Million) By Country (2021-2032)
Figure 20. Argentina Ready to Drink Revenue (USD Million) By Country (2021-2032)
Figure 21. Rest of Asia Pacific Ready to Drink Revenue (USD Million) By Country (2021-2032)
Figure 22. Middle East and Africa Ready to Drink Revenue (USD Million) By Region (2021-2032)
Figure 23. Saudi Arabia Ready to Drink Revenue (USD Million) By Region (2021-2032)
Figure 24. The UAE Ready to Drink Revenue (USD Million) By Region (2021-2032)
Figure 25. Rest of Middle East Ready to Drink Revenue (USD Million) By Region (2021-2032)
Figure 26. South Africa Ready to Drink Revenue (USD Million) By Region (2021-2032)
Figure 27. Africa Ready to Drink Revenue (USD Million) By Region (2021-2032)
Figure 28. North America Ready to Drink Revenue (USD Million) By Type (2021-2032)
Figure 29. North America Ready to Drink Revenue (USD Million) By Application (2021-2032)
Figure 30. North America Ready to Drink Revenue (USD Million) By Product (2021-2032)
Figure 31. Europe Ready to Drink Revenue (USD Million) By Type (2021-2032)
Figure 32. Europe Ready to Drink Revenue (USD Million) By Application (2021-2032)
Figure 33. Europe Ready to Drink Revenue (USD Million) By Product (2021-2032)
Figure 34. Asia Pacific Ready to Drink Revenue (USD Million) By Type (2021-2032)
Figure 35. Asia Pacific Ready to Drink Revenue (USD Million) By Application (2021-2032)
Figure 36. Asia Pacific Ready to Drink Revenue (USD Million) By Product (2021-2032)
Figure 37. South America Ready to Drink Revenue (USD Million) By Type (2021-2032)
Figure 38. South America Ready to Drink Revenue (USD Million) By Application (2021-2032)
Figure 39. South America Ready to Drink Revenue (USD Million) By Product (2021-2032)
Figure 40. Middle East and Africa Ready to Drink Revenue (USD Million) By Type (2021-2032)
Figure 41. Middle East and Africa Ready to Drink Revenue (USD Million) By Application (2021-2032)
Figure 42. Middle East and Africa Ready to Drink Revenue (USD Million) By Product (2021-2032)
By Type
Non-Alcoholic
Alcoholic
By Distribution Channel
Supermarkets/Hypermarkets
Convenience/Grocery Stores
Online Stores
Specialty Retail Stores
Others
Countries Analyzed
North America (US, Canada, Mexico)
Europe (Germany, UK, France, Spain, Italy, Russia, Rest of Europe)
Asia Pacific (China, India, Japan, South Korea, Australia, South East Asia, Rest of Asia)
South America (Brazil, Argentina, Rest of South America)
Middle East and Africa (Saudi Arabia, UAE, Rest of Middle East, South Africa, Egypt, Rest of Africa)
