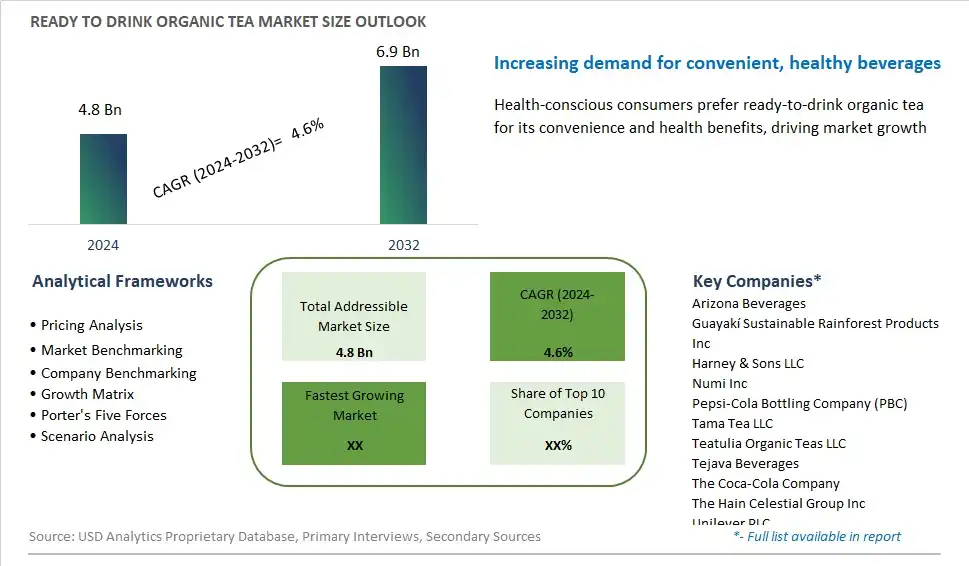
Global Ready to Drink Organic Tea Market Size is valued at $4.8 Billion in 2024 and is forecast to register a growth rate (CAGR) of 4.6% to reach $6.9 Billion by 2032.
The global Ready to Drink Organic Tea Market Comprehensive Study analyzes and forecasts the market size across 6 regions and 24 countries for diverse segments -By Type (Black, Green, Herbal, Others), By Distribution Channel (Supermarkets/Hypermarkets, Convenience stores, Online)
An Introduction to Ready to Drink Organic Tea Market
In 2024, the ready-to-drink organic tea market is experiencing robust growth as consumers increasingly prioritize health and wellness. This market segment is characterized by an array of organic tea-based beverages, including herbal infusions, green tea blends, and kombucha, which are conveniently packaged and ready to consume. With a focus on clean labels and natural ingredients, manufacturers are capitalizing on the perceived health benefits and sustainability credentials of organic tea. As consumer demand for on-the-go refreshment options continues to rise, ready-to-drink organic teas are positioned as a convenient and wholesome choice for discerning consumers seeking refreshment without compromising on taste or quality.
Ready to Drink Organic Tea Competitive Landscape
The market report analyses the leading companies in the industry including Arizona Beverages, Guayakí Sustainable Rainforest Products Inc, Harney & Sons LLC, Numi Inc, Pepsi-Cola Bottling Company (PBC), Tama Tea LLC, Teatulia Organic Teas LLC, Tejava Beverages, The Coca-Cola Company, The Hain Celestial Group Inc, Unilever PLC, Zevia LLC, and Others.
Ready to Drink Organic Tea Market Dynamics
Ready to Drink Organic Tea Market Trend: Growing Demand for Health-Conscious Beverages
The market for ready-to-drink organic tea is experiencing a prominent trend driven by the growing demand for health-conscious beverages. Consumers are increasingly seeking natural and organic options that offer both refreshment and wellness benefits. Ready-to-drink organic tea fulfills this demand by providing a convenient and flavorful beverage choice that is free from artificial additives, preservatives, and synthetic flavors. As individuals prioritize their health and well-being, organic tea products are gaining popularity as a refreshing and hydrating option that also offers antioxidants and other health-promoting compounds found in tea leaves.
Market Driver: Shift Towards Sustainable and Ethical Consumption
The rapid expansion of the ready-to-drink organic tea market is primarily driven by the global shift towards sustainable and ethical consumption. Consumers are becoming more environmentally conscious and are seeking products that align with their values of sustainability and ethical sourcing. Ready-to-drink organic tea fits into this trend by offering products that are made from organically grown tea leaves, cultivated without synthetic pesticides or fertilizers, and sourced from environmentally responsible suppliers. Furthermore, many organic tea brands prioritize fair trade practices, ensuring that tea farmers receive fair wages and work in safe conditions. As consumers increasingly prioritize sustainability and ethical considerations in their purchasing decisions, the demand for ready-to-drink organic tea is expected to continue to rise.
Market Opportunity: Innovation in Flavor Profiles and Packaging
One significant opportunity within the ready-to-drink organic tea market lies in innovation in flavor profiles and packaging to cater to evolving consumer preferences and lifestyle needs. Brands can differentiate themselves by offering a diverse range of tea flavors, including traditional blends such as green tea, black tea, and herbal infusions, as well as unique and exotic flavor combinations that appeal to adventurous consumers. Moreover, exploring innovative packaging formats such as eco-friendly bottles, cans, and pouches can enhance convenience and portability while reducing environmental impact. Additionally, leveraging emerging trends such as functional ingredients, cold brew tea, and hybrid tea beverages can create opportunities for brands to introduce new and exciting products that meet the needs of health-conscious consumers seeking refreshing and flavorful beverage options. Collaborations with nutritionists, flavor experts, and sustainability advocates can drive product innovation and ensure that ready-to-drink organic tea offerings meet the highest standards of taste, quality, and sustainability. As the market for ready-to-drink organic tea continues to grow, brands that prioritize innovation, authenticity, and environmental stewardship are well-positioned to capitalize on the increasing consumer demand for healthy and sustainable beverage choices.
Ready to Drink Organic Tea Market Share Analysis: Green Tea held the dominant market share in 2024
Within the segmented landscape of the Ready to Drink Organic Tea Market categorized by Type, Green Tea is the largest and most prevalent segment, driven by several key factors. Green tea is renowned for its numerous health benefits, including antioxidants and metabolism-boosting properties, making it a popular choice among health-conscious consumers. Its refreshing taste and light flavor profile appeal to a wide audience, while its caffeine content provides a gentle energy boost without the jitters associated with coffee. Further, green tea's versatility allows for various flavor infusions and blends, further enhancing its appeal. While other types such as black tea and herbal tea also have their niches, the dominance of Green Tea persists due to its widespread popularity and association with wellness. As consumers increasingly seek healthier beverage options, the Green Tea segment is expected to maintain its dominance in the Ready to Drink Organic Tea Market, driving overall market sales and growth.
Ready to Drink Organic Tea Market Segmentation
By Type
Black
Green
Herbal
Others
By Distribution Channel
Supermarkets/Hypermarkets
Convenience stores
Online
Countries Analyzed
North America (US, Canada, Mexico)
Europe (Germany, UK, France, Spain, Italy, Russia, Rest of Europe)
Asia Pacific (China, India, Japan, South Korea, Australia, South East Asia, Rest of Asia)
South America (Brazil, Argentina, Rest of South America)
Middle East and Africa (Saudi Arabia, UAE, Rest of Middle East, South Africa, Egypt, Rest of Africa)
Ready to Drink Organic Tea Companies Profiled in the Study
Arizona Beverages
Guayakí Sustainable Rainforest Products Inc
Harney & Sons LLC
Numi Inc
Pepsi-Cola Bottling Company (PBC)
Tama Tea LLC
Teatulia Organic Teas LLC
Tejava Beverages
The Coca-Cola Company
The Hain Celestial Group Inc
Unilever PLC
Zevia LLC
*- List Not Exhaustive
Chapter 1. TABLE OF CONTENTS
Chapter 2. Introduction to Ready to Drink Organic Tea Market
2.1. Market Overview
2.2. Key Statistics and Report Highlights
2.3. Scope of the Comprehensive Study
2.3.1. Market Definition
2.3.2 Countries and Regions Covered
2.3.3 Research Objective
2.3.4 Units, Currency, and Conversions
2.3.5 Industry Value Chain
2.4. Key Market Segments
2.5. Key Companies
2.6. Study Period
Chapter 3. Strategic Analysis Review
3.1. Ready to Drink Organic Tea Pricing Analysis and Forecast
3.2. Porter’s Five Forces
3.3. Market Ecosystem
3.4. SWOT Analysis
3.5. Regulatory Scenario
3.3. Effects of Inflation, Russia-Ukraine War, moderating economic growth, and other macroeconomic factors
Chapter 4. Competitive Landscape
4.1. Market Share Analysis
4.1.1. Global Ready to Drink Organic Tea Market Share by Company, 2023
4.1.2. Product Offerings of Leading Ready to Drink Organic Tea Companies
4.2. Market Entropy
4.2.1. New Product Launches in the Industry
4.2.2. Mergers, Acquisitions, Joint ventures, and Partnerships
4.3. Key Strategies and Best Practices
Chapter 5. Global Market Projections: Best, Reference, and Low Case Scenarios
5.1. Growth Analysis- Case Scenario Definitions
5.2. Low Growth Case Scenario Forecasts
5.3. Reference Growth Case Scenario Forecasts
5.4. High Growth Case Scenario Forecasts
Chapter 6. Market Dynamics
6.1. Ready to Drink Organic Tea Market Drivers
6.2. Ready to Drink Organic Tea Market Challenges
6.6. Ready to Drink Organic Tea Market Opportunities
6.4. Ready to Drink Organic Tea Market Trends
Chapter 7. Global Ready to Drink Organic Tea Market Outlook Trends
7.1. Global Ready to Drink Organic Tea Revenue (USD Million) and CAGR (%) by Type (2021-2032)
7.2. Global Ready to Drink Organic Tea Revenue (USD Million) and CAGR (%) by Application (2021-2032)
7.3. Global Ready to Drink Organic Tea Revenue (USD Million) and CAGR (%) by Product (2021-2032)
By Type
Black
Green
Herbal
Others
By Distribution Channel
Supermarkets/Hypermarkets
Convenience stores
Online
Chapter 8. Global Ready to Drink Organic Tea Regional Analysis and Outlook
8.1. Global Ready to Drink Organic Tea Revenue (USD Million) By Regions (2021- 2032)
8.2. North America Ready to Drink Organic Tea Revenue (USD Million) by Country (2021-2032)
8.2.1. United States Ready to Drink Organic Tea Regional Analysis and Outlook
8.2.2. Canada Ready to Drink Organic Tea Regional Analysis and Outlook
8.2.3. Mexico Ready to Drink Organic Tea Regional Analysis and Outlook
8.3. Europe Ready to Drink Organic Tea Revenue (USD Million), by Country (2021-2032)
8.3.1. Germany Ready to Drink Organic Tea Regional Analysis and Outlook
8.3.2. France Ready to Drink Organic Tea Regional Analysis and Outlook
8.3.3. United Kingdom Ready to Drink Organic Tea Regional Analysis and Outlook
8.3.4. Spain Ready to Drink Organic Tea Regional Analysis and Outlook
8.3.5. Italy Ready to Drink Organic Tea Regional Analysis and Outlook
8.3.6. Russia Ready to Drink Organic Tea Regional Analysis and Outlook
8.3.7. Rest of Europe Ready to Drink Organic Tea Regional Analysis and Outlook
8.4. Asia Pacific Ready to Drink Organic Tea Revenue (USD Million) by Country (2021-2032)
8.4.1. China Ready to Drink Organic Tea Regional Analysis and Outlook
8.4.2. Japan Ready to Drink Organic Tea Regional Analysis and Outlook
8.4.3. India Ready to Drink Organic Tea Regional Analysis and Outlook
8.4.4. South Korea Ready to Drink Organic Tea Regional Analysis and Outlook
8.4.5. Australia Ready to Drink Organic Tea Regional Analysis and Outlook
8.4.6. South East Asia Ready to Drink Organic Tea Regional Analysis and Outlook
8.4.7. Rest of Asia Pacific Ready to Drink Organic Tea Regional Analysis and Outlook
8.5. South America Ready to Drink Organic Tea Revenue (USD Million), by Country (2021-2032)
8.5.1. Brazil Ready to Drink Organic Tea Regional Analysis and Outlook
8.5.2. Argentina Ready to Drink Organic Tea Regional Analysis and Outlook
8.5.3. Rest of South America Ready to Drink Organic Tea Regional Analysis and Outlook
8.6. Middle East and Africa Ready to Drink Organic Tea Revenue (USD Million) by Country (2021-2032)
8.6.1. Middle East Ready to Drink Organic Tea Regional Analysis and Outlook
8.6.2. Africa Ready to Drink Organic Tea Regional Analysis and Outlook
Chapter 9. North America Ready to Drink Organic Tea Analysis and Outlook
9.1. North America Ready to Drink Organic Tea Revenue (USD Million) by Segments (2021-2032)
9.1.1. North America Ready to Drink Organic Tea Revenue (USD Million) by Type (2021-2032)
9.1.2. North America Ready to Drink Organic Tea Revenue (USD Million) by Application (2021-2032)
9.1.3. North America Ready to Drink Organic Tea Revenue (USD Million) by Product (2021-2032)
By Type
Black
Green
Herbal
Others
By Distribution Channel
Supermarkets/Hypermarkets
Convenience stores
Online
Chapter 10. Europe Ready to Drink Organic Tea Analysis and Outlook
10.1. Europe Ready to Drink Organic Tea Revenue (USD Million), by Segments (USD Million) (2021-2032)
10.1.1. Europe Ready to Drink Organic Tea Revenue (USD Million) by Type (2021-2032)
10.1.2. Europe Ready to Drink Organic Tea Revenue (USD Million) by Application (2021-2032)
10.1.3. Europe Ready to Drink Organic Tea Revenue (USD Million) by Product (2021-2032)
By Type
Black
Green
Herbal
Others
By Distribution Channel
Supermarkets/Hypermarkets
Convenience stores
Online
Chapter 11. Asia Pacific Ready to Drink Organic Tea Analysis and Outlook
11.1. Asia Pacific Ready to Drink Organic Tea Revenue (USD Million), and Revenue (USD Million) by Segments (2021-2032)
11.1.1. Asia Pacific Ready to Drink Organic Tea Revenue (USD Million) by Type (2021-2032)
11.1.2. Asia Pacific Ready to Drink Organic Tea Revenue (USD Million) by Application (2021-2032)
11.1.3. Asia Pacific Ready to Drink Organic Tea Revenue (USD Million) by Product (2021-2032)
By Type
Black
Green
Herbal
Others
By Distribution Channel
Supermarkets/Hypermarkets
Convenience stores
Online
Chapter 12. South America Ready to Drink Organic Tea Analysis and Outlook
12.1. South America Ready to Drink Organic Tea Revenue (USD Million), by Segments (2021-2032)
12.1.1. South America Ready to Drink Organic Tea Revenue (USD Million) by Type (2021-2032)
12.1.2. South America Ready to Drink Organic Tea Revenue (USD Million) by Application (2021-2032)
12.1.3. South America Ready to Drink Organic Tea Revenue (USD Million) by Product (2021-2032)
By Type
Black
Green
Herbal
Others
By Distribution Channel
Supermarkets/Hypermarkets
Convenience stores
Online
Chapter 13. Middle East and Africa Ready to Drink Organic Tea Analysis and Outlook
13.1. Middle East and Africa Ready to Drink Organic Tea Revenue (USD Million), by Segments (2021-2032)
13.1.1. Middle East and Africa Ready to Drink Organic Tea Revenue (USD Million) by Type (2021-2032)
13.1.2. Middle East and Africa Ready to Drink Organic Tea Revenue (USD Million) by Application (2021-2032)
13.1.3. Middle East and Africa Ready to Drink Organic Tea Revenue (USD Million) by Product (2021-2032)
By Type
Black
Green
Herbal
Others
By Distribution Channel
Supermarkets/Hypermarkets
Convenience stores
Online
Chapter 14. Ready to Drink Organic Tea Company Profiles
14.1 Business Overview
14.2 Product Profiles
14.3 SWOT Profiles
14.5 Recent Developments
14.6 Financial Profile
List of Companies
Arizona Beverages
Guayakí Sustainable Rainforest Products Inc
Harney & Sons LLC
Numi Inc
Pepsi-Cola Bottling Company (PBC)
Tama Tea LLC
Teatulia Organic Teas LLC
Tejava Beverages
The Coca-Cola Company
The Hain Celestial Group Inc
Unilever PLC
Zevia LLC
15. Methodology and Data Sources
15.1 Customization Offerings
15.2 Subscription Services
15.3 Related Reports
15.4 Publisher Expertise
LIST OF TABLES
Table 1 Market Segmentation Analysis
Table 2 Global Ready to Drink Organic Tea Market Share of Leading Companies, 2023
Table 3 Product Offerings of Leading Companies
Table 4 Low Growth Scenario Forecasts
Table 5 Reference Case Growth Scenario
Table 6 High Growth Case Scenario
Table 7 Global Ready to Drink Organic Tea Revenue (USD Million) And CAGR (%) By Type (2021-2032)
Table 8 Global Ready to Drink Organic Tea Revenue (USD Million) And CAGR (%) By Application (2021-2032)
Table 9 Global Ready to Drink Organic Tea Revenue (USD Million) And CAGR (%) By Product (2021-2032)
Table 10 Global Ready to Drink Organic Tea Market Revenue (USD Million) By Regions (2021-2032)
Table 11 Global Ready to Drink Organic Tea Market Share (%) By Regions (2021-2032)
Table 12 North America Ready to Drink Organic Tea Revenue (USD Million) By Country (2021-2032)
Table 13 Europe Ready to Drink Organic Tea Revenue (USD Million) By Country (2021-2032)
Table 14 Asia Pacific Ready to Drink Organic Tea Revenue (USD Million) By Country (2021-2032)
Table 15 South America Ready to Drink Organic Tea Revenue (USD Million) By Country (2021-2032)
Table 16 Middle East and Africa Ready to Drink Organic Tea Revenue (USD Million) By Region (2021-2032)
Table 17 North America Ready to Drink Organic Tea Revenue (USD Million) By Type (2021-2032)
Table 18 North America Ready to Drink Organic Tea Revenue (USD Million) By Application (2021-2032)
Table 19 North America Ready to Drink Organic Tea Revenue (USD Million) By Product (2021-2032)
Table 20 Europe Ready to Drink Organic Tea Revenue (USD Million) By Type (2021-2032)
Table 21 Europe Ready to Drink Organic Tea Revenue (USD Million) By Application (2021-2032)
Table 22 Europe Ready to Drink Organic Tea Revenue (USD Million) By Product (2021-2032)
Table 23 Asia Pacific Ready to Drink Organic Tea Revenue (USD Million) By Type (2021-2032)
Table 24 Asia Pacific Ready to Drink Organic Tea Revenue (USD Million) By Application (2021-2032)
Table 25 Asia Pacific Ready to Drink Organic Tea Revenue (USD Million) By Product (2021-2032)
Table 26 South America Ready to Drink Organic Tea Revenue (USD Million) By Type (2021-2032)
Table 27 South America Ready to Drink Organic Tea Revenue (USD Million) By Application (2021-2032)
Table 28 South America Ready to Drink Organic Tea Revenue (USD Million) By Product (2021-2032)
Table 29 Middle East and Africa Ready to Drink Organic Tea Revenue (USD Million) By Type (2021-2032)
Table 30 Middle East and Africa Ready to Drink Organic Tea Revenue (USD Million) By Application (2021-2032)
Table 31 Middle East and Africa Ready to Drink Organic Tea Revenue (USD Million) By Product (2021-2032)
LIST OF FIGURES
Figure 1. Market Scope
Figure 2. Pricing Forecasts Per Unit, 2023- 2032
Figure 3. Porter’s Five Forces
Figure 4. Global Ready to Drink Organic Tea Market Revenue (USD Million) By Regions (2021-2032)
Figure 5. Global Ready to Drink Organic Tea Market Share (%) By Regions (2023)
Figure 6. North America Ready to Drink Organic Tea Revenue (USD Million) By Country (2021-2032)
Figure 7. United States Ready to Drink Organic Tea Revenue (USD Million) By Country (2021-2032)
Figure 8. Canada Ready to Drink Organic Tea Revenue (USD Million) By Country (2021-2032)
Figure 9. Mexico Ready to Drink Organic Tea Revenue (USD Million) By Country (2021-2032)
Figure 10. Europe Ready to Drink Organic Tea Revenue (USD Million) By Country (2021-2032)
Figure 11. Germany Ready to Drink Organic Tea Revenue (USD Million) By Country (2021-2032)
Figure 12. France Ready to Drink Organic Tea Revenue (USD Million) By Country (2021-2032)
Figure 13. United Kingdom Ready to Drink Organic Tea Revenue (USD Million) By Country (2021-2032)
Figure 14. Spain Ready to Drink Organic Tea Revenue (USD Million) By Country (2021-2032)
Figure 15. Italy Ready to Drink Organic Tea Revenue (USD Million) By Country (2021-2032)
Figure 16. Russia Ready to Drink Organic Tea Revenue (USD Million) By Country (2021-2032)
Figure 17. Rest of Europe Ready to Drink Organic Tea Revenue (USD Million) By Country (2021-2032)
Figure 11. Asia Pacific Ready to Drink Organic Tea Revenue (USD Million) By Country (2021-2032)
Figure 12. China Ready to Drink Organic Tea Revenue (USD Million) By Country (2021-2032)
Figure 13. Japan Ready to Drink Organic Tea Revenue (USD Million) By Country (2021-2032)
Figure 14. India Ready to Drink Organic Tea Revenue (USD Million) By Country (2021-2032)
Figure 15. South Korea Ready to Drink Organic Tea Revenue (USD Million) By Country (2021-2032)
Figure 16. Australia Ready to Drink Organic Tea Revenue (USD Million) By Country (2021-2032)
Figure 17. South East Asia Ready to Drink Organic Tea Revenue (USD Million) By Country (2021-2032)
Figure 18. South America Ready to Drink Organic Tea Revenue (USD Million) By Country (2021-2032)
Figure 19. Brazil Ready to Drink Organic Tea Revenue (USD Million) By Country (2021-2032)
Figure 20. Argentina Ready to Drink Organic Tea Revenue (USD Million) By Country (2021-2032)
Figure 21. Rest of Asia Pacific Ready to Drink Organic Tea Revenue (USD Million) By Country (2021-2032)
Figure 22. Middle East and Africa Ready to Drink Organic Tea Revenue (USD Million) By Region (2021-2032)
Figure 23. Saudi Arabia Ready to Drink Organic Tea Revenue (USD Million) By Region (2021-2032)
Figure 24. The UAE Ready to Drink Organic Tea Revenue (USD Million) By Region (2021-2032)
Figure 25. Rest of Middle East Ready to Drink Organic Tea Revenue (USD Million) By Region (2021-2032)
Figure 26. South Africa Ready to Drink Organic Tea Revenue (USD Million) By Region (2021-2032)
Figure 27. Africa Ready to Drink Organic Tea Revenue (USD Million) By Region (2021-2032)
Figure 28. North America Ready to Drink Organic Tea Revenue (USD Million) By Type (2021-2032)
Figure 29. North America Ready to Drink Organic Tea Revenue (USD Million) By Application (2021-2032)
Figure 30. North America Ready to Drink Organic Tea Revenue (USD Million) By Product (2021-2032)
Figure 31. Europe Ready to Drink Organic Tea Revenue (USD Million) By Type (2021-2032)
Figure 32. Europe Ready to Drink Organic Tea Revenue (USD Million) By Application (2021-2032)
Figure 33. Europe Ready to Drink Organic Tea Revenue (USD Million) By Product (2021-2032)
Figure 34. Asia Pacific Ready to Drink Organic Tea Revenue (USD Million) By Type (2021-2032)
Figure 35. Asia Pacific Ready to Drink Organic Tea Revenue (USD Million) By Application (2021-2032)
Figure 36. Asia Pacific Ready to Drink Organic Tea Revenue (USD Million) By Product (2021-2032)
Figure 37. South America Ready to Drink Organic Tea Revenue (USD Million) By Type (2021-2032)
Figure 38. South America Ready to Drink Organic Tea Revenue (USD Million) By Application (2021-2032)
Figure 39. South America Ready to Drink Organic Tea Revenue (USD Million) By Product (2021-2032)
Figure 40. Middle East and Africa Ready to Drink Organic Tea Revenue (USD Million) By Type (2021-2032)
Figure 41. Middle East and Africa Ready to Drink Organic Tea Revenue (USD Million) By Application (2021-2032)
Figure 42. Middle East and Africa Ready to Drink Organic Tea Revenue (USD Million) By Product (2021-2032)
By Type
Black
Green
Herbal
Others
By Distribution Channel
Supermarkets/Hypermarkets
Convenience stores
Online
Countries Analyzed
North America (US, Canada, Mexico)
Europe (Germany, UK, France, Spain, Italy, Russia, Rest of Europe)
Asia Pacific (China, India, Japan, South Korea, Australia, South East Asia, Rest of Asia)
South America (Brazil, Argentina, Rest of South America)
Middle East and Africa (Saudi Arabia, UAE, Rest of Middle East, South Africa, Egypt, Rest of Africa)
