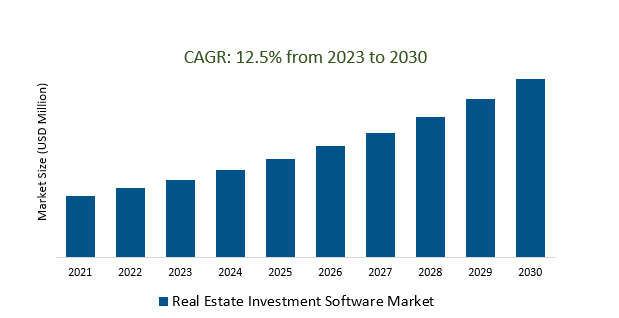
The Global Real Estate Investment Software Market Size is estimated to register 12.5% growth over the forecast period from 2023 to 2030
Real Estate Investment Software Market Overview
Increasing demand for mobile-friendly real estate investment software, allowing investors and professionals to access critical data and analytics on their smartphones or tablets is fueling the demand. Investors and professionals in the industry are seeking comprehensive platforms that offer robust analytics, allowing them to assess property performance, conduct feasibility studies, and make informed investment decisions. Further, increase in efficient tools to manage portfolios, analyze market trends, conduct due diligence, and streamline property management is supporting the revenue. Investors are seeking solutions that improve productivity, reduce manual errors, and optimize resource allocation. Cloud-based real estate investment software is gaining popularity due to its flexibility, scalability, and accessibility.
Real Estate Investment Software Market Dynamics
Market Trend – Surge in adoption of cloud-based solutions in the Real Estate Investment Software Market.
Accessibility from anywhere with an internet connection, enabling real estate investors, asset managers, and property professionals to access crucial data and tools remotely are the key factors.
The flexibility to scale resources based on business needs, allowing real estate firms to adjust storage, computing power, and functionalities as their portfolios expand or contract is fueling the demand.
Further, With the growing concern for data privacy and cybersecurity, real estate firms are increasingly selecting cloud-based solutions that offer heightened security measures to protect their information assets.
Market Driver- Growing emphasis of Digital Transformation in Real Estate Investment Software Market.
The need to automate repetitive tasks, optimize processes, and reduce manual efforts drives the adoption of digital tools which offer automation, analytics, and reporting functionalities, enabling professionals to focus on strategic decision-making.
The demand for sophisticated analytics tools to interpret complex real estate data fuels the adoption of digital solutions that provide actionable insights.Further, the emergence of technologies such as virtual property tours, smart building management systems, blockchain for property transactions, and IoT-based facilities management are fueling the demand.
Market Opportunity- ESG considerations are driving the innovation of the Real Estate Investment Software Market.
The rising recognition among investors and stakeholders of the significant impact real estate holdings are having on the environment, society, and corporate governance is driving the demand.Investors are integrating features that enable analysis of properties concerning their social impact on local communities including assessing amenities for occupants, community engagement initiatives, and the property's contribution to the welfare of surrounding areas.Assessing transparency in reporting, compliance with regulations, and risk management protocols are driving the demand growth.
Market Share Analysis- cloud-based deployment Market will register the fastest growth.
The Global Real Estate Investment Software Market is analyzed across On Premise &Cloud based. Cloud-based deployment is poised to register the fastest growth. Cloud-based deployment provides real estate professionals and investors with increased flexibility, allowing them to access software tools and critical data from anywhere with internet connectivity. This accessibility is particularly beneficial for remote work scenarios, enabling collaboration across teams and providing real-time access to property information, investment analysis, and portfolio management tools. Additionally, cloud-based solutions offer scalability that accommodates the growth of real estate portfolios, enables efficient resource utilization, and helps control costs, making cloud deployment an attractive choice for businesses of varying sizes.
Market Share Analysis- SMEs held a significant market share in 2023.
The Global Product Engineering Service Market is analyzed across various Organizations including SMEs, Large Enterprises, and others. Of these, SMEs held a significant market share in 2023. The growth rate among SMEs in the Real Estate Investment Software Market might potentially be higher due to the increasing adoption of technology, especially cloud-based solutions tailored to their specific needs. often seek affordable, scalable, and user-friendly software solutions for property management, financial analysis, and reporting. The flexibility and cost-effectiveness of cloud-based software could lead to a faster growth rate among SMEs compared to larger enterprises. With the availability of user-friendly software solutions, SMEs are embracing technology to streamline operations, enhance decision-making, and gain a competitive edge in the real estate market.
Real Estate Investment Software Market Segmentation
By Deployment Mode
By Enterprise Size
By End User
- Institutional Investor
- Real Estate Developers
By Region
- North America (United States, Canada, Mexico)
- Europe (Germany, France, United Kingdom, Spain, Italy, Others)
- Asia Pacific (China, India, Japan, South Korea, Australia, Others)
- Latin America (Brazil, Argentina, Others)
- Middle East and Africa (Saudi Arabia, UAE, Kuwait, Other Middle East, South Africa, Nigeria, Other Africa)
Real Estate Investment Software Market Companies
- Nomad RSI (Spain)
- Argus Software (United Kingdom)
- PlanRadar (Austria)
- Reasult (Netherlands)
- Property Button (Ireland)
- Aareon (Germany)
- Grosvenor Systems (United Kingdom)
- Relex Solutions (Finland)
- Leverton (Germany)
- RealPage (Singapore)
- Yardi Systems (Hong Kong)
- Re-Leased (New Zealand)
- Anaplan (Singapore)
*List not exhaustive
Real Estate Investment Software Market Outlook 2023
1 Market Overview
1.1 Introduction to the Real Estate Investment Software Market
1.2 Scope of the Study
1.3 Research Objective
1.3.1 Key Market Scope and Segments
1.3.2 Players Covered
1.3.3 Years Considered
2 Executive Summary
2.1 2023 Real Estate Investment Software Industry- Market Statistics
3 Market Dynamics
3.1 Market Drivers
3.2 Market Challenges
3.3 Market Opportunities
3.4 Market Trends
4 Market Factor Analysis
4.1 Porter’s Five Forces
4.2 Market Entropy
4.2.1 Global Real Estate Investment Software Market Companies with Area Served
4.2.2 Products Offerings Global Real Estate Investment Software Market
5 COVID-19 Impact Analysis and Outlook Scenarios
5.1.1 Covid-19 Impact Analysis
5.1.2 post-COVID-19 Scenario- Low Growth Case
5.1.3 post-COVID-19 Scenario- Reference Growth Case
5.1.4 post-COVID-19 Scenario- Low Growth Case
6 Global Real Estate Investment Software Market Trends
6.1 Global Real Estate Investment Software Revenue (USD Million) and CAGR (%) by Type (2018-2030)
6.2 Global Real Estate Investment Software Revenue (USD Million) and CAGR (%) by Applications (2018-2030)
6.3 Global Real Estate Investment Software Revenue (USD Million) and CAGR (%) by regions (2018-2030)
7 Global Real Estate Investment Software Market Revenue (USD Million) by Type, and Applications (2018-2022)
7.1 Global Real Estate Investment Software Revenue (USD Million) by Type (2018-2022)
7.1.1 Global Real Estate Investment Software Revenue (USD Million), Market Share (%) by Type (2018-2022)
7.2 Global Real Estate Investment Software Revenue (USD Million) by Applications (2018-2022)
7.2.1 Global Real Estate Investment Software Revenue (USD Million), Market Share (%) by Applications (2018-2022)
8 Global Real Estate Investment Software Development Regional Status and Outlook
8.1 Global Real Estate Investment Software Revenue (USD Million) By Regions (2018-2022)
8.2 North America Real Estate Investment Software Revenue (USD Million) by Type, and Application (2018-2022)
8.2.1 North America Real Estate Investment Software Revenue (USD Million) by Country (2018-2022)
8.2.2 North America Real Estate Investment Software Revenue (USD Million) by Type (2018-2022)
8.2.3 North America Real Estate Investment Software Revenue (USD Million) by Applications (2018-2022)
8.3 Europe Real Estate Investment Software Revenue (USD Million), by Type, and Applications (USD Million) (2018-2022)
8.3.1 Europe Real Estate Investment Software Revenue (USD Million), by Country (2018-2022)
8.3.2 Europe Real Estate Investment Software Revenue (USD Million) by Type (2018-2022)
8.3.3 Europe Real Estate Investment Software Revenue (USD Million) by Applications (2018-2022)
8.4 Asia Pacific Real Estate Investment Software Revenue (USD Million), and Revenue (USD Million) by Type, and Applications (2018-2022)
8.4.1 Asia Pacific Real Estate Investment Software Revenue (USD Million) by Country (2018-2022)
8.4.2 Asia Pacific Real Estate Investment Software Revenue (USD Million) by Type (2018-2022)
8.4.3 Asia Pacific Real Estate Investment Software Revenue (USD Million) by Applications (2018-2022)
8.5 South America Real Estate Investment Software Revenue (USD Million), by Type, and Applications (2018-2022)
8.5.1 South America Real Estate Investment Software Revenue (USD Million), by Country (2018-2022)
8.5.2 South America Real Estate Investment Software Revenue (USD Million) by Type (2018-2022)
8.5.3 South America Real Estate Investment Software Revenue (USD Million) by Applications (2018-2022)
8.6 Middle East and Africa Real Estate Investment Software Revenue (USD Million), by Type, Technology, Application, Thickness (2018-2022)
8.6.1 Middle East and Africa Real Estate Investment Software Revenue (USD Million) by Country (2018-2022)
8.6.2 Middle East and Africa Real Estate Investment Software Revenue (USD Million) by Type (2018-2022)
8.6.3 Middle East and Africa Real Estate Investment Software Revenue (USD Million) by Applications (2018-2022)
9 Company Profiles
10 Global Real Estate Investment Software Market Revenue (USD Million), by Type, and Applications (2023-2030)
10.1 Global Real Estate Investment Software Revenue (USD Million) and Market Share (%) by Type (2023-2030)
10.1.1 Global Real Estate Investment Software Revenue (USD Million), and Market Share (%) by Type (2023-2030)
10.2 Global Real Estate Investment Software Revenue (USD Million) and Market Share (%) by Applications (2023-2030)
10.2.1 Global Real Estate Investment Software Revenue (USD Million), and Market Share (%) by Applications (2023-2030)
11 Global Real Estate Investment Software Development Regional Status and Outlook Forecast
11.1 Global Real Estate Investment Software Revenue (USD Million) By Regions (2023-2030)
11.2 North America Real Estate Investment Software Revenue (USD Million) by Type, and Applications (2023-2030)
11.2.1 North America Real Estate Investment Software Revenue (USD) Million by Country (2023-2030)
11.2.2 North America Real Estate Investment Software Revenue (USD Million), by Type (2023-2030)
11.2.3 North America Real Estate Investment Software Revenue (USD Million), Market Share (%) by Applications (2023-2030)
11.3 Europe Real Estate Investment Software Revenue (USD Million), by Type, and Applications (2023-2030)
11.3.1 Europe Real Estate Investment Software Revenue (USD Million), by Country (2023-2030)
11.3.2 Europe Real Estate Investment Software Revenue (USD Million), by Type (2023-2030)
11.3.3 Europe Real Estate Investment Software Revenue (USD Million), by Applications (2023-2030)
11.4 Asia Pacific Real Estate Investment Software Revenue (USD Million) by Type, and Applications (2023-2030)
11.4.1 Asia Pacific Real Estate Investment Software Revenue (USD Million), by Country (2023-2030)
11.4.2 Asia Pacific Real Estate Investment Software Revenue (USD Million), by Type (2023-2030)
11.4.3 Asia Pacific Real Estate Investment Software Revenue (USD Million), by Applications (2023-2030)
11.5 South America Real Estate Investment Software Revenue (USD Million), by Type, and Applications (2023-2030)
11.5.1 South America Real Estate Investment Software Revenue (USD Million), by Country (2023-2030)
11.5.2 South America Real Estate Investment Software Revenue (USD Million), by Type (2023-2030)
11.5.3 South America Real Estate Investment Software Revenue (USD Million), by Applications (2023-2030)
11.6 Middle East and Africa Real Estate Investment Software Revenue (USD Million), by Type, and Applications (2023-2030)
11.6.1 Middle East and Africa Real Estate Investment Software Revenue (USD Million), by region (2023-2030)
11.6.2 Middle East and Africa Real Estate Investment Software Revenue (USD Million), by Type (2023-2030)
11.6.3 Middle East and Africa Real Estate Investment Software Revenue (USD Million), by Applications (2023-2030)
12 Methodology and Data Sources
12.1 Methodology/Research Approach
12.1.1 Research Programs/Design
12.1.2 Market Size Estimation
12.1.3 Market Breakdown and Data Triangulation
12.2 Data Sources
12.2.1 Secondary Sources
12.2.2 Primary Sources
12.3 Disclaimer
List of Tables
Table 1 Market Segmentation Analysis
Table 2 Global Real Estate Investment Software Market Companies with Areas Served
Table 3 Products Offerings Global Real Estate Investment Software Market
Table 4 Low Growth Scenario Forecasts
Table 5 Reference Case Growth Scenario
Table 6 High Growth Case Scenario
Table 7 Global Real Estate Investment Software Revenue (USD Million) And CAGR (%) By Type (2018-2030)
Table 8 Global Real Estate Investment Software Revenue (USD Million) And CAGR (%) By Applications (2018-2030)
Table 9 Global Real Estate Investment Software Revenue (USD Million) And CAGR (%) By Regions (2018-2030)
Table 10 Global Real Estate Investment Software Revenue (USD Million) By Type (2018-2022)
Table 11 Global Real Estate Investment Software Revenue Market Share (%) By Type (2018-2022)
Table 12 Global Real Estate Investment Software Revenue (USD Million) By Applications (2018-2022)
Table 13 Global Real Estate Investment Software Revenue Market Share (%) By Applications (2018-2022)
Table 14 Global Real Estate Investment Software Market Revenue (USD Million) By Regions (2018-2022)
Table 15 Global Real Estate Investment Software Market Share (%) By Regions (2018-2022)
Table 16 North America Real Estate Investment Software Revenue (USD Million) By Country (2018-2022)
Table 17 North America Real Estate Investment Software Revenue (USD Million) By Type (2018-2022)
Table 18 North America Real Estate Investment Software Revenue (USD Million) By Applications (2018-2022)
Table 19 Europe Real Estate Investment Software Revenue (USD Million) By Country (2018-2022)
Table 20 Europe Real Estate Investment Software Revenue (USD Million) By Type (2018-2022)
Table 21 Europe Real Estate Investment Software Revenue (USD Million) By Applications (2018-2022)
Table 22 Asia Pacific Real Estate Investment Software Revenue (USD Million) By Country (2018-2022)
Table 23 Asia Pacific Real Estate Investment Software Revenue (USD Million) By Type (2018-2022)
Table 24 Asia Pacific Real Estate Investment Software Revenue (USD Million) By Applications (2018-2022)
Table 25 South America Real Estate Investment Software Revenue (USD Million) By Country (2018-2022)
Table 26 South America Real Estate Investment Software Revenue (USD Million) By Type (2018-2022)
Table 27 South America Real Estate Investment Software Revenue (USD Million) By Applications (2018-2022)
Table 28 Middle East and Africa Real Estate Investment Software Revenue (USD Million) By Region (2018-2022)
Table 29 Middle East and Africa Real Estate Investment Software Revenue (USD Million) By Type (2018-2022)
Table 30 Middle East and Africa Real Estate Investment Software Revenue (USD Million) By Applications (2018-2022)
Table 31 Financial Analysis
Table 32 Global Real Estate Investment Software Revenue (USD Million) By Type (2023-2030)
Table 33 Global Real Estate Investment Software Revenue Market Share (%) By Type (2023-2030)
Table 34 Global Real Estate Investment Software Revenue (USD Million) By Applications (2023-2030)
Table 35 Global Real Estate Investment Software Revenue Market Share (%) By Applications (2023-2030)
Table 36 Global Real Estate Investment Software Market Revenue (USD Million), And Revenue (USD Million) By Regions (2023-2030)
Table 37 North America Real Estate Investment Software Revenue (USD)By Country (2023-2030)
Table 38 North America Real Estate Investment Software Revenue (USD Million) By Type (2023-2030)
Table 39 North America Real Estate Investment Software Revenue (USD Million) By Applications (2023-2030)
Table 40 Europe Real Estate Investment Software Revenue (USD Million) By Country (2023-2030)
Table 41 Europe Real Estate Investment Software Revenue (USD Million) By Type (2023-2030)
Table 42 Europe Real Estate Investment Software Revenue (USD Million) By Applications (2023-2030)
Table 43 Asia Pacific Real Estate Investment Software Revenue (USD Million) By Country (2023-2030)
Table 44 Asia Pacific Real Estate Investment Software Revenue (USD Million) By Type (2023-2030)
Table 45 Asia Pacific Real Estate Investment Software Revenue (USD Million) By Applications (2023-2030)
Table 46 South America Real Estate Investment Software Revenue (USD Million) By Country (2023-2030)
Table 47 South America Real Estate Investment Software Revenue (USD Million) By Type (2023-2030)
Table 48 South America Real Estate Investment Software Revenue (USD Million) By Applications (2023-2030)
Table 49 Middle East and Africa Real Estate Investment Software Revenue (USD Million) By Region (2023-2030)
Table 50 Middle East and Africa Real Estate Investment Software Revenue (USD Million) By Region (2023-2030)
Table 51 Middle East and Africa Real Estate Investment Software Revenue (USD Million) By Type (2023-2030)
Table 52 Middle East and Africa Real Estate Investment Software Revenue (USD Million) By Applications (2023-2030)
Table 53 Research Programs/Design for This Report
Table 54 Key Data Information from Secondary Sources
Table 55 Key Data Information from Primary Sources
List of Figures
Figure 1 Market Scope
Figure 2 Porter’s Five Forces
Figure 3 Global Real Estate Investment Software Revenue (USD Million) By Type (2018-2022)
Figure 4 Global Real Estate Investment Software Revenue Market Share (%) By Type (2022)
Figure 5 Global Real Estate Investment Software Revenue (USD Million) By Applications (2018-2022)
Figure 6 Global Real Estate Investment Software Revenue Market Share (%) By Applications (2022)
Figure 7 Global Real Estate Investment Software Market Revenue (USD Million) By Regions (2018-2022)
Figure 8 Global Real Estate Investment Software Market Share (%) By Regions (2022)
Figure 9 North America Real Estate Investment Software Revenue (USD Million) By Country (2018-2022)
Figure 10 North America Real Estate Investment Software Revenue (USD Million) By Type (2018-2022)
Figure 11 North America Real Estate Investment Software Revenue (USD Million) By Applications (2018-2022)
Figure 12 Europe Real Estate Investment Software Revenue (USD Million) By Country (2018-2022)
Figure 13 Europe Real Estate Investment Software Revenue (USD Million) By Type (2018-2022)
Figure 14 Europe Real Estate Investment Software Revenue (USD Million) By Applications (2018-2022)
Figure 15 Asia Pacific Real Estate Investment Software Revenue (USD Million) By Country (2018-2022)
Figure 16 Asia Pacific Real Estate Investment Software Revenue (USD Million) By Type (2018-2022)
Figure 17 Asia Pacific Real Estate Investment Software Revenue (USD Million) By Applications (2018-2022)
Figure 18 South America Real Estate Investment Software Revenue (USD Million) By Country (2018-2022)
Figure 19 South America Real Estate Investment Software Revenue (USD Million) By Type (2018-2022)
Figure 20 South America Real Estate Investment Software Revenue (USD Million) By Applications (2018-2022)
Figure 21 Middle East and Africa Real Estate Investment Software Revenue (USD Million) By Region (2018-2022)
Figure 22 Middle East and Africa Real Estate Investment Software Revenue (USD Million) By Type (2018-2022)
Figure 23 Middle East and Africa Real Estate Investment Software Revenue (USD Million) By Applications (2018-2022)
Figure 24 Global Real Estate Investment Software Revenue (USD Million) By Type (2023-2030)
Figure 25 Global Real Estate Investment Software Revenue Market Share (%) By Type (2030)
Figure 26 Global Real Estate Investment Software Revenue (USD Million) By Applications (2023-2030)
Figure 27 Global Real Estate Investment Software Revenue Market Share (%) By Applications (2030)
Figure 28 Global Real Estate Investment Software Market Revenue (USD Million) By Regions (2023-2030)
Figure 29 North America Real Estate Investment Software Revenue (USD Million) By Country (2023-2030)
Figure 30 North America Real Estate Investment Software Revenue (USD Million) By Type (2023-2030)
Figure 31 North America Real Estate Investment Software Revenue (USD Million) By Applications (2023-2030)
Figure 32 Europe Real Estate Investment Software Revenue (USD Million) By Country (2023-2030)
Figure 33 Europe Real Estate Investment Software Revenue (USD Million) By Type (2023-2030)
Figure 34 Europe Real Estate Investment Software Revenue (USD Million) By Applications (2023-2030)
Figure 35 Asia Pacific Real Estate Investment Software Revenue (USD Million) By Country (2023-2030)
Figure 36 Asia Pacific Real Estate Investment Software Revenue (USD Million) By Type (2023-2030)
Figure 37 Asia Pacific Real Estate Investment Software Revenue (USD Million) By Applications (2023-2030)
Figure 38 South America Real Estate Investment Software Revenue (USD Million) By Country (2023-2030)
Figure 39 South America Real Estate Investment Software Revenue (USD Million) By Type (2023-2030)
Figure 40 South America Real Estate Investment Software Revenue (USD Million) By Applications (2023-2030)
Figure 41 Middle East and Africa Real Estate Investment Software Revenue (USD Million) By Region (2023-2030)
Figure 42 Middle East and Africa Real Estate Investment Software Revenue (USD Million) By Region (2023-2030)
Figure 43 Middle East and Africa Real Estate Investment Software Revenue (USD Million) By Type (2023-2030)
Figure 44 Middle East and Africa Real Estate Investment Software Revenue (USD Million) By Applications (2023-2030)
Figure 45 Bottom-Up and Top-Down Approaches for This Report
Figure 46 Data Triangulation
