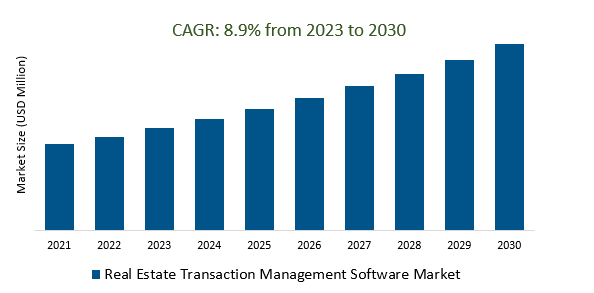
The Global Real Estate Transaction Management Software Market Size is estimated to register 8.9% growth over the forecast period from 2023 to 2030.
The expansion of the market is propelled by a growing focus on enforcing regulatory compliance and implementing strong security features in real estate transaction management software. The real estate sector's stringent regulations make it imperative for software solutions to incorporate compliance features. Furthermore, the safeguarding of sensitive financial and personal data demands robust security measures to mitigate cyber threats, thereby fostering the adoption of transaction management systems that are both secure and compliant. Leading Companies focusing on Global Market Expansion, Artificial Intelligence and Predictive Analytics Advancements, Blockchain for Enhanced Transparency, and others to boost market shares in the industry.
Market Overview
The Real Estate Transaction Management Software Market is experiencing a notable shift towards digital transformation, with a focus on user-friendly interfaces, cloud-based solutions, and the integration of technologies such as AI and blockchain. Cloud-based platforms offer centralized data storage and mobility, while AI enhances analytics and automation. Blockchain ensures secure and transparent transactions. User experience optimization, regulatory compliance features, and adaptability to global transactions are key trends. Challenges include data security concerns and the need for industry-wide standardization. The market continues to evolve to meet the demands of a digital and global real estate industry, emphasizing innovation and efficiency.
Market Dynamics
Market Trends- Digitization and automation breathe new life into real estate transactions.
Digitization and automation are injecting vitality into real estate transactions, transforming traditional processes. This shift streamlines workflows, reduces paperwork, accelerates transaction cycles, and enhances overall efficiency. The integration of digital platforms and automated solutions is becoming essential, providing a seamless and responsive experience for real estate professionals and clients alike. This fundamental change is not just a trend but a pivotal evolution that breathes new life into the way real estate transactions are conducted, marking a move towards a more agile and interconnected future.
Market Driver- Real estate transactions swap paper piles for predictive insights as AI and analytics seamlessly integrate into software platforms, transforming the way deals are made.
In the evolving realm of real estate transaction management software, a significant shift is underway as transactions move beyond traditional paper-based processes. The integration of artificial intelligence (AI) and analytics propels this transformative shift, replacing cumbersome paperwork with predictive insights. These advanced technologies seamlessly embed themselves into software platforms, fundamentally altering the entire deal-making process. AI enables predictive analytics for property valuation, risk assessment, and market trend analysis, providing real estate professionals with indispensable tools for strategic decision-making. The fusion of AI and analytics not only streamlines transactions but also heralds a new era marked by enhanced efficiency, precision, and data-driven insights, shaping the future of real estate deals.
Market Opportunity- Cloud fuels real estate deals' stratospheric rise.
Cloud technology is propelling a remarkable surge in the efficiency and scale of real estate deals within the transaction management software market. The adoption of cloud-based solutions has revolutionized transactions, offering centralized data storage, real-time collaboration, and accessibility from diverse devices and locations. This transformative shift enables real estate professionals to conduct seamless transactions in a virtual environment, enhancing agility, scalability, and overall speed. As transactions reach stratospheric levels, the cloud emerges as a fundamental enabler, reshaping the dynamics of the Real Estate Transaction Management Software Market.
Market Share Analysis- Cloud-based Real Estate Transaction Management Software Market will register the fastest growth
The Global Real Estate Transaction Management Software Market is analyzed across On-premises, Cloud-based, and others. Cloud-based is poised to register the fastest growth. The cloud-based real estate transaction management software market is witnessing significant growth, driven by the increasing digitization of the real estate industry. Key features include document management, transaction tracking, communication tools, compliance, and task management. Market trends highlight integration with other real estate tools, mobile accessibility, and the incorporation of artificial intelligence and automation. Notable players in this space include Dotloop, SkySlope, DocuSign, and Transaction Desk. Challenges involve data security concerns and resistance to adoption, while the future outlook suggests continued growth with a focus on advanced technologies, seamless integration, and user-friendly interfaces.
Market Share Analysis- SMEs held a significant market share in 2023
The Global Real Estate Transaction Management Software Market is analyzed across various applications including SMEs, Large Enterprises, and others. Of these, SMEs held a significant market share in 2023. Real estate transaction management software is gaining traction among Small and Medium Enterprises (SMEs) in the real estate sector, offering cost-effective, scalable, and user-friendly solutions. These platforms cater to specific SME needs, providing enhanced document management, transaction tracking, and compliance features. The adoption of such software reflects the broader trend of digital transformation in the real estate industry, enabling SMEs to compete more effectively. With flexible pricing plans and a focus on efficiency, real estate transaction management software is playing a crucial role in streamlining operations for smaller businesses in the evolving real estate landscape.
Real Estate Transaction Management Software Market Segmentation
By Type
By Application
By Sales Channel
- Direct Channel
- Distribution Channel
By Region
- North America (United States, Canada, Mexico)
- Europe (Germany, France, United Kingdom, Spain, Italy, Others)
- Asia Pacific (China, India, Japan, South Korea, Australia, Others)
- Latin America (Brazil, Argentina, Others)
- Middle East and Africa (Saudi Arabia, UAE, Kuwait, Other Middle East, South Africa, Nigeria, Other Africa)
Real Estate Transaction Management Software Market Companies
- Brokermint
- Lone Wolf Technologies
- Dotloop
- Juniper Square
- Investor Management Services
- SkySlope
- RealtyBackOffice
- WebAPX
- Property Base
- Aversure
- Lead2Deed
- Paperless Pipeline
- ELK Software
- Reesio
- BrokerSumo
- Form Simplicity
- Netty.fr
- Respacio
- SolWeb
- Nekst
*List not exhaustive
Real Estate Transaction Management Software Market Outlook 2023
1 Market Overview
1.1 Introduction to the Real Estate Transaction Management Software Market
1.2 Scope of the Study
1.3 Research Objective
1.3.1 Key Market Scope and Segments
1.3.2 Players Covered
1.3.3 Years Considered
2 Executive Summary
2.1 2023 Real Estate Transaction Management Software Industry- Market Statistics
3 Market Dynamics
3.1 Market Drivers
3.2 Market Challenges
3.3 Market Opportunities
3.4 Market Trends
4 Market Factor Analysis
4.1 Porter’s Five Forces
4.2 Market Entropy
4.2.1 Global Real Estate Transaction Management Software Market Companies with Area Served
4.2.2 Products Offerings Global Real Estate Transaction Management Software Market
5 COVID-19 Impact Analysis and Outlook Scenarios
5.1.1 Covid-19 Impact Analysis
5.1.2 Post-COVID-19 Scenario- Low Growth Case
5.1.3 Post-COVID-19 Scenario- Reference Growth Case
5.1.4 Post-COVID-19 Scenario- Low Growth Case
6 Global Real Estate Transaction Management Software Market Trends
6.1 Global Real Estate Transaction Management Software Revenue (USD Million) and CAGR (%) by Type (2018-2030)
6.2 Global Real Estate Transaction Management Software Revenue (USD Million) and CAGR (%) by Applications (2018-2030)
6.3 Global Real Estate Transaction Management Software Revenue (USD Million) and CAGR (%) by Regions (2018-2030)
7 Global Real Estate Transaction Management Software Market Revenue (USD Million) by Type, and Applications (2018-2022)
7.1 Global Real Estate Transaction Management Software Revenue (USD Million) by Type (2018-2022)
7.1.1 Global Real Estate Transaction Management Software Revenue (USD Million), Market Share (%) by Type (2018-2022)
7.2 Global Real Estate Transaction Management Software Revenue (USD Million) by Applications (2018-2022)
7.2.1 Global Real Estate Transaction Management Software Revenue (USD Million), Market Share (%) by Applications (2018-2022)
8 Global Real Estate Transaction Management Software Development Regional Status and Outlook
8.1 Global Real Estate Transaction Management Software Revenue (USD Million) By Regions (2018-2022)
8.2 North America Real Estate Transaction Management Software Revenue (USD Million) by Type, and Application (2018-2022)
8.2.1 North America Real Estate Transaction Management Software Revenue (USD Million) by Country (2018-2022)
8.2.2 North America Real Estate Transaction Management Software Revenue (USD Million) by Type (2018-2022)
8.2.3 North America Real Estate Transaction Management Software Revenue (USD Million) by Applications (2018-2022)
8.3 Europe Real Estate Transaction Management Software Revenue (USD Million), by Type, and Applications (USD Million) (2018-2022)
8.3.1 Europe Real Estate Transaction Management Software Revenue (USD Million), by Country (2018-2022)
8.3.2 Europe Real Estate Transaction Management Software Revenue (USD Million) by Type (2018-2022)
8.3.3 Europe Real Estate Transaction Management Software Revenue (USD Million) by Applications (2018-2022)
8.4 Asia Pacific Real Estate Transaction Management Software Revenue (USD Million), and Revenue (USD Million) by Type, and Applications (2018-2022)
8.4.1 Asia Pacific Real Estate Transaction Management Software Revenue (USD Million) by Country (2018-2022)
8.4.2 Asia Pacific Real Estate Transaction Management Software Revenue (USD Million) by Type (2018-2022)
8.4.3 Asia Pacific Real Estate Transaction Management Software Revenue (USD Million) by Applications (2018-2022)
8.5 South America Real Estate Transaction Management Software Revenue (USD Million), by Type, and Applications (2018-2022)
8.5.1 South America Real Estate Transaction Management Software Revenue (USD Million), by Country (2018-2022)
8.5.2 South America Real Estate Transaction Management Software Revenue (USD Million) by Type (2018-2022)
8.5.3 South America Real Estate Transaction Management Software Revenue (USD Million) by Applications (2018-2022)
8.6 Middle East and Africa Real Estate Transaction Management Software Revenue (USD Million), by Type, Technology, Application, Thickness (2018-2022)
8.6.1 Middle East and Africa Real Estate Transaction Management Software Revenue (USD Million) by Country (2018-2022)
8.6.2 Middle East and Africa Real Estate Transaction Management Software Revenue (USD Million) by Type (2018-2022)
8.6.3 Middle East and Africa Real Estate Transaction Management Software Revenue (USD Million) by Applications (2018-2022)
9 Company Profiles
10 Global Real Estate Transaction Management Software Market Revenue (USD Million), by Type, and Applications (2023-2030)
10.1 Global Real Estate Transaction Management Software Revenue (USD Million) and Market Share (%) by Type (2023-2030)
10.1.1 Global Real Estate Transaction Management Software Revenue (USD Million), and Market Share (%) by Type (2023-2030)
10.2 Global Real Estate Transaction Management Software Revenue (USD Million) and Market Share (%) by Applications (2023-2030)
10.2.1 Global Real Estate Transaction Management Software Revenue (USD Million), and Market Share (%) by Applications (2023-2030)
11 Global Real Estate Transaction Management Software Development Regional Status and Outlook Forecast
11.1 Global Real Estate Transaction Management Software Revenue (USD Million) By Regions (2023-2030)
11.2 North America Real Estate Transaction Management Software Revenue (USD Million) by Type, and Applications (2023-2030)
11.2.1 North America Real Estate Transaction Management Software Revenue (USD) Million by Country (2023-2030)
11.2.2 North America Real Estate Transaction Management Software Revenue (USD Million), by Type (2023-2030)
11.2.3 North America Real Estate Transaction Management Software Revenue (USD Million), Market Share (%) by Applications (2023-2030)
11.3 Europe Real Estate Transaction Management Software Revenue (USD Million), by Type, and Applications (2023-2030)
11.3.1 Europe Real Estate Transaction Management Software Revenue (USD Million), by Country (2023-2030)
11.3.2 Europe Real Estate Transaction Management Software Revenue (USD Million), by Type (2023-2030)
11.3.3 Europe Real Estate Transaction Management Software Revenue (USD Million), by Applications (2023-2030)
11.4 Asia Pacific Real Estate Transaction Management Software Revenue (USD Million) by Type, and Applications (2023-2030)
11.4.1 Asia Pacific Real Estate Transaction Management Software Revenue (USD Million), by Country (2023-2030)
11.4.2 Asia Pacific Real Estate Transaction Management Software Revenue (USD Million), by Type (2023-2030)
11.4.3 Asia Pacific Real Estate Transaction Management Software Revenue (USD Million), by Applications (2023-2030)
11.5 South America Real Estate Transaction Management Software Revenue (USD Million), by Type, and Applications (2023-2030)
11.5.1 South America Real Estate Transaction Management Software Revenue (USD Million), by Country (2023-2030)
11.5.2 South America Real Estate Transaction Management Software Revenue (USD Million), by Type (2023-2030)
11.5.3 South America Real Estate Transaction Management Software Revenue (USD Million), by Applications (2023-2030)
11.6 Middle East and Africa Real Estate Transaction Management Software Revenue (USD Million), by Type, and Applications (2023-2030)
11.6.1 Middle East and Africa Real Estate Transaction Management Software Revenue (USD Million), by Region (2023-2030)
11.6.2 Middle East and Africa Real Estate Transaction Management Software Revenue (USD Million), by Type (2023-2030)
11.6.3 Middle East and Africa Real Estate Transaction Management Software Revenue (USD Million), by Applications (2023-2030)
12 Methodology and Data Sources
12.1 Methodology/Research Approach
12.1.1 Research Programs/Design
12.1.2 Market Size Estimation
12.1.3 Market Breakdown and Data Triangulation
12.2 Data Sources
12.2.1 Secondary Sources
12.2.2 Primary Sources
12.3 Disclaimer
List of Tables
Table 1 Market Segmentation Analysis
Table 2 Global Real Estate Transaction Management Software Market Companies with Areas Served
Table 3 Products Offerings Global Real Estate Transaction Management Software Market
Table 4 Low Growth Scenario Forecasts
Table 5 Reference Case Growth Scenario
Table 6 High Growth Case Scenario
Table 7 Global Real Estate Transaction Management Software Revenue (USD Million) And CAGR (%) By Type (2018-2030)
Table 8 Global Real Estate Transaction Management Software Revenue (USD Million) And CAGR (%) By Applications (2018-2030)
Table 9 Global Real Estate Transaction Management Software Revenue (USD Million) And CAGR (%) By Regions (2018-2030)
Table 10 Global Real Estate Transaction Management Software Revenue (USD Million) By Type (2018-2022)
Table 11 Global Real Estate Transaction Management Software Revenue Market Share (%) By Type (2018-2022)
Table 12 Global Real Estate Transaction Management Software Revenue (USD Million) By Applications (2018-2022)
Table 13 Global Real Estate Transaction Management Software Revenue Market Share (%) By Applications (2018-2022)
Table 14 Global Real Estate Transaction Management Software Market Revenue (USD Million) By Regions (2018-2022)
Table 15 Global Real Estate Transaction Management Software Market Share (%) By Regions (2018-2022)
Table 16 North America Real Estate Transaction Management Software Revenue (USD Million) By Country (2018-2022)
Table 17 North America Real Estate Transaction Management Software Revenue (USD Million) By Type (2018-2022)
Table 18 North America Real Estate Transaction Management Software Revenue (USD Million) By Applications (2018-2022)
Table 19 Europe Real Estate Transaction Management Software Revenue (USD Million) By Country (2018-2022)
Table 20 Europe Real Estate Transaction Management Software Revenue (USD Million) By Type (2018-2022)
Table 21 Europe Real Estate Transaction Management Software Revenue (USD Million) By Applications (2018-2022)
Table 22 Asia Pacific Real Estate Transaction Management Software Revenue (USD Million) By Country (2018-2022)
Table 23 Asia Pacific Real Estate Transaction Management Software Revenue (USD Million) By Type (2018-2022)
Table 24 Asia Pacific Real Estate Transaction Management Software Revenue (USD Million) By Applications (2018-2022)
Table 25 South America Real Estate Transaction Management Software Revenue (USD Million) By Country (2018-2022)
Table 26 South America Real Estate Transaction Management Software Revenue (USD Million) By Type (2018-2022)
Table 27 South America Real Estate Transaction Management Software Revenue (USD Million) By Applications (2018-2022)
Table 28 Middle East and Africa Real Estate Transaction Management Software Revenue (USD Million) By Region (2018-2022)
Table 29 Middle East and Africa Real Estate Transaction Management Software Revenue (USD Million) By Type (2018-2022)
Table 30 Middle East and Africa Real Estate Transaction Management Software Revenue (USD Million) By Applications (2018-2022)
Table 31 Financial Analysis
Table 32 Global Real Estate Transaction Management Software Revenue (USD Million) By Type (2023-2030)
Table 33 Global Real Estate Transaction Management Software Revenue Market Share (%) By Type (2023-2030)
Table 34 Global Real Estate Transaction Management Software Revenue (USD Million) By Applications (2023-2030)
Table 35 Global Real Estate Transaction Management Software Revenue Market Share (%) By Applications (2023-2030)
Table 36 Global Real Estate Transaction Management Software Market Revenue (USD Million), And Revenue (USD Million) By Regions (2023-2030)
Table 37 North America Real Estate Transaction Management Software Revenue (USD)By Country (2023-2030)
Table 38 North America Real Estate Transaction Management Software Revenue (USD Million) By Type (2023-2030)
Table 39 North America Real Estate Transaction Management Software Revenue (USD Million) By Applications (2023-2030)
Table 40 Europe Real Estate Transaction Management Software Revenue (USD Million) By Country (2023-2030)
Table 41 Europe Real Estate Transaction Management Software Revenue (USD Million) By Type (2023-2030)
Table 42 Europe Real Estate Transaction Management Software Revenue (USD Million) By Applications (2023-2030)
Table 43 Asia Pacific Real Estate Transaction Management Software Revenue (USD Million) By Country (2023-2030)
Table 44 Asia Pacific Real Estate Transaction Management Software Revenue (USD Million) By Type (2023-2030)
Table 45 Asia Pacific Real Estate Transaction Management Software Revenue (USD Million) By Applications (2023-2030)
Table 46 South America Real Estate Transaction Management Software Revenue (USD Million) By Country (2023-2030)
Table 47 South America Real Estate Transaction Management Software Revenue (USD Million) By Type (2023-2030)
Table 48 South America Real Estate Transaction Management Software Revenue (USD Million) By Applications (2023-2030)
Table 49 Middle East and Africa Real Estate Transaction Management Software Revenue (USD Million) By Region (2023-2030)
Table 50 Middle East and Africa Real Estate Transaction Management Software Revenue (USD Million) By Region (2023-2030)
Table 51 Middle East and Africa Real Estate Transaction Management Software Revenue (USD Million) By Type (2023-2030)
Table 52 Middle East and Africa Real Estate Transaction Management Software Revenue (USD Million) By Applications (2023-2030)
Table 53 Research Programs/Design for This Report
Table 54 Key Data Information from Secondary Sources
Table 55 Key Data Information from Primary Sources
List of Figures
Figure 1 Market Scope
Figure 2 Porter’s Five Forces
Figure 3 Global Real Estate Transaction Management Software Revenue (USD Million) By Type (2018-2022)
Figure 4 Global Real Estate Transaction Management Software Revenue Market Share (%) By Type (2022)
Figure 5 Global Real Estate Transaction Management Software Revenue (USD Million) By Applications (2018-2022)
Figure 6 Global Real Estate Transaction Management Software Revenue Market Share (%) By Applications (2022)
Figure 7 Global Real Estate Transaction Management Software Market Revenue (USD Million) By Regions (2018-2022)
Figure 8 Global Real Estate Transaction Management Software Market Share (%) By Regions (2022)
Figure 9 North America Real Estate Transaction Management Software Revenue (USD Million) By Country (2018-2022)
Figure 10 North America Real Estate Transaction Management Software Revenue (USD Million) By Type (2018-2022)
Figure 11 North America Real Estate Transaction Management Software Revenue (USD Million) By Applications (2018-2022)
Figure 12 Europe Real Estate Transaction Management Software Revenue (USD Million) By Country (2018-2022)
Figure 13 Europe Real Estate Transaction Management Software Revenue (USD Million) By Type (2018-2022)
Figure 14 Europe Real Estate Transaction Management Software Revenue (USD Million) By Applications (2018-2022)
Figure 15 Asia Pacific Real Estate Transaction Management Software Revenue (USD Million) By Country (2018-2022)
Figure 16 Asia Pacific Real Estate Transaction Management Software Revenue (USD Million) By Type (2018-2022)
Figure 17 Asia Pacific Real Estate Transaction Management Software Revenue (USD Million) By Applications (2018-2022)
Figure 18 South America Real Estate Transaction Management Software Revenue (USD Million) By Country (2018-2022)
Figure 19 South America Real Estate Transaction Management Software Revenue (USD Million) By Type (2018-2022)
Figure 20 South America Real Estate Transaction Management Software Revenue (USD Million) By Applications (2018-2022)
Figure 21 Middle East and Africa Real Estate Transaction Management Software Revenue (USD Million) By Region (2018-2022)
Figure 22 Middle East and Africa Real Estate Transaction Management Software Revenue (USD Million) By Type (2018-2022)
Figure 23 Middle East and Africa Real Estate Transaction Management Software Revenue (USD Million) By Applications (2018-2022)
Figure 24 Global Real Estate Transaction Management Software Revenue (USD Million) By Type (2023-2030)
Figure 25 Global Real Estate Transaction Management Software Revenue Market Share (%) By Type (2030)
Figure 26 Global Real Estate Transaction Management Software Revenue (USD Million) By Applications (2023-2030)
Figure 27 Global Real Estate Transaction Management Software Revenue Market Share (%) By Applications (2030)
Figure 28 Global Real Estate Transaction Management Software Market Revenue (USD Million) By Regions (2023-2030)
Figure 29 North America Real Estate Transaction Management Software Revenue (USD Million) By Country (2023-2030)
Figure 30 North America Real Estate Transaction Management Software Revenue (USD Million) By Type (2023-2030)
Figure 31 North America Real Estate Transaction Management Software Revenue (USD Million) By Applications (2023-2030)
Figure 32 Europe Real Estate Transaction Management Software Revenue (USD Million) By Country (2023-2030)
Figure 33 Europe Real Estate Transaction Management Software Revenue (USD Million) By Type (2023-2030)
Figure 34 Europe Real Estate Transaction Management Software Revenue (USD Million) By Applications (2023-2030)
Figure 35 Asia Pacific Real Estate Transaction Management Software Revenue (USD Million) By Country (2023-2030)
Figure 36 Asia Pacific Real Estate Transaction Management Software Revenue (USD Million) By Type (2023-2030)
Figure 37 Asia Pacific Real Estate Transaction Management Software Revenue (USD Million) By Applications (2023-2030)
Figure 38 South America Real Estate Transaction Management Software Revenue (USD Million) By Country (2023-2030)
Figure 39 South America Real Estate Transaction Management Software Revenue (USD Million) By Type (2023-2030)
Figure 40 South America Real Estate Transaction Management Software Revenue (USD Million) By Applications (2023-2030)
Figure 41 Middle East and Africa Real Estate Transaction Management Software Revenue (USD Million) By Region (2023-2030)
Figure 42 Middle East and Africa Real Estate Transaction Management Software Revenue (USD Million) By Region (2023-2030)
Figure 43 Middle East and Africa Real Estate Transaction Management Software Revenue (USD Million) By Type (2023-2030)
Figure 44 Middle East and Africa Real Estate Transaction Management Software Revenue (USD Million) By Applications (2023-2030)
Figure 45 Bottom-Up and Top-Down Approaches For This Report
Figure 46 Data Triangulation
