
The need for accurate and efficient financial reconciliation processes is the key factor. Companies dealing with numerous transactions or diverse financial instruments require robust reconciliation solutions to manage and reconcile vast amounts of data efficiently leading to market growth. The growing emphasis on data security drives the adoption of reconciliation software with robust security features. Cloud solutions offer real-time access to data, facilitate collaboration among teams, and enable easier integration with other software and systems. Better integration with a wide array of financial systems, ERPs (Enterprise Resource Planning), CRMs (Customer Relationship Management), and other business software are driving market growth. Intuitive designs, simplified workflows, and user-friendly interfaces are being prioritized to enhance usability and reduce the learning curve for users.
Integration with enterprise resource planning (ERP) systems, payment gateways, and other financial software enabling seamless data flow and instant reconciliation are the driving the market growth.
With the rise of digital transactions and complex financial instruments, businesses across various industries are seeking real-time reconciliation solutions to match transactional data swiftly and accurately, enabling prompt identification and resolution of discrepancies.
The need for remote work capabilities and the shift towards digital transactions prompted businesses to seek agile and adaptable tools that could handle real-time data processing, ensuring continuity and efficiency in financial operations.
The increasing business ventures into international markets, encountering diverse currencies, regulatory frameworks, and complex financial transactions necessitates market growth.
Businesses are increasingly prioritizing solutions that offer flexibility, scalability, and accessibility, enabling remote teams to collaborate effectively while managing global financial data and reconciliation processes.
Furthermore, mergers, acquisitions, and strategic partnerships among businesses on a global scale are highly contributing to the demand.
Businesses embracing digitalization and technological advancements lead to the surge in the sheer volume and diversity of financial transactions, contributing to the widespread of the market.
The introduction of new financial products, such as cryptocurrencies, derivatives, and complex investment vehicles are intensifying the market demand.
The shift towards online transactions and remote operations is leading to a surge in digital payments, requiring reconciliation software that could manage increased transaction volumes efficiently and accurately.
The Recon Software Market is analyzed across Cloud Based & On Premise. Cloud Based is poised to register the fastest growth. Offering scalability, flexibility, and accessibility, cloud-based reconciliation software is becoming increasingly popular among businesses of varying sizes and industries. One of its primary advantages lies in the scalability it provides, allowing organizations to adjust resources based on their fluctuating reconciliation needs. Additionally, the subscription-based model and pay-as-you-go pricing offered by cloud-based solutions reduce upfront costs, making them more cost-effective compared to traditional on-premises software, which often requires substantial initial investments in hardware and maintenance. It enables users to access reconciliation tools from anywhere with internet connectivity, facilitating remote work and enhancing collaboration among teams working across different locations. Further, the cloud environment ensures real-time updates and easier integration with other software and systems, providing seamless functionality and reducing the need for manual intervention in updates and maintenance.
The Recon Software Market is analyzed across various applications including Banks, Insurance, Retail, Government & Others. Of these, Banks held a significant market share in 2023. Banks, being the central entities in the financial ecosystem, handle a myriad of transactions daily, including deposits, withdrawals, fund transfers, and investments. The adoption of reconciliation software within the banking sector primarily arises from the necessity to ensure accuracy, efficiency, and compliance in reconciling these diverse and high-volume financial transactions. It offers a suite of features that automate the matching and verification processes, aiding in swiftly identifying discrepancies and ensuring the precision of financial records. Given the rigorous regulatory landscape that banks operate in, these solutions play a crucial role in maintaining compliance with stringent standards like Basel III, Dodd-Frank Act, Anti-Money Laundering (AML) regulations, and more. Further, software equipped with multi-currency support, real-time processing capabilities, and the ability to handle diverse financial instruments becomes essential for banks to maintain accuracy and efficiency in reconciling their extensive range of transactions.
By Type
By Application
By Enterprise Size
By Region
Xero Limited (New Zealand)
*List not exhaustive
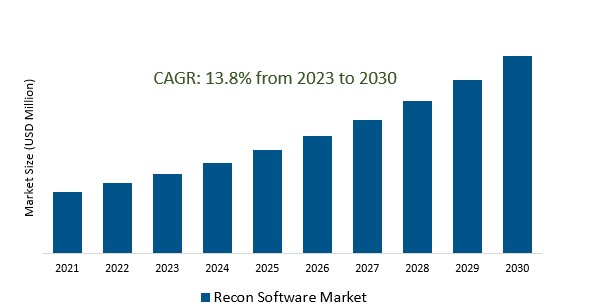
Recon Software Market Outlook 2023
1 Market Overview
1.1 Introduction to the Recon Software Market
1.2 Scope of the Study
1.3 Research Objective
1.3.1 Key Market Scope and Segments
1.3.2 Players Covered
1.3.3 Years Considered
2 Executive Summary
2.1 2023 Recon Software Industry- Market Statistics
3 Market Dynamics
3.1 Market Drivers
3.2 Market Challenges
3.3 Market Opportunities
3.4 Market Trends
4 Market Factor Analysis
4.1 Porter’s Five Forces
4.2 Market Entropy
4.2.1 Global Recon Software Market Companies with Area Served
4.2.2 Products Offerings Global Recon Software Market
5 COVID-19 Impact Analysis and Outlook Scenarios
5.1.1 Covid-19 Impact Analysis
5.1.2 post-COVID-19 Scenario- Low Growth Case
5.1.3 post-COVID-19 Scenario- Reference Growth Case
5.1.4 post-COVID-19 Scenario- Low Growth Case
6 Global Recon Software Market Trends
6.1 Global Recon Software Revenue (USD Million) and CAGR (%) by Type (2018-2030)
6.2 Global Recon Software Revenue (USD Million) and CAGR (%) by Applications (2018-2030)
6.3 Global Recon Software Revenue (USD Million) and CAGR (%) by regions (2018-2030)
7 Global Recon Software Market Revenue (USD Million) by Type, and Applications (2018-2022)
7.1 Global Recon Software Revenue (USD Million) by Type (2018-2022)
7.1.1 Global Recon Software Revenue (USD Million), Market Share (%) by Type (2018-2022)
7.2 Global Recon Software Revenue (USD Million) by Applications (2018-2022)
7.2.1 Global Recon Software Revenue (USD Million), Market Share (%) by Applications (2018-2022)
8 Global Recon Software Development Regional Status and Outlook
8.1 Global Recon Software Revenue (USD Million) By Regions (2018-2022)
8.2 North America Recon Software Revenue (USD Million) by Type, and Application (2018-2022)
8.2.1 North America Recon Software Revenue (USD Million) by Country (2018-2022)
8.2.2 North America Recon Software Revenue (USD Million) by Type (2018-2022)
8.2.3 North America Recon Software Revenue (USD Million) by Applications (2018-2022)
8.3 Europe Recon Software Revenue (USD Million), by Type, and Applications (USD Million) (2018-2022)
8.3.1 Europe Recon Software Revenue (USD Million), by Country (2018-2022)
8.3.2 Europe Recon Software Revenue (USD Million) by Type (2018-2022)
8.3.3 Europe Recon Software Revenue (USD Million) by Applications (2018-2022)
8.4 Asia Pacific Recon Software Revenue (USD Million), and Revenue (USD Million) by Type, and Applications (2018-2022)
8.4.1 Asia Pacific Recon Software Revenue (USD Million) by Country (2018-2022)
8.4.2 Asia Pacific Recon Software Revenue (USD Million) by Type (2018-2022)
8.4.3 Asia Pacific Recon Software Revenue (USD Million) by Applications (2018-2022)
8.5 South America Recon Software Revenue (USD Million), by Type, and Applications (2018-2022)
8.5.1 South America Recon Software Revenue (USD Million), by Country (2018-2022)
8.5.2 South America Recon Software Revenue (USD Million) by Type (2018-2022)
8.5.3 South America Recon Software Revenue (USD Million) by Applications (2018-2022)
8.6 Middle East and Africa Recon Software Revenue (USD Million), by Type, Technology, Application, Thickness (2018-2022)
8.6.1 Middle East and Africa Recon Software Revenue (USD Million) by Country (2018-2022)
8.6.2 Middle East and Africa Recon Software Revenue (USD Million) by Type (2018-2022)
8.6.3 Middle East and Africa Recon Software Revenue (USD Million) by Applications (2018-2022)
9 Company Profiles
10 Global Recon Software Market Revenue (USD Million), by Type, and Applications (2023-2030)
10.1 Global Recon Software Revenue (USD Million) and Market Share (%) by Type (2023-2030)
10.1.1 Global Recon Software Revenue (USD Million), and Market Share (%) by Type (2023-2030)
10.2 Global Recon Software Revenue (USD Million) and Market Share (%) by Applications (2023-2030)
10.2.1 Global Recon Software Revenue (USD Million), and Market Share (%) by Applications (2023-2030)
11 Global Recon Software Development Regional Status and Outlook Forecast
11.1 Global Recon Software Revenue (USD Million) By Regions (2023-2030)
11.2 North America Recon Software Revenue (USD Million) by Type, and Applications (2023-2030)
11.2.1 North America Recon Software Revenue (USD) Million by Country (2023-2030)
11.2.2 North America Recon Software Revenue (USD Million), by Type (2023-2030)
11.2.3 North America Recon Software Revenue (USD Million), Market Share (%) by Applications (2023-2030)
11.3 Europe Recon Software Revenue (USD Million), by Type, and Applications (2023-2030)
11.3.1 Europe Recon Software Revenue (USD Million), by Country (2023-2030)
11.3.2 Europe Recon Software Revenue (USD Million), by Type (2023-2030)
11.3.3 Europe Recon Software Revenue (USD Million), by Applications (2023-2030)
11.4 Asia Pacific Recon Software Revenue (USD Million) by Type, and Applications (2023-2030)
11.4.1 Asia Pacific Recon Software Revenue (USD Million), by Country (2023-2030)
11.4.2 Asia Pacific Recon Software Revenue (USD Million), by Type (2023-2030)
11.4.3 Asia Pacific Recon Software Revenue (USD Million), by Applications (2023-2030)
11.5 South America Recon Software Revenue (USD Million), by Type, and Applications (2023-2030)
11.5.1 South America Recon Software Revenue (USD Million), by Country (2023-2030)
11.5.2 South America Recon Software Revenue (USD Million), by Type (2023-2030)
11.5.3 South America Recon Software Revenue (USD Million), by Applications (2023-2030)
11.6 Middle East and Africa Recon Software Revenue (USD Million), by Type, and Applications (2023-2030)
11.6.1 Middle East and Africa Recon Software Revenue (USD Million), by region (2023-2030)
11.6.2 Middle East and Africa Recon Software Revenue (USD Million), by Type (2023-2030)
11.6.3 Middle East and Africa Recon Software Revenue (USD Million), by Applications (2023-2030)
12 Methodology and Data Sources
12.1 Methodology/Research Approach
12.1.1 Research Programs/Design
12.1.2 Market Size Estimation
12.1.3 Market Breakdown and Data Triangulation
12.2 Data Sources
12.2.1 Secondary Sources
12.2.2 Primary Sources
12.3 Disclaimer
List of Tables
Table 1 Market Segmentation Analysis
Table 2 Global Recon Software Market Companies with Areas Served
Table 3 Products Offerings Global Recon Software Market
Table 4 Low Growth Scenario Forecasts
Table 5 Reference Case Growth Scenario
Table 6 High Growth Case Scenario
Table 7 Global Recon Software Revenue (USD Million) And CAGR (%) By Type (2018-2030)
Table 8 Global Recon Software Revenue (USD Million) And CAGR (%) By Applications (2018-2030)
Table 9 Global Recon Software Revenue (USD Million) And CAGR (%) By Regions (2018-2030)
Table 10 Global Recon Software Revenue (USD Million) By Type (2018-2022)
Table 11 Global Recon Software Revenue Market Share (%) By Type (2018-2022)
Table 12 Global Recon Software Revenue (USD Million) By Applications (2018-2022)
Table 13 Global Recon Software Revenue Market Share (%) By Applications (2018-2022)
Table 14 Global Recon Software Market Revenue (USD Million) By Regions (2018-2022)
Table 15 Global Recon Software Market Share (%) By Regions (2018-2022)
Table 16 North America Recon Software Revenue (USD Million) By Country (2018-2022)
Table 17 North America Recon Software Revenue (USD Million) By Type (2018-2022)
Table 18 North America Recon Software Revenue (USD Million) By Applications (2018-2022)
Table 19 Europe Recon Software Revenue (USD Million) By Country (2018-2022)
Table 20 Europe Recon Software Revenue (USD Million) By Type (2018-2022)
Table 21 Europe Recon Software Revenue (USD Million) By Applications (2018-2022)
Table 22 Asia Pacific Recon Software Revenue (USD Million) By Country (2018-2022)
Table 23 Asia Pacific Recon Software Revenue (USD Million) By Type (2018-2022)
Table 24 Asia Pacific Recon Software Revenue (USD Million) By Applications (2018-2022)
Table 25 South America Recon Software Revenue (USD Million) By Country (2018-2022)
Table 26 South America Recon Software Revenue (USD Million) By Type (2018-2022)
Table 27 South America Recon Software Revenue (USD Million) By Applications (2018-2022)
Table 28 Middle East and Africa Recon Software Revenue (USD Million) By Region (2018-2022)
Table 29 Middle East and Africa Recon Software Revenue (USD Million) By Type (2018-2022)
Table 30 Middle East and Africa Recon Software Revenue (USD Million) By Applications (2018-2022)
Table 31 Financial Analysis
Table 32 Global Recon Software Revenue (USD Million) By Type (2023-2030)
Table 33 Global Recon Software Revenue Market Share (%) By Type (2023-2030)
Table 34 Global Recon Software Revenue (USD Million) By Applications (2023-2030)
Table 35 Global Recon Software Revenue Market Share (%) By Applications (2023-2030)
Table 36 Global Recon Software Market Revenue (USD Million), And Revenue (USD Million) By Regions (2023-2030)
Table 37 North America Recon Software Revenue (USD)By Country (2023-2030)
Table 38 North America Recon Software Revenue (USD Million) By Type (2023-2030)
Table 39 North America Recon Software Revenue (USD Million) By Applications (2023-2030)
Table 40 Europe Recon Software Revenue (USD Million) By Country (2023-2030)
Table 41 Europe Recon Software Revenue (USD Million) By Type (2023-2030)
Table 42 Europe Recon Software Revenue (USD Million) By Applications (2023-2030)
Table 43 Asia Pacific Recon Software Revenue (USD Million) By Country (2023-2030)
Table 44 Asia Pacific Recon Software Revenue (USD Million) By Type (2023-2030)
Table 45 Asia Pacific Recon Software Revenue (USD Million) By Applications (2023-2030)
Table 46 South America Recon Software Revenue (USD Million) By Country (2023-2030)
Table 47 South America Recon Software Revenue (USD Million) By Type (2023-2030)
Table 48 South America Recon Software Revenue (USD Million) By Applications (2023-2030)
Table 49 Middle East and Africa Recon Software Revenue (USD Million) By Region (2023-2030)
Table 50 Middle East and Africa Recon Software Revenue (USD Million) By Region (2023-2030)
Table 51 Middle East and Africa Recon Software Revenue (USD Million) By Type (2023-2030)
Table 52 Middle East and Africa Recon Software Revenue (USD Million) By Applications (2023-2030)
Table 53 Research Programs/Design for This Report
Table 54 Key Data Information from Secondary Sources
Table 55 Key Data Information from Primary Sources
List of Figures
Figure 1 Market Scope
Figure 2 Porter’s Five Forces
Figure 3 Global Recon Software Revenue (USD Million) By Type (2018-2022)
Figure 4 Global Recon Software Revenue Market Share (%) By Type (2022)
Figure 5 Global Recon Software Revenue (USD Million) By Applications (2018-2022)
Figure 6 Global Recon Software Revenue Market Share (%) By Applications (2022)
Figure 7 Global Recon Software Market Revenue (USD Million) By Regions (2018-2022)
Figure 8 Global Recon Software Market Share (%) By Regions (2022)
Figure 9 North America Recon Software Revenue (USD Million) By Country (2018-2022)
Figure 10 North America Recon Software Revenue (USD Million) By Type (2018-2022)
Figure 11 North America Recon Software Revenue (USD Million) By Applications (2018-2022)
Figure 12 Europe Recon Software Revenue (USD Million) By Country (2018-2022)
Figure 13 Europe Recon Software Revenue (USD Million) By Type (2018-2022)
Figure 14 Europe Recon Software Revenue (USD Million) By Applications (2018-2022)
Figure 15 Asia Pacific Recon Software Revenue (USD Million) By Country (2018-2022)
Figure 16 Asia Pacific Recon Software Revenue (USD Million) By Type (2018-2022)
Figure 17 Asia Pacific Recon Software Revenue (USD Million) By Applications (2018-2022)
Figure 18 South America Recon Software Revenue (USD Million) By Country (2018-2022)
Figure 19 South America Recon Software Revenue (USD Million) By Type (2018-2022)
Figure 20 South America Recon Software Revenue (USD Million) By Applications (2018-2022)
Figure 21 Middle East and Africa Recon Software Revenue (USD Million) By Region (2018-2022)
Figure 22 Middle East and Africa Recon Software Revenue (USD Million) By Type (2018-2022)
Figure 23 Middle East and Africa Recon Software Revenue (USD Million) By Applications (2018-2022)
Figure 24 Global Recon Software Revenue (USD Million) By Type (2023-2030)
Figure 25 Global Recon Software Revenue Market Share (%) By Type (2030)
Figure 26 Global Recon Software Revenue (USD Million) By Applications (2023-2030)
Figure 27 Global Recon Software Revenue Market Share (%) By Applications (2030)
Figure 28 Global Recon Software Market Revenue (USD Million) By Regions (2023-2030)
Figure 29 North America Recon Software Revenue (USD Million) By Country (2023-2030)
Figure 30 North America Recon Software Revenue (USD Million) By Type (2023-2030)
Figure 31 North America Recon Software Revenue (USD Million) By Applications (2023-2030)
Figure 32 Europe Recon Software Revenue (USD Million) By Country (2023-2030)
Figure 33 Europe Recon Software Revenue (USD Million) By Type (2023-2030)
Figure 34 Europe Recon Software Revenue (USD Million) By Applications (2023-2030)
Figure 35 Asia Pacific Recon Software Revenue (USD Million) By Country (2023-2030)
Figure 36 Asia Pacific Recon Software Revenue (USD Million) By Type (2023-2030)
Figure 37 Asia Pacific Recon Software Revenue (USD Million) By Applications (2023-2030)
Figure 38 South America Recon Software Revenue (USD Million) By Country (2023-2030)
Figure 39 South America Recon Software Revenue (USD Million) By Type (2023-2030)
Figure 40 South America Recon Software Revenue (USD Million) By Applications (2023-2030)
Figure 41 Middle East and Africa Recon Software Revenue (USD Million) By Region (2023-2030)
Figure 42 Middle East and Africa Recon Software Revenue (USD Million) By Region (2023-2030)
Figure 43 Middle East and Africa Recon Software Revenue (USD Million) By Type (2023-2030)
Figure 44 Middle East and Africa Recon Software Revenue (USD Million) By Applications (2023-2030)
Figure 45 Bottom-Up and Top-Down Approaches for This Report
Figure 46 Data Triangulation
By Type
By Application
By Enterprise Size
By Region