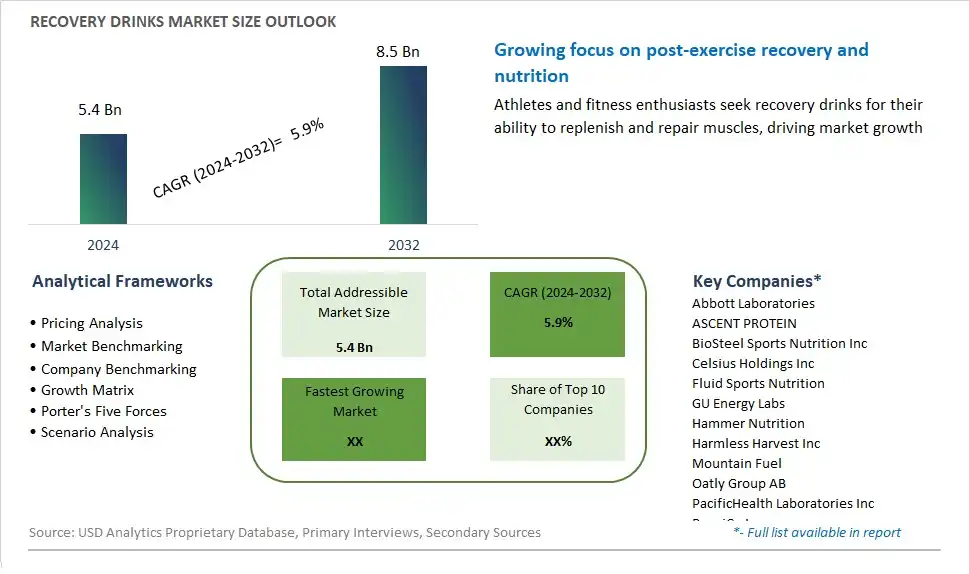
Global Recovery Drinks Market Size is valued at $5.4 Billion in 2024 and is forecast to register a growth rate (CAGR) of 5.9% to reach $8.5 Billion by 2032.
The global Recovery Drinks Market Comprehensive Study analyzes and forecasts the market size across 6 regions and 24 countries for diverse segments -By Type (RTD, Powder), By Category (Isotonic, Hypotonic, Hypertonic), By Distribution Channel (Supermarkets/Hypermarkets, Sports Nutrition chain, Convenience Stores, Online Retail Stores, Others)
An Introduction to Recovery Drinks Market
The recovery drinks market in 2024 is experiencing robust growth, driven by increasing participation in sports and fitness activities and the rising awareness of the importance of post-workout nutrition. Recovery drinks, formulated with electrolytes, proteins, vitamins, and minerals, are designed to replenish and repair the body after intense physical activity. The market is characterized by a wide range of products targeting different needs, from muscle recovery to hydration and energy replenishment. Innovations in formulation, such as plant-based proteins and natural ingredients, are appealing to health-conscious consumers. Additionally, the convenience of ready-to-drink formats and the influence of fitness trends on social media are significantly boosting market growth.
Recovery Drinks Competitive Landscape
The market report analyses the leading companies in the industry including Abbott Laboratories, ASCENT PROTEIN, BioSteel Sports Nutrition Inc, Celsius Holdings Inc, Fluid Sports Nutrition, GU Energy Labs, Hammer Nutrition, Harmless Harvest Inc, Mountain Fuel, Oatly Group AB, PacificHealth Laboratories Inc, PepsiCo Inc, Rakyan Beverages Pvt. Ltd, RECOVER 180, Red Bull GmbH, Rus Organic, Skratch Labs LLC, Smartfish AS, Suntory Beverage and Food Ltd, The Coca Cola Co., and Others.
Recovery Drinks Market Dynamics
Recovery Drinks Market Trend: Increasing Focus on Post-Workout Recovery and Wellness
A significant market trend in the recovery drinks segment is the increasing focus on post-workout recovery and overall wellness among consumers. With more people engaging in physical fitness activities and sports, there is a growing recognition of the importance of proper recovery after exercise. Recovery drinks offer a convenient and effective way to replenish lost nutrients, rehydrate the body, and support muscle recovery, making them an essential part of post-exercise routines. This trend is driven by a shift towards holistic approaches to health and fitness, where consumers prioritize recovery and rejuvenation to maximize the benefits of their workouts and lead healthier lifestyles.
Market Driver: Demand for Functional Beverages with Targeted Benefits
The market driver for recovery drinks is the demand for functional beverages with targeted benefits tailored to specific wellness needs. As consumers become more educated about nutrition and seek solutions to support their health goals, there is a growing demand for beverages that offer more than just hydration. Recovery drinks that incorporate ingredients such as electrolytes, amino acids, vitamins, minerals, and plant-based extracts are sought after for their ability to aid in hydration, replenish energy stores, reduce muscle soreness, and promote overall recovery. This driver is fueled by the desire for convenient and effective solutions that optimize performance, enhance recovery, and support an active lifestyle.
Market Opportunity: Expansion into Niche Market Segments and Customization
One potential opportunity for the recovery drinks market lies in expansion into niche market segments and customization options. While mainstream recovery drinks cater to general post-workout needs, there is an opportunity to target specific consumer demographics and fitness niches with specialized formulations and customized offerings. For example, recovery drinks tailored for endurance athletes, CrossFit enthusiasts, or yoga practitioners can address unique hydration and recovery needs associated with different types of physical activities. Moreover, offering customization options such as personalized ingredient blends, flavor preferences, and packaging sizes can enhance consumer engagement, foster brand loyalty, and meet the diverse needs of the growing market for recovery beverages.
Recovery Drinks Market Share Analysis: RTD (Ready-to-Drink) held the dominant market share in 2024
In the Recovery Drinks market segmented by type, the RTD (Ready-to-Drink) segment is the largest, driven by its convenience, immediate availability, and consumer preference for on-the-go consumption. RTD recovery drinks are pre-mixed and packaged for direct consumption, offering a quick and hassle-free solution for replenishing nutrients and hydration post-exercise or physical activity. This segment appeals to busy individuals, athletes, and fitness enthusiasts who seek convenient and effective recovery options without the need for preparation or mixing. Further, RTD recovery drinks are often formulated with a balanced combination of electrolytes, vitamins, minerals, and protein, tailored to support muscle recovery, hydration, and overall recovery needs. Additionally, the RTD format eliminates the need for measuring and mixing, making it an attractive option for consumers seeking simplicity and convenience. Furthermore, the widespread availability of RTD recovery drinks in supermarkets, convenience stores, gyms, and online platforms ensures accessibility to consumers across different demographics and lifestyles, further solidifying its dominance as the largest segment in the Recovery Drinks market.
Recovery Drinks Market Share Analysis: Isotonic market is poised to register the fastest growth rae over the forecast period to 2032
In the Recovery Drinks market segmented by category, the Isotonic segment is the fastest-growing, driven by its ability to quickly replenish fluids, electrolytes, and carbohydrates lost during intense physical activity. Isotonic recovery drinks have a similar concentration of salts and sugars to the body's fluids, facilitating rapid absorption and hydration. This segment appeals to athletes, fitness enthusiasts, and individuals engaging in strenuous activities who seek immediate rehydration and replenishment of nutrients. Further, isotonic drinks are often fortified with electrolytes such as sodium and potassium, which help restore electrolyte balance and prevent dehydration more effectively than other categories. Additionally, the growing awareness of the importance of proper hydration and electrolyte balance in optimizing athletic performance and recovery fuels the demand for isotonic recovery drinks. Furthermore, the convenience of isotonic drinks in ready-to-drink formats makes them a convenient choice for on-the-go consumption before, during, and after workouts or sporting events, driving their rapid growth in the Recovery Drinks market. Overall, the combination of effective hydration, rapid nutrient replenishment, and consumer demand for convenience positions the Isotonic segment as the fastest-growing category in the market.
Recovery Drinks Market Share Analysis: Supermarkets/Hypermarkets held the dominant market share in 2024
In the Recovery Drinks market segmented by distribution channel, Supermarkets/Hypermarkets emerge as the largest segment, driven by their extensive reach, diverse product offerings, and consumer convenience. These retail giants serve as primary destinations for consumers to purchase recovery drinks due to their wide selection of beverages and one-stop shopping convenience. Supermarkets and hypermarkets leverage their expansive floor space and strategic placement of products to ensure high visibility and accessibility for consumers. Further, they often run promotional campaigns and offer discounts on recovery drinks, attracting budget-conscious shoppers. Additionally, the established distribution networks of supermarkets and hypermarkets ensure efficient supply chain management, guaranteeing consistent availability of recovery drinks to meet consumer demand. Furthermore, the growing trend of health and fitness consciousness among consumers has led supermarkets and hypermarkets to expand their selection of sports and wellness products, including recovery drinks, further solidifying their dominance as the largest distribution channel in the market.
Recovery Drinks Market Segmentation
By Type
RTD
Powder
By Category
Isotonic
Hypotonic
Hypertonic
By Distribution Channel
Supermarkets/Hypermarkets
Sports Nutrition chain
Convenience Stores
Online Retail Stores
Others
Countries Analyzed
North America (US, Canada, Mexico)
Europe (Germany, UK, France, Spain, Italy, Russia, Rest of Europe)
Asia Pacific (China, India, Japan, South Korea, Australia, South East Asia, Rest of Asia)
South America (Brazil, Argentina, Rest of South America)
Middle East and Africa (Saudi Arabia, UAE, Rest of Middle East, South Africa, Egypt, Rest of Africa)
Recovery Drinks Companies Profiled in the Study
Abbott Laboratories
ASCENT PROTEIN
BioSteel Sports Nutrition Inc
Celsius Holdings Inc
Fluid Sports Nutrition
GU Energy Labs
Hammer Nutrition
Harmless Harvest Inc
Mountain Fuel
Oatly Group AB
PacificHealth Laboratories Inc
PepsiCo Inc
Rakyan Beverages Pvt. Ltd
RECOVER 180
Red Bull GmbH
Rus Organic
Skratch Labs LLC
Smartfish AS
Suntory Beverage and Food Ltd
The Coca Cola Co.
*- List Not Exhaustive
Chapter 1. TABLE OF CONTENTS
Chapter 2. Introduction to Recovery Drinks Market
2.1. Market Overview
2.2. Key Statistics and Report Highlights
2.3. Scope of the Comprehensive Study
2.3.1. Market Definition
2.3.2 Countries and Regions Covered
2.3.3 Research Objective
2.3.4 Units, Currency, and Conversions
2.3.5 Industry Value Chain
2.4. Key Market Segments
2.5. Key Companies
2.6. Study Period
Chapter 3. Strategic Analysis Review
3.1. Recovery Drinks Pricing Analysis and Forecast
3.2. Porter’s Five Forces
3.3. Market Ecosystem
3.4. SWOT Analysis
3.5. Regulatory Scenario
3.3. Effects of Inflation, Russia-Ukraine War, moderating economic growth, and other macroeconomic factors
Chapter 4. Competitive Landscape
4.1. Market Share Analysis
4.1.1. Global Recovery Drinks Market Share by Company, 2023
4.1.2. Product Offerings of Leading Recovery Drinks Companies
4.2. Market Entropy
4.2.1. New Product Launches in the Industry
4.2.2. Mergers, Acquisitions, Joint ventures, and Partnerships
4.3. Key Strategies and Best Practices
Chapter 5. Global Market Projections: Best, Reference, and Low Case Scenarios
5.1. Growth Analysis- Case Scenario Definitions
5.2. Low Growth Case Scenario Forecasts
5.3. Reference Growth Case Scenario Forecasts
5.4. High Growth Case Scenario Forecasts
Chapter 6. Market Dynamics
6.1. Recovery Drinks Market Drivers
6.2. Recovery Drinks Market Challenges
6.6. Recovery Drinks Market Opportunities
6.4. Recovery Drinks Market Trends
Chapter 7. Global Recovery Drinks Market Outlook Trends
7.1. Global Recovery Drinks Revenue (USD Million) and CAGR (%) by Type (2021-2032)
7.2. Global Recovery Drinks Revenue (USD Million) and CAGR (%) by Application (2021-2032)
7.3. Global Recovery Drinks Revenue (USD Million) and CAGR (%) by Product (2021-2032)
By Type
RTD
Powder
By Category
Isotonic
Hypotonic
Hypertonic
By Distribution Channel
Supermarkets/Hypermarkets
Sports Nutrition chain
Convenience Stores
Online Retail Stores
Others
Chapter 8. Global Recovery Drinks Regional Analysis and Outlook
8.1. Global Recovery Drinks Revenue (USD Million) By Regions (2021- 2032)
8.2. North America Recovery Drinks Revenue (USD Million) by Country (2021-2032)
8.2.1. United States Recovery Drinks Regional Analysis and Outlook
8.2.2. Canada Recovery Drinks Regional Analysis and Outlook
8.2.3. Mexico Recovery Drinks Regional Analysis and Outlook
8.3. Europe Recovery Drinks Revenue (USD Million), by Country (2021-2032)
8.3.1. Germany Recovery Drinks Regional Analysis and Outlook
8.3.2. France Recovery Drinks Regional Analysis and Outlook
8.3.3. United Kingdom Recovery Drinks Regional Analysis and Outlook
8.3.4. Spain Recovery Drinks Regional Analysis and Outlook
8.3.5. Italy Recovery Drinks Regional Analysis and Outlook
8.3.6. Russia Recovery Drinks Regional Analysis and Outlook
8.3.7. Rest of Europe Recovery Drinks Regional Analysis and Outlook
8.4. Asia Pacific Recovery Drinks Revenue (USD Million) by Country (2021-2032)
8.4.1. China Recovery Drinks Regional Analysis and Outlook
8.4.2. Japan Recovery Drinks Regional Analysis and Outlook
8.4.3. India Recovery Drinks Regional Analysis and Outlook
8.4.4. South Korea Recovery Drinks Regional Analysis and Outlook
8.4.5. Australia Recovery Drinks Regional Analysis and Outlook
8.4.6. South East Asia Recovery Drinks Regional Analysis and Outlook
8.4.7. Rest of Asia Pacific Recovery Drinks Regional Analysis and Outlook
8.5. South America Recovery Drinks Revenue (USD Million), by Country (2021-2032)
8.5.1. Brazil Recovery Drinks Regional Analysis and Outlook
8.5.2. Argentina Recovery Drinks Regional Analysis and Outlook
8.5.3. Rest of South America Recovery Drinks Regional Analysis and Outlook
8.6. Middle East and Africa Recovery Drinks Revenue (USD Million) by Country (2021-2032)
8.6.1. Middle East Recovery Drinks Regional Analysis and Outlook
8.6.2. Africa Recovery Drinks Regional Analysis and Outlook
Chapter 9. North America Recovery Drinks Analysis and Outlook
9.1. North America Recovery Drinks Revenue (USD Million) by Segments (2021-2032)
9.1.1. North America Recovery Drinks Revenue (USD Million) by Type (2021-2032)
9.1.2. North America Recovery Drinks Revenue (USD Million) by Application (2021-2032)
9.1.3. North America Recovery Drinks Revenue (USD Million) by Product (2021-2032)
By Type
RTD
Powder
By Category
Isotonic
Hypotonic
Hypertonic
By Distribution Channel
Supermarkets/Hypermarkets
Sports Nutrition chain
Convenience Stores
Online Retail Stores
Others
Chapter 10. Europe Recovery Drinks Analysis and Outlook
10.1. Europe Recovery Drinks Revenue (USD Million), by Segments (USD Million) (2021-2032)
10.1.1. Europe Recovery Drinks Revenue (USD Million) by Type (2021-2032)
10.1.2. Europe Recovery Drinks Revenue (USD Million) by Application (2021-2032)
10.1.3. Europe Recovery Drinks Revenue (USD Million) by Product (2021-2032)
By Type
RTD
Powder
By Category
Isotonic
Hypotonic
Hypertonic
By Distribution Channel
Supermarkets/Hypermarkets
Sports Nutrition chain
Convenience Stores
Online Retail Stores
Others
Chapter 11. Asia Pacific Recovery Drinks Analysis and Outlook
11.1. Asia Pacific Recovery Drinks Revenue (USD Million), and Revenue (USD Million) by Segments (2021-2032)
11.1.1. Asia Pacific Recovery Drinks Revenue (USD Million) by Type (2021-2032)
11.1.2. Asia Pacific Recovery Drinks Revenue (USD Million) by Application (2021-2032)
11.1.3. Asia Pacific Recovery Drinks Revenue (USD Million) by Product (2021-2032)
By Type
RTD
Powder
By Category
Isotonic
Hypotonic
Hypertonic
By Distribution Channel
Supermarkets/Hypermarkets
Sports Nutrition chain
Convenience Stores
Online Retail Stores
Others
Chapter 12. South America Recovery Drinks Analysis and Outlook
12.1. South America Recovery Drinks Revenue (USD Million), by Segments (2021-2032)
12.1.1. South America Recovery Drinks Revenue (USD Million) by Type (2021-2032)
12.1.2. South America Recovery Drinks Revenue (USD Million) by Application (2021-2032)
12.1.3. South America Recovery Drinks Revenue (USD Million) by Product (2021-2032)
By Type
RTD
Powder
By Category
Isotonic
Hypotonic
Hypertonic
By Distribution Channel
Supermarkets/Hypermarkets
Sports Nutrition chain
Convenience Stores
Online Retail Stores
Others
Chapter 13. Middle East and Africa Recovery Drinks Analysis and Outlook
13.1. Middle East and Africa Recovery Drinks Revenue (USD Million), by Segments (2021-2032)
13.1.1. Middle East and Africa Recovery Drinks Revenue (USD Million) by Type (2021-2032)
13.1.2. Middle East and Africa Recovery Drinks Revenue (USD Million) by Application (2021-2032)
13.1.3. Middle East and Africa Recovery Drinks Revenue (USD Million) by Product (2021-2032)
By Type
RTD
Powder
By Category
Isotonic
Hypotonic
Hypertonic
By Distribution Channel
Supermarkets/Hypermarkets
Sports Nutrition chain
Convenience Stores
Online Retail Stores
Others
Chapter 14. Recovery Drinks Company Profiles
14.1 Business Overview
14.2 Product Profiles
14.3 SWOT Profiles
14.5 Recent Developments
14.6 Financial Profile
List of Companies
Abbott Laboratories
ASCENT PROTEIN
BioSteel Sports Nutrition Inc
Celsius Holdings Inc
Fluid Sports Nutrition
GU Energy Labs
Hammer Nutrition
Harmless Harvest Inc
Mountain Fuel
Oatly Group AB
PacificHealth Laboratories Inc
PepsiCo Inc
Rakyan Beverages Pvt. Ltd
RECOVER 180
Red Bull GmbH
Rus Organic
Skratch Labs LLC
Smartfish AS
Suntory Beverage and Food Ltd
The Coca Cola Co.
15. Methodology and Data Sources
15.1 Customization Offerings
15.2 Subscription Services
15.3 Related Reports
15.4 Publisher Expertise
LIST OF TABLES
Table 1 Market Segmentation Analysis
Table 2 Global Recovery Drinks Market Share of Leading Companies, 2023
Table 3 Product Offerings of Leading Companies
Table 4 Low Growth Scenario Forecasts
Table 5 Reference Case Growth Scenario
Table 6 High Growth Case Scenario
Table 7 Global Recovery Drinks Revenue (USD Million) And CAGR (%) By Type (2021-2032)
Table 8 Global Recovery Drinks Revenue (USD Million) And CAGR (%) By Application (2021-2032)
Table 9 Global Recovery Drinks Revenue (USD Million) And CAGR (%) By Product (2021-2032)
Table 10 Global Recovery Drinks Market Revenue (USD Million) By Regions (2021-2032)
Table 11 Global Recovery Drinks Market Share (%) By Regions (2021-2032)
Table 12 North America Recovery Drinks Revenue (USD Million) By Country (2021-2032)
Table 13 Europe Recovery Drinks Revenue (USD Million) By Country (2021-2032)
Table 14 Asia Pacific Recovery Drinks Revenue (USD Million) By Country (2021-2032)
Table 15 South America Recovery Drinks Revenue (USD Million) By Country (2021-2032)
Table 16 Middle East and Africa Recovery Drinks Revenue (USD Million) By Region (2021-2032)
Table 17 North America Recovery Drinks Revenue (USD Million) By Type (2021-2032)
Table 18 North America Recovery Drinks Revenue (USD Million) By Application (2021-2032)
Table 19 North America Recovery Drinks Revenue (USD Million) By Product (2021-2032)
Table 20 Europe Recovery Drinks Revenue (USD Million) By Type (2021-2032)
Table 21 Europe Recovery Drinks Revenue (USD Million) By Application (2021-2032)
Table 22 Europe Recovery Drinks Revenue (USD Million) By Product (2021-2032)
Table 23 Asia Pacific Recovery Drinks Revenue (USD Million) By Type (2021-2032)
Table 24 Asia Pacific Recovery Drinks Revenue (USD Million) By Application (2021-2032)
Table 25 Asia Pacific Recovery Drinks Revenue (USD Million) By Product (2021-2032)
Table 26 South America Recovery Drinks Revenue (USD Million) By Type (2021-2032)
Table 27 South America Recovery Drinks Revenue (USD Million) By Application (2021-2032)
Table 28 South America Recovery Drinks Revenue (USD Million) By Product (2021-2032)
Table 29 Middle East and Africa Recovery Drinks Revenue (USD Million) By Type (2021-2032)
Table 30 Middle East and Africa Recovery Drinks Revenue (USD Million) By Application (2021-2032)
Table 31 Middle East and Africa Recovery Drinks Revenue (USD Million) By Product (2021-2032)
LIST OF FIGURES
Figure 1. Market Scope
Figure 2. Pricing Forecasts Per Unit, 2023- 2032
Figure 3. Porter’s Five Forces
Figure 4. Global Recovery Drinks Market Revenue (USD Million) By Regions (2021-2032)
Figure 5. Global Recovery Drinks Market Share (%) By Regions (2023)
Figure 6. North America Recovery Drinks Revenue (USD Million) By Country (2021-2032)
Figure 7. United States Recovery Drinks Revenue (USD Million) By Country (2021-2032)
Figure 8. Canada Recovery Drinks Revenue (USD Million) By Country (2021-2032)
Figure 9. Mexico Recovery Drinks Revenue (USD Million) By Country (2021-2032)
Figure 10. Europe Recovery Drinks Revenue (USD Million) By Country (2021-2032)
Figure 11. Germany Recovery Drinks Revenue (USD Million) By Country (2021-2032)
Figure 12. France Recovery Drinks Revenue (USD Million) By Country (2021-2032)
Figure 13. United Kingdom Recovery Drinks Revenue (USD Million) By Country (2021-2032)
Figure 14. Spain Recovery Drinks Revenue (USD Million) By Country (2021-2032)
Figure 15. Italy Recovery Drinks Revenue (USD Million) By Country (2021-2032)
Figure 16. Russia Recovery Drinks Revenue (USD Million) By Country (2021-2032)
Figure 17. Rest of Europe Recovery Drinks Revenue (USD Million) By Country (2021-2032)
Figure 11. Asia Pacific Recovery Drinks Revenue (USD Million) By Country (2021-2032)
Figure 12. China Recovery Drinks Revenue (USD Million) By Country (2021-2032)
Figure 13. Japan Recovery Drinks Revenue (USD Million) By Country (2021-2032)
Figure 14. India Recovery Drinks Revenue (USD Million) By Country (2021-2032)
Figure 15. South Korea Recovery Drinks Revenue (USD Million) By Country (2021-2032)
Figure 16. Australia Recovery Drinks Revenue (USD Million) By Country (2021-2032)
Figure 17. South East Asia Recovery Drinks Revenue (USD Million) By Country (2021-2032)
Figure 18. South America Recovery Drinks Revenue (USD Million) By Country (2021-2032)
Figure 19. Brazil Recovery Drinks Revenue (USD Million) By Country (2021-2032)
Figure 20. Argentina Recovery Drinks Revenue (USD Million) By Country (2021-2032)
Figure 21. Rest of Asia Pacific Recovery Drinks Revenue (USD Million) By Country (2021-2032)
Figure 22. Middle East and Africa Recovery Drinks Revenue (USD Million) By Region (2021-2032)
Figure 23. Saudi Arabia Recovery Drinks Revenue (USD Million) By Region (2021-2032)
Figure 24. The UAE Recovery Drinks Revenue (USD Million) By Region (2021-2032)
Figure 25. Rest of Middle East Recovery Drinks Revenue (USD Million) By Region (2021-2032)
Figure 26. South Africa Recovery Drinks Revenue (USD Million) By Region (2021-2032)
Figure 27. Africa Recovery Drinks Revenue (USD Million) By Region (2021-2032)
Figure 28. North America Recovery Drinks Revenue (USD Million) By Type (2021-2032)
Figure 29. North America Recovery Drinks Revenue (USD Million) By Application (2021-2032)
Figure 30. North America Recovery Drinks Revenue (USD Million) By Product (2021-2032)
Figure 31. Europe Recovery Drinks Revenue (USD Million) By Type (2021-2032)
Figure 32. Europe Recovery Drinks Revenue (USD Million) By Application (2021-2032)
Figure 33. Europe Recovery Drinks Revenue (USD Million) By Product (2021-2032)
Figure 34. Asia Pacific Recovery Drinks Revenue (USD Million) By Type (2021-2032)
Figure 35. Asia Pacific Recovery Drinks Revenue (USD Million) By Application (2021-2032)
Figure 36. Asia Pacific Recovery Drinks Revenue (USD Million) By Product (2021-2032)
Figure 37. South America Recovery Drinks Revenue (USD Million) By Type (2021-2032)
Figure 38. South America Recovery Drinks Revenue (USD Million) By Application (2021-2032)
Figure 39. South America Recovery Drinks Revenue (USD Million) By Product (2021-2032)
Figure 40. Middle East and Africa Recovery Drinks Revenue (USD Million) By Type (2021-2032)
Figure 41. Middle East and Africa Recovery Drinks Revenue (USD Million) By Application (2021-2032)
Figure 42. Middle East and Africa Recovery Drinks Revenue (USD Million) By Product (2021-2032)
By Type
RTD
Powder
By Category
Isotonic
Hypotonic
Hypertonic
By Distribution Channel
Supermarkets/Hypermarkets
Sports Nutrition chain
Convenience Stores
Online Retail Stores
Others
Countries Analyzed
North America (US, Canada, Mexico)
Europe (Germany, UK, France, Spain, Italy, Russia, Rest of Europe)
Asia Pacific (China, India, Japan, South Korea, Australia, South East Asia, Rest of Asia)
South America (Brazil, Argentina, Rest of South America)
Middle East and Africa (Saudi Arabia, UAE, Rest of Middle East, South Africa, Egypt, Rest of Africa)
