Market Overview: Rising Investments in Recycling Water Filtration Market
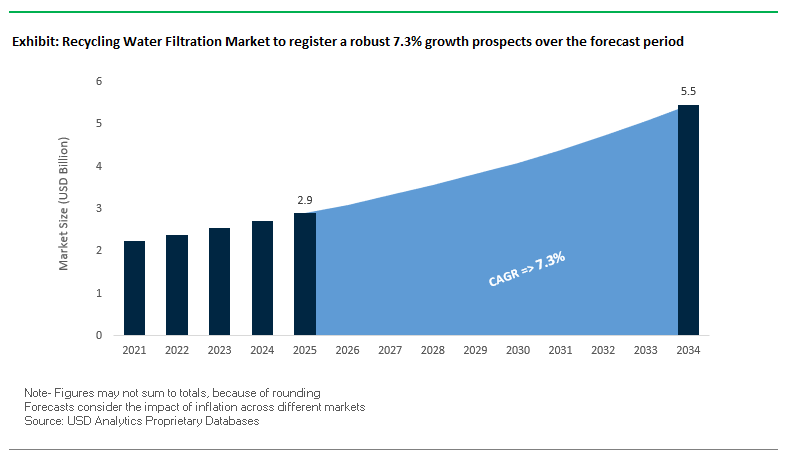
The recycling water filtration market is projected to grow from $2.9 billion in 2025 to $5.5 billion by 2034, expanding at a CAGR of 7.3%. This growth reflects increasing global investments in advanced filtration technologies, strict environmental regulations, and rising demand for sustainable water reuse solutions across industries.
Key Insights:
- Asia Pacific leads the recycling water filtration market in 2024, dominated by China and India, where strict regulations and industrial growth drive large-scale adoption.
- Industrial manufacturing sectors such as semiconductors, power generation, and food & beverage are top adopters, integrating filtration for operational efficiency and compliance.
- Membrane filtration technologies like RO and ultrafiltration (UF) account for the largest technology share, due to their proven effectiveness in achieving high-purity water.
- Middle East nations such as Saudi Arabia are investing heavily in desalination and wastewater recycling projects, addressing extreme water stress.
Market Analysis: Recent Developments Driving the Recycling Water Filtration Market
The recycling water filtration industry is evolving through large-scale projects, strategic acquisitions, and groundbreaking innovations in membrane technologies. These developments showcase how governments and corporations are accelerating investments in water reuse systems to combat water stress and meet sustainability goals.
In August 2025, VA Tech Wabag secured a ₹46.5 crore contract from RenewSys India for a 2 GW solar cell facility in Hyderabad, integrating advanced ultrapure water systems and ZLD solutions. Just a month earlier, in July 2025, Wabag also won a ₹380 crore project in Bengaluru, positioning itself as a municipal water reuse leader in India. The same month, Brunswick County, North Carolina, advanced its $167.3 million reverse osmosis project, one of the largest in the U.S., targeting PFAS contaminant removal.
Meanwhile, Veolia Water Technologies expanded its market presence in May 2025 by acquiring full ownership of its Water Technologies and Solutions subsidiary, streamlining its offerings and strengthening its global water recycling portfolio. In March 2025, European authorities announced funding for next-gen membrane anti-fouling coatings, marking a pivotal step in lowering operational costs and boosting filtration efficiency.
Earlier projects underscore long-term momentum. In December 2024, Ramky Infrastructure secured a ₹215.08 crore sewage treatment plant O&M contract in Hyderabad, a crucial backbone for municipal recycling. SUEZ, in October 2024, won new contracts in China, including a Chongqing water treatment plant. Around the same time, Nitto Denko Corporation unveiled carbon-negative membrane technologies at COP29, signaling new pathways for CO₂ recovery and integrated water-energy solutions.
Emerging Trends Shaping the Recycling Water Filtration Market
Policy and Financial Incentives Driving Large-Scale Water Recycling Projects
Government policies and financial investments are catalyzing the adoption of water recycling systems, particularly in emerging economies. In India, 32 cities are actively practicing wastewater recycling, with initiatives such as Nagpur using treated water for thermal power plant cooling and Bengaluru employing treated effluent for agriculture and lake rejuvenation. Over the past decade, the Indian government has invested US$ 250 billion in the water sector, significantly supporting the deployment of advanced filtration infrastructure and incentivizing both public and private stakeholders to invest in large-scale water recycling solutions.
The Rise of Advanced and Hybrid Membrane Filtration Technologies
Technological innovation is central to improving recycled water quality. Research in the journal Membranes (2023) highlights hybrid systems combining Moving Bed Biofilm Reactors (MBBR), Membrane Bioreactors (MBR), and Direct Contact Membrane Distillation (DCMD) to treat industrial wastewater effectively, producing high-quality effluent suitable for reuse. Further advancements, such as novel matrix mixed membranes with flux recovery ratios of 97%, demonstrate ongoing efforts to enhance membrane longevity, efficiency, and fouling resistance, reflecting a market trend towards hybrid, high-performance solutions.
Industrial Sector Investment in Circular Water Management
Leading corporations are integrating recycling water filtration into their sustainability and operational strategies. For example, Carlsberg’s Fredericia Brewery reclaims 90% of process water, reducing total water consumption by 50% and saving approximately 0.5 billion liters per year. Similarly, L'Oréal in Warsaw achieves nearly 15% water savings through onsite recycling. Collaborative initiatives, such as Microsoft and the City of Quincy’s Water Reuse Utility, showcase successful public-private partnerships that optimize water reuse and reduce dependence on potable sources, demonstrating how industrial investments are driving innovation and growth in water filtration systems.
Strategic Opportunities in the Recycling Water Filtration Market
Opportunities in the market are driven by sustainability mandates, industrial efficiency, and advanced technology adoption. The growing focus on hybrid and integrated systems creates a chance for technology providers to deliver optimized, space-efficient solutions capable of handling complex wastewater streams. Industrial sectors, including power generation, electronics, and chemicals, are seeking high-quality recycled water, creating demand for advanced membrane and polishing technologies. Additionally, municipal and commercial recycling initiatives offer expansion potential, particularly in water-stressed regions where non-potable reuse and greywater recycling are increasingly mandated. Companies that provide turnkey solutions combining membranes, biological treatment, and advanced oxidation are well-positioned to capture high-value projects and long-term contracts globally.
Recycling Water Filtration Market Share Insights
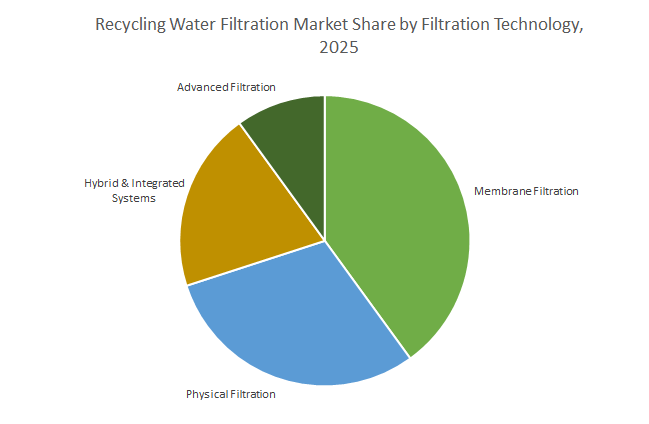
Market Share by Filtration Technology (2025)
Membrane filtration leads the market with a 40% share, reflecting its ability to deliver high-purity water essential for industrial reuse, indirect potable applications, and sensitive manufacturing processes. Physical filtration (30%), including media and cartridge filters, remains foundational, protecting downstream membranes and advanced systems from fouling. Hybrid & integrated systems (20%), such as MBRs, are increasingly adopted for their compact footprint, efficiency, and ability to handle complex effluents. The advanced filtration segment (10%), incorporating AOPs, activated carbon, and ion exchange, is focused on micro-pollutant removal and trace contaminant management, catering to high-value reuse applications. The mix underscores a trend towards multi-step, technology-integrated solutions for optimized recycling.
Market Share by Application (2025)
Industrial recycling dominates with 55%, driven by the need to reduce freshwater procurement costs, lower effluent charges, and ensure continuous operational water security. Municipal recycling (30%) is growing rapidly, propelled by population growth, water scarcity, and regulatory mandates for irrigation, groundwater recharge, and indirect potable reuse. Commercial and residential recycling (15%) is expanding in response to green building standards and local ordinances, with systems designed for non-potable applications such as toilet flushing, irrigation, and cooling tower makeup. The adoption patterns highlight how economic and sustainability drivers differ across sectors, influencing technology and investment priorities.
Market Share by End-Use Industry (2025)
Power generation accounts for 20% of market share, representing high-volume applications for cooling towers, boilers, and FGD systems. Food & beverage (15%) and chemicals & petrochemicals (15%) rely on consistent quality for operational efficiency and regulatory compliance. Electronics & semiconductors (12%) demand ultra-pure water (UPW), making advanced RO and polishing technologies critical. Municipal utilities (10%) enable large-scale urban water reuse, supporting industrial clusters and potable reuse initiatives. Oil & gas (8%) utilizes recycled water for hydraulic fracturing, particularly in shale plays. Other industries such as pulp, textiles, and pharmaceuticals (20%) have specialized needs for dye, fiber, or high-purity contaminant removal. The breakdown illustrates the dual focus on volume efficiency and water quality, with industries adopting tailored filtration solutions to maximize sustainability and operational value.
Country Analysis of Recycling Water Filtration Market
China: Expanding Recycling Water Filtration Through Regulatory Push and Innovation
China is a major driver in the recycling water filtration market, fueled by stringent industrial wastewater regulations enforced by the Ministry of Ecology and Environment (MEE). The government’s 14th Five-Year Plan emphasizes water reuse and targets 95% wastewater treatment for all county-level cities, generating robust demand for recycling water filtration infrastructure. In 2024, researchers at the Chinese Academy of Sciences developed a dual-functional reverse osmosis (RO) membrane with enhanced antibacterial and anti-adhesion properties, improving the efficiency of RO systems commonly used in recycling applications. Significant government investments, totaling $50 billion by 2025, target wastewater treatment in heavy-polluting sectors like textiles, steel, and pharmaceuticals. Membrane bioreactors (MBRs) are increasingly deployed in municipal wastewater expansion and renovation projects to comply with stricter discharge standards while offering compact footprints.
United States: Government Funding and Corporate Innovation Driving Advanced Water Reuse
The U.S. recycling water filtration market is strongly influenced by federal funding and advanced technology deployment. Through the Bipartisan Infrastructure Law, the Environmental Protection Agency (EPA) receives over $50 billion to improve water infrastructure, including addressing emerging contaminants like PFAS. The new PFAS Maximum Contaminant Levels are prompting retrofits of existing treatment facilities with advanced membrane filtration systems. Public-private partnerships such as the National Alliance for Water Innovation (NAWI) are funding novel membrane development for waste-brine treatment and renewable-powered desalination. Corporate initiatives by Veolia Water Technologies, Evoqua Water Technologies, and Koch Separation Solutions emphasize modular MBR systems for efficient retrofitting. Investments by Micron Technology in Aqua Membranes’ 3D-printed spacers further demonstrate industrial adoption aimed at enhancing water reuse and conservation.
India: Infrastructure Expansion and Advanced Filtration Driving Water Recycling
India is witnessing significant growth in recycling water filtration through government initiatives and infrastructure investment. Programs like the Jal Jeevan Mission, Namami Gange Mission, and Smart Cities Mission are accelerating new wastewater treatment deployments and modernization of existing plants. Under the Atal Mission for Rejuvenation and Urban Transformation (AMRUT), approximately USD 10 billion has been allocated to enhance water supply and wastewater treatment, with public-private partnership (PPP) models facilitating large-scale projects. Advanced technologies such as sequencing batch reactors (SBR) and membrane bioreactors (MBR) are being adopted to achieve higher treatment efficiencies. Industrial sectors, including power plants, chemicals, and textiles, are increasingly implementing water reuse solutions to mitigate water scarcity and comply with stringent environmental regulations.
Singapore: NEWater Project Leading Advanced Recycling Practices
Singapore is a global pioneer in water recycling, with the NEWater initiative serving as a benchmark for high-quality recycled water. The system integrates microfiltration, reverse osmosis, and UV disinfection to treat wastewater for industrial and potable purposes. The Public Utilities Board (PUB) continuously invests in R&D to enhance recycling capabilities, focusing on advanced membrane technologies and monitoring systems. Recycled water is applied for industrial cooling, blended into the potable water supply, and other applications, highlighting Singapore’s commitment to sustainable and reliable water reuse solutions.
Germany: Advanced Regulations and Innovative Membrane Systems
Germany leads the recycling water filtration market in Europe through strong regulatory frameworks and innovative technological adoption. The German Federal Wastewater Charges Act imposes fees on entities discharging wastewater, encouraging the use of advanced treatment solutions. Companies like CERAFILTEC provide ceramic flat membranes for MBR projects with capacities ranging from 250 m³/d industrial to 10,000 m³/d municipal systems. PPU Umwelttechnik is developing containerized membrane systems that can retrofit existing infrastructure, providing cost-effective solutions for both industrial and municipal applications. These initiatives position Germany as a leader in efficient, high-quality water recycling.
Japan: Academic Excellence and MBR Deployment Driving Recycling Technology
Japan’s recycling water filtration market benefits from a strong focus on research and membrane technology deployment. Academic institutions and corporations, including Toray Industries Inc., are developing high-efficiency separation membrane modules, offering more than double the filtration performance of conventional systems while reducing clogging. Government programs like the Advance of Japan Ultimate Membrane bioreactor technology Project (A-JUMP) promote the integration of MBR technology in medium- to large-scale sewage treatment plants, supporting reconstruction, upgrades, and capacity enhancements. MBR technology is expected to become a core solution for improving efficiency and quality in Japan’s water recycling projects.
Competitive Landscape: Leading Companies in the Recycling Water Filtration Market
The competitive landscape of the recycling water filtration market is shaped by multinational leaders driving innovations in reverse osmosis, ultrafiltration, MBR systems, and zero liquid discharge technologies. Each company’s competitive edge is tied to technological depth, project execution capabilities, and sustainability-driven strategies.
SUEZ – End-to-End Digitalized Recycling Filtration Solutions
SUEZ is a global water management leader with a diverse portfolio of reverse osmosis (RO), ultrafiltration (UF), and membrane bioreactors (MBR). Its strength lies in delivering integrated water recycling plants that combine physical membranes with predictive digital analytics. Recent contracts in Asia, including a large SWRO project in the Philippines and industrial wastewater recycling in China, reinforce its dominance. By leveraging AI-driven analytics, SUEZ ensures cost reductions and enhanced filtration performance.
Veolia Water Technologies – Global Leader in Desalination and Water Recycling
Veolia commands over 13 million m³/day of treated capacity across 44 countries, cementing its leadership in desalination and water reuse technologies. In July 2025, Veolia was selected for a major wastewater reuse project in Brazil, implementing advanced biological and membrane technologies for large-scale reclamation. Its unique MemGas™ technology is also applied in renewable gas recovery from wastewater in San Francisco, highlighting its ability to integrate energy-water circular solutions.
DuPont Water Solutions – Materials Science Expertise in Membranes
DuPont leverages decades of expertise in polymer chemistry to supply industry-leading DOW FILMTEC™ membranes for reverse osmosis and nanofiltration. Its award-winning Fortilife™ membranes are designed for challenging wastewater streams, improving efficiency and sustainability in industrial reuse. DuPont’s broad portfolio spanning RO, NF, UF, and ion-exchange resins makes it a trusted provider for zero liquid discharge (ZLD) and industrial recycling projects.
Xylem Inc. – Integrated Wastewater Recycling and Advanced Oxidation Systems
Xylem is a global water technology company delivering end-to-end wastewater recycling solutions. Its 2023 acquisition of Evoqua significantly expanded its membrane bioreactor (MBR) and oxidation process capabilities. Recent partnerships, such as with Gross-Wen Technologies, have advanced algal biofilm wastewater treatment for nutrient recovery and carbon reduction. With a portfolio spanning pumps, analytics, and digital controls, Xylem offers integrated recycling water filtration platforms to utilities worldwide.
Aquatech International – Industrial Leader in Zero Liquid Discharge (ZLD)
Aquatech specializes in industrial water reuse and ZLD technologies, delivering crystallizers, evaporators, RO, and NF systems to high-demand industries. Its partnership with AECOM to commercialize PFAS destruction technology demonstrates leadership in addressing emerging contaminants. Recently, Aquatech secured a landmark project with Kuwait Oil Company’s Lower Fars Heavy Oil Development, highlighting its role in industrial wastewater recycling under extreme conditions.
Recycling Water Filtration Market Report Scope
Recycling Water Filtration Market
|
Parameter
|
Details
|
|
Market Size (2025)
|
$2.9 Billion
|
|
Market Size (2034)
|
$5.5 Billion
|
|
Market Growth Rate
|
7.3%
|
|
Segments
|
By Filtration Technology (Physical Filtration, Membrane Filtration, Advanced Filtration, Hybrid & Integrated Systems), By Application (Industrial Recycling, Municipal Recycling, Commercial & Residential Recycling), By End-Use Industry (Power Generation, Oil & Gas, Food & Beverage, Pharmaceuticals & Biotechnology, Pulp & Paper, Textiles & Dyeing, Electronics & Semiconductors, Chemicals & Petrochemicals, Municipal Utilities, Commercial & Residential Buildings), By System Configuration (Centralized Recycling Systems, Decentralized / Modular Systems)
|
|
Study Period
|
2019- 2024 and 2025-2034
|
|
Units
|
Revenue (USD)
|
|
Qualitative Analysis
|
Porter’s Five Forces, SWOT Profile, Market Share, Scenario Forecasts, Market Ecosystem, Company Ranking, Market Dynamics, Industry Benchmarking
|
|
Companies
|
Veolia, SUEZ, Xylem Inc., Evoqua Water Technologies, Pentair plc, DuPont de Nemours, Inc., Toray Industries, Inc., Aquatech International, Kubota Corporation, The Dow Chemical Company, V.A. TECH WABAG Ltd., Mitsubishi Chemical Corporation, Kuraray Co., Ltd., Nalco Water (An Ecolab Company), MANN+HUMMEL
|
|
Countries
|
US, Canada, Mexico, Germany, France, Spain, Italy, UK, Russia, China, India, Japan, South Korea, Australia, South East Asia, Brazil, Argentina, Middle East, Africa
|
Recycling Water Filtration Market Segmentation
By Filtration Technology
- Physical Filtration
- Sand Filtration
- Multimedia Filtration
- Activated Carbon Filtration
- Membrane Filtration
- Microfiltration (MF)
- Ultrafiltration (UF)
- Nanofiltration (NF)
- Reverse Osmosis (RO)
- Advanced Filtration
- Electro-deionization (EDI)
- Ceramic & Polymeric Membranes
- Forward Osmosis (FO)
- Hybrid & Integrated Systems
- Membrane Bioreactors (MBR)
- Advanced Oxidation + Membrane Systems
By Application
- Industrial Recycling
- Cooling Tower Water Reuse
- Boiler Feedwater Treatment
- Process Water Recycling
- Zero Liquid Discharge (ZLD) Systems
- Municipal Recycling
- Wastewater Reclamation
- Stormwater & Greywater Reuse
- Potable Water Reuse (direct & indirect)
- Commercial & Residential Recycling
- Greywater Recycling Systems
- Decentralized & Building-Integrated Units
By End-Use Industry
- Power Generation
- Oil & Gas
- Food & Beverage
- Pharmaceuticals & Biotechnology
- Pulp & Paper
- Textiles & Dyeing
- Electronics & Semiconductors
- Chemicals & Petrochemicals
- Municipal Utilities
- Commercial & Residential Buildings
By System Configuration
- Centralized Recycling Systems
- Large-Scale Municipal & Industrial Plants
- Decentralized / Modular Systems
- On-site Recycling Units
- Containerized & Mobile Filtration Systems
Countries Analyzed
- North America (US, Canada, Mexico)
- Europe (Germany, UK, France, Spain, Italy, Russia, Rest of Europe)
- Asia Pacific (China, India, Japan, South Korea, Australia, South East Asia, Rest of Asia)
- South America (Brazil, Argentina, Rest of South America)
- Middle East and Africa (Saudi Arabia, UAE, Rest of Middle East, South Africa, Egypt, Rest of Africa)
Top Companies in the Recycling Water Filtration Industry include-
- Veolia
- SUEZ
- Xylem Inc.
- Evoqua Water Technologies
- Pentair plc
- DuPont de Nemours, Inc.
- Toray Industries, Inc.
- Aquatech International
- Kubota Corporation
- The Dow Chemical Company
- V.A. TECH WABAG Ltd.
- Mitsubishi Chemical Corporation
- Kuraray Co., Ltd.
- Nalco Water (An Ecolab Company)
- MANN+HUMMEL
*- List not Exhaustive
Research Coverage
This report investigates the global Recycling Water Filtration Market, delivering analysis reviews on demand catalysts, technology breakthroughs, and strategic highlights that are redefining reuse quality, lifecycle costs, and compliance outcomes through 2034. Produced by USDAnalytics, this report is an essential resource for utilities, industrial operators, EPCs, and policymakers seeking to scale circular water systems with bankable ROI. It maps how hybrid trains (MBR + RO/NF + advanced polishing), decentralized modular units, and digital monitoring raise recovery rates, stabilize effluent under variable loads, and compress footprints in space-constrained sites. By linking project pipelines, policy incentives, and material innovations in membranes and adsorbents, the study equips decision-makers with upgrade archetypes, payback levers, and market entry pathways across municipal, industrial, and commercial settings. Scope Includes-
- Segmentation:
- By Filtration Technology: Physical (Sand, Multimedia, Activated Carbon); Membrane (MF, UF, NF, RO); Advanced (EDI, Ceramic & Polymeric Membranes, FO); Hybrid & Integrated (MBR; Advanced Oxidation + Membrane Systems).
- By Application: Industrial Recycling (Cooling Tower Reuse, Boiler Feed, Process Water, ZLD Systems); Municipal Recycling (Wastewater Reclamation, Stormwater & Greywater Reuse, Potable Reuse direct & indirect); Commercial & Residential (Greywater Systems, Decentralized/Building-Integrated Units).
- By End-Use Industry: Power Generation; Oil & Gas; Food & Beverage; Pharmaceuticals & Biotechnology; Pulp & Paper; Textiles & Dyeing; Electronics & Semiconductors; Chemicals & Petrochemicals; Municipal Utilities; Commercial & Residential Buildings.
- By System Configuration: Centralized (Large Municipal & Industrial Plants); Decentralized/Modular (On-site Units; Containerized & Mobile Systems).
- Geographic Scope: “Analysis spans 25+ countries across North America, Europe, Asia Pacific, Latin America, the Middle East & Africa.”
- Data Coverage: Historic data from 2021–2024 and forecast data from 2025–2034.
- Companies (Analysis/ profiles of 15+ companies): Veolia; SUEZ; Xylem Inc.; Evoqua Water Technologies; Pentair plc; DuPont de Nemours, Inc.; Toray Industries, Inc.; Aquatech International; Kubota Corporation; The Dow Chemical Company; V.A. TECH WABAG Ltd.; Mitsubishi Chemical Corporation; Kuraray Co., Ltd.; Nalco Water (An Ecolab Company); MANN+HUMMEL.
Methodology
USDAnalytics applies a mixed top-down/bottom-up framework: country-level sizing by technology, application, end-use, and system configuration is triangulated with utility capex, industrial water intensity, reuse mandates, and project/tender pipelines. Primary research includes structured interviews with utilities, plant managers, OEMs, integrators, and O&M providers to validate performance deltas (permeate quality, SDI, kWh/m³, chemical dose), cost curves (CAPEX/OPEX), and payback for centralized and modular deployments. Secondary inputs span regulatory databases, PPP/tender trackers, corporate disclosures, and peer-reviewed literature to benchmark KPIs for MBR, RO/NF, AOPs, and ZLD trains. Scenario models stress-test sensitivities to energy prices, PFAS/trace contaminant limits, brine salinity, and automation maturity yielding robust 2025–2034 forecasts and decision-grade guidance.
Deliverables:
- Comprehensive Market Research Report (PDF and Excel) with detailed tables, charts, and interactive visualizations.
- Country-Specific Forecasts & Analysis.
- Segment-Wise Revenue Forecasts (2025–2034).
- Competitive Analysis, Benchmarking, and SWOT Profiles.
- Recent Developments & Innovation Tracker.
- Executive Summary & Analyst Commentary.
- Post-Purchase Analyst Support for Client-Specific Questions and Custom Data Requirements.
Table of Contents: Recycling Water Filtration Market
1. Executive Summary
1.1. Market Highlights and Key Projections
1.2. Key Insights for Industry Stakeholders
1.3. Global Market Snapshot
1.3.1. Current Market Valuation (2025): $2.9 Billion
1.3.2. Projected Market Valuation (2034): $5.5 Billion
1.3.3. Compound Annual Growth Rate (CAGR): 7.3%
2. Market Outlook (2025–2034)
2.1. Introduction: Rising Investments in Water Recycling
2.2. Market Valuation and Growth Projections (2025–2034)
2.3. Emerging Trends Shaping the Market
2.3.1. Policy and Financial Incentives Driving Large-Scale Water Recycling Projects
2.3.2. The Rise of Advanced and Hybrid Membrane Filtration Technologies
2.3.3. Industrial Sector Investment in Circular Water Management
3. Innovations and Strategic Developments Redefining the Market
3.1. Market Analysis: Recent Developments Driving Innovation and Expansion
3.1.1. VA Tech Wabag Secures Major Water Reuse Contracts in India (July-August 2025)
3.1.2. Brunswick County Advances Large-Scale Reverse Osmosis Project in U.S. (July 2025)
3.1.3. Veolia Finalizes Acquisition of Water Technologies and Solutions Subsidiary (August 2025)
3.1.4. European Authorities Fund Next-Gen Membrane Anti-Fouling Coatings (March 2025)
3.1.5. SUEZ Wins New Water Treatment Contracts in China (October 2024)
3.1.6. Nitto Denko Unveils Carbon-Negative Membrane Technologies (October 2024)
4. Competitive Landscape: Recycling Water Filtration Market
4.1. Market Overview: Global Leaders and Innovators
4.2. Key Players Shaping the Market
4.2.1. SUEZ: End-to-End Digitalized Recycling Filtration Solutions
4.2.2. Veolia Water Technologies: Global Leader in Desalination and Water Recycling
4.2.3. DuPont Water Solutions: Materials Science Expertise in Membranes
4.2.4. Xylem Inc.: Integrated Wastewater Recycling and Advanced Oxidation Systems
4.2.5. Aquatech International: Industrial Leader in Zero Liquid Discharge (ZLD)
5. Recycling Water Filtration Market – Segmentation Insights (2025)
5.1. By Filtration Technology
5.1.1. Membrane Filtration (40% Market Share)
5.1.2. Physical Filtration (30% Market Share)
5.1.3. Hybrid & Integrated Systems (20% Market Share)
5.1.4. Advanced Filtration (10% Market Share)
5.2. By Application
5.2.1. Industrial Recycling (55% Market Share)
5.2.2. Municipal Recycling (30% Market Share)
5.2.3. Commercial & Residential Recycling (15% Market Share)
5.3. By End-Use Industry
5.3.1. Power Generation (20% Market Share)
5.3.2. Food & Beverage (15% Market Share)
5.3.3. Chemicals & Petrochemicals (15% Market Share)
5.3.4. Electronics & Semiconductors (12% Market Share)
5.3.5. Municipal Utilities (10% Market Share)
5.3.6. Oil & Gas (8% Market Share)
5.3.7. Other Industries (20% Market Share)
5.4. By System Configuration
5.4.1. Centralized Recycling Systems
5.4.2. Decentralized / Modular Systems
6. Country Analysis and Outlook: Recycling Water Filtration Market
6.1. China: Expanding Recycling Through Regulatory Push and Innovation
6.2. United States: Government Funding and Corporate Innovation Driving Water Reuse
6.3. India: Infrastructure Expansion and Advanced Filtration Driving Recycling
6.4. Singapore: NEWater Project Leading Advanced Recycling Practices
6.5. Germany: Advanced Regulations and Innovative Membrane Systems
6.6. Japan: Academic Excellence and MBR Deployment Driving Technology
6.7. Other Countries Analyzed
6.7.1. North America (Canada, Mexico)
6.7.2. Europe (UK, France, Spain, Italy, Russia, Rest of Europe)
6.7.3. Asia Pacific (South Korea, Australia, South East Asia, Rest of Asia)
6.7.4. South America (Brazil, Argentina, Rest of South America)
6.7.5. Middle East and Africa (Saudi Arabia, UAE, Rest of Middle East, South Africa, Egypt, Rest of Africa)
7. Recycling Water Filtration Market Size Outlook by Region (2025-2034)
7.1. North America Market Size Outlook to 2034
7.1.1. By Filtration Technology
7.1.2. By Application
7.1.3. By End-Use Industry
7.2. Europe Market Size Outlook to 2034
7.2.1. By Filtration Technology
7.2.2. By Application
7.2.3. By End-Use Industry
7.3. Asia Pacific Market Size Outlook to 2034
7.3.1. By Filtration Technology
7.3.2. By Application
7.3.3. By End-Use Industry
7.4. South America Market Size Outlook to 2034
7.4.1. By Filtration Technology
7.4.2. By Application
7.4.3. By End-Use Industry
7.5. Middle East & Africa Market Size Outlook to 2034
7.5.1. By Filtration Technology
7.5.2. By Application
7.5.3. By End-Use Industry
8. Company Profiles: Leading Players in Recycling Water Filtration Industry
8.1. Veolia
8.2. SUEZ
8.3. Xylem Inc.
8.4. Evoqua Water Technologies
8.5. Pentair plc
8.6. DuPont de Nemours, Inc.
8.7. Toray Industries, Inc.
8.8. Aquatech International
8.9. Kubota Corporation
8.10. The Dow Chemical Company
8.11. V.A. TECH WABAG Ltd.
8.12. Mitsubishi Chemical Corporation
8.13. Kuraray Co., Ltd.
8.14. Nalco Water (An Ecolab Company)
8.15. MANN+HUMMEL
9. Methodology
9.1. Research Scope
9.2. Market Research Approach
9.3. Market Sizing and Forecasting Model
9.4. Research Coverage
9.5. Data Horizon
9.6. Deliverables
10. Appendix
10.1. Acronyms and Abbreviations
10.2. List of Tables
10.3. List of Figures
