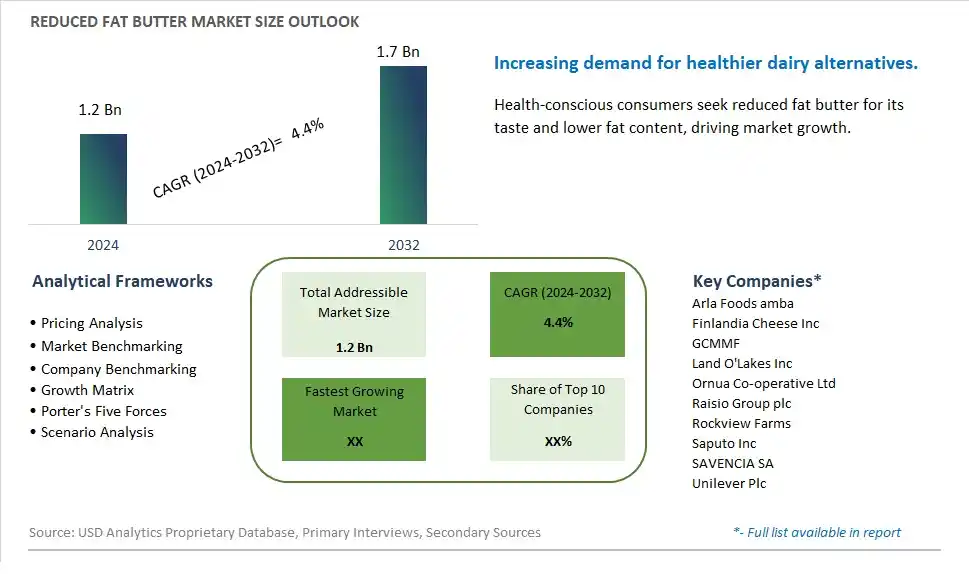
Global Reduced Fat Butter Market Size is valued at $1.2 Billion in 2024 and is forecast to register a growth rate (CAGR) of 4.4% to reach $1.7 Billion by 2032.
The global Reduced Fat Butter Market Comprehensive Study analyzes and forecasts the market size across 6 regions and 24 countries for diverse segments -By Type (Salted, Unsalted), By Form (Spreadable, Non-spreadable), By Distribution Channel (Supermarkets/Hypermarkets, Convenience Stores, Online Retailers, Others)
An Introduction to Reduced Fat Butter Market
The reduced fat butter market in 2024 is witnessing steady growth, driven by increasing consumer awareness of dietary fat intake, health consciousness, and demand for healthier alternatives to traditional butter. Reduced fat butter, formulated to contain lower levels of saturated fat and cholesterol while retaining the creamy texture and flavor profile of traditional butter, is gaining popularity among health-conscious consumers. Manufacturers are leveraging advancements in food processing technologies and ingredient innovation to develop reduced fat butter products that meet consumer expectations for taste, texture, and nutritional value. Additionally, strategic marketing campaigns emphasizing the health benefits of reduced fat butter, such as improved heart health and weight management, are driving consumer adoption and market expansion. Furthermore, collaborations with nutritionists and endorsements from health organizations are reinforcing consumer confidence in reduced fat butter products, further fueling market growth. Overall, the reduced fat butter market is poised for sustained expansion as consumers prioritize healthier dietary choices without compromising on taste and indulgence.
Reduced Fat Butter Competitive Landscape
The market report analyses the leading companies in the industry including Arla Foods amba, Finlandia Cheese Inc, GCMMF, Land O'Lakes Inc, Ornua Co-operative Ltd, Raisio Group plc, Rockview Farms, Saputo Inc, SAVENCIA SA, Unilever Plc, and Others.
Reduced Fat Butter Market Dynamics
Reduced Fat Butter Market Trend: Increasing Focus on Health and Wellness
A significant trend in the reduced fat butter market is the growing emphasis on health and wellness among consumers. As health-consciousness continues to rise globally, there is a shift towards healthier dietary choices, including lower-fat alternatives to traditional products. Reduced fat butter caters to this trend by offering consumers a lighter option with reduced levels of saturated fat. This trend is driven by concerns about heart health, weight management, and overall well-being, prompting consumers to seek out products that align with their health goals.
Market Driver: Consumer Demand for Healthier Alternatives
A key driver for the reduced fat butter market is the increasing consumer demand for healthier alternatives to regular butter. With rising awareness of the health risks associated with high levels of saturated fat consumption, consumers are actively seeking products that offer similar taste and functionality but with lower fat content. Reduced fat butter addresses this demand by providing a compromise between flavor and health benefits, allowing consumers to enjoy the creamy texture and taste of butter while reducing their intake of saturated fat. This driver is fueled by changing dietary preferences and a desire for products that support a healthier lifestyle.
Market Opportunity: Product Innovation and Marketing Strategies
An opportunity for the reduced fat butter market lies in product innovation and effective marketing strategies. Manufacturers can capitalize on the growing demand for healthier butter alternatives by innovating and expanding their product offerings to meet diverse consumer needs. This can involve developing new formulations that reduce fat content without compromising on taste or texture, as well as incorporating functional ingredients like omega-3 fatty acids or plant-based oils to enhance nutritional value. Additionally, companies can employ targeted marketing campaigns to educate consumers about the benefits of reduced fat butter, emphasizing its health advantages and versatility in cooking and baking applications. By leveraging innovation and strategic marketing, businesses can position themselves competitively in the reduced fat butter market and seize opportunities for growth.
Reduced Fat Butter Market Share Analysis: Unsalted held the dominant market share in 2024
In the segmented landscape of the Reduced Fat Butter Market categorized by Type, Unsalted butter is the largest and most prevalent segment, driven by several key factors. Unsalted butter is favored by consumers seeking a purer and more versatile option for cooking, baking, and spreading. Its neutral flavor profile makes it suitable for a wide range of culinary applications, allowing the natural taste of ingredients to shine through without the added saltiness. Additionally, unsalted butter is preferred by health-conscious consumers who wish to control their sodium intake and customize the seasoning of their dishes. Further, unsalted butter is often perceived as a premium product, associated with higher quality and purity compared to salted alternatives. As consumers continue to prioritize healthier and more natural food choices, the dominance of Unsalted butter in the Reduced Fat Butter Market is expected to persist, driving overall market sales and growth.
Reduced Fat Butter Market Share Analysis: Spreadable market is poised to register the fastest growth rae over the forecast period to 2032
In the evolving landscape of the Reduced Fat Butter Market categorized by Form, the Spreadable segment is the fastest-growing player, driven by several key factors. Spreadable reduced-fat butter offers consumers the perfect balance between health-consciousness and convenience, making it an increasingly popular choice for everyday use. Its soft and creamy texture allows for easy spreading straight from the refrigerator, enhancing the consumer experience and versatility in various culinary applications. Additionally, spreadable reduced-fat butter is perceived as a healthier alternative to traditional butter, appealing to consumers seeking to reduce their fat intake while still enjoying the rich taste and texture of butter. Further, the growing demand for on-the-go and convenience-oriented food products further fuels the growth of the Spreadable segment. As consumers continue to prioritize convenience and healthier eating habits, the Spreadable segment is poised to sustain its rapid growth trajectory in the Reduced Fat Butter Market, reshaping consumer preferences and driving overall market expansion.
Reduced Fat Butter Market Share Analysis: Supermarkets/Hypermarkets held the dominant market share in 2024
In the segmented landscape of the Reduced Fat Butter Market categorized by Distribution Channel, Supermarkets/Hypermarkets emerge as the largest and most prevalent segment, driven by several key factors. These retail giants offer consumers a wide selection of reduced-fat butter brands and varieties, providing convenience and accessibility in one-stop shopping destinations. The extensive reach and established presence of supermarkets and hypermarkets ensure widespread availability of reduced-fat butter, catering to diverse consumer preferences and tastes. Additionally, the visibility and strategic placement of products within these stores contribute to impulse purchases and consumer engagement. Further, promotional activities and discounts often offered by supermarkets and hypermarkets further bolster sales in this distribution channel. As consumers increasingly seek healthier alternatives to traditional butter, the dominance of Supermarkets/Hypermarkets in the Reduced Fat Butter Market is expected to persist, driving overall market sales and growth.
Reduced Fat Butter Market Segmentation
By Type
Salted
Unsalted
By Form
Spreadable
Non-spreadable
By Distribution Channel
Supermarkets/Hypermarkets
Convenience Stores
Online Retailers
Others
Countries Analyzed
North America (US, Canada, Mexico)
Europe (Germany, UK, France, Spain, Italy, Russia, Rest of Europe)
Asia Pacific (China, India, Japan, South Korea, Australia, South East Asia, Rest of Asia)
South America (Brazil, Argentina, Rest of South America)
Middle East and Africa (Saudi Arabia, UAE, Rest of Middle East, South Africa, Egypt, Rest of Africa)
Reduced Fat Butter Companies Profiled in the Study
Arla Foods amba
Finlandia Cheese Inc
GCMMF
Land O'Lakes Inc
Ornua Co-operative Ltd
Raisio Group plc
Rockview Farms
Saputo Inc
SAVENCIA SA
Unilever Plc
*- List Not Exhaustive
Chapter 1. TABLE OF CONTENTS
Chapter 2. Introduction to Reduced Fat Butter Market
2.1. Market Overview
2.2. Key Statistics and Report Highlights
2.3. Scope of the Comprehensive Study
2.3.1. Market Definition
2.3.2 Countries and Regions Covered
2.3.3 Research Objective
2.3.4 Units, Currency, and Conversions
2.3.5 Industry Value Chain
2.4. Key Market Segments
2.5. Key Companies
2.6. Study Period
Chapter 3. Strategic Analysis Review
3.1. Reduced Fat Butter Pricing Analysis and Forecast
3.2. Porter’s Five Forces
3.3. Market Ecosystem
3.4. SWOT Analysis
3.5. Regulatory Scenario
3.3. Effects of Inflation, Russia-Ukraine War, moderating economic growth, and other macroeconomic factors
Chapter 4. Competitive Landscape
4.1. Market Share Analysis
4.1.1. Global Reduced Fat Butter Market Share by Company, 2023
4.1.2. Product Offerings of Leading Reduced Fat Butter Companies
4.2. Market Entropy
4.2.1. New Product Launches in the Industry
4.2.2. Mergers, Acquisitions, Joint ventures, and Partnerships
4.3. Key Strategies and Best Practices
Chapter 5. Global Market Projections: Best, Reference, and Low Case Scenarios
5.1. Growth Analysis- Case Scenario Definitions
5.2. Low Growth Case Scenario Forecasts
5.3. Reference Growth Case Scenario Forecasts
5.4. High Growth Case Scenario Forecasts
Chapter 6. Market Dynamics
6.1. Reduced Fat Butter Market Drivers
6.2. Reduced Fat Butter Market Challenges
6.6. Reduced Fat Butter Market Opportunities
6.4. Reduced Fat Butter Market Trends
Chapter 7. Global Reduced Fat Butter Market Outlook Trends
7.1. Global Reduced Fat Butter Revenue (USD Million) and CAGR (%) by Type (2021-2032)
7.2. Global Reduced Fat Butter Revenue (USD Million) and CAGR (%) by Application (2021-2032)
7.3. Global Reduced Fat Butter Revenue (USD Million) and CAGR (%) by Product (2021-2032)
By Type
Salted
Unsalted
By Form
Spreadable
Non-spreadable
By Distribution Channel
Supermarkets/Hypermarkets
Convenience Stores
Online Retailers
Others
Chapter 8. Global Reduced Fat Butter Regional Analysis and Outlook
8.1. Global Reduced Fat Butter Revenue (USD Million) By Regions (2021- 2032)
8.2. North America Reduced Fat Butter Revenue (USD Million) by Country (2021-2032)
8.2.1. United States Reduced Fat Butter Regional Analysis and Outlook
8.2.2. Canada Reduced Fat Butter Regional Analysis and Outlook
8.2.3. Mexico Reduced Fat Butter Regional Analysis and Outlook
8.3. Europe Reduced Fat Butter Revenue (USD Million), by Country (2021-2032)
8.3.1. Germany Reduced Fat Butter Regional Analysis and Outlook
8.3.2. France Reduced Fat Butter Regional Analysis and Outlook
8.3.3. United Kingdom Reduced Fat Butter Regional Analysis and Outlook
8.3.4. Spain Reduced Fat Butter Regional Analysis and Outlook
8.3.5. Italy Reduced Fat Butter Regional Analysis and Outlook
8.3.6. Russia Reduced Fat Butter Regional Analysis and Outlook
8.3.7. Rest of Europe Reduced Fat Butter Regional Analysis and Outlook
8.4. Asia Pacific Reduced Fat Butter Revenue (USD Million) by Country (2021-2032)
8.4.1. China Reduced Fat Butter Regional Analysis and Outlook
8.4.2. Japan Reduced Fat Butter Regional Analysis and Outlook
8.4.3. India Reduced Fat Butter Regional Analysis and Outlook
8.4.4. South Korea Reduced Fat Butter Regional Analysis and Outlook
8.4.5. Australia Reduced Fat Butter Regional Analysis and Outlook
8.4.6. South East Asia Reduced Fat Butter Regional Analysis and Outlook
8.4.7. Rest of Asia Pacific Reduced Fat Butter Regional Analysis and Outlook
8.5. South America Reduced Fat Butter Revenue (USD Million), by Country (2021-2032)
8.5.1. Brazil Reduced Fat Butter Regional Analysis and Outlook
8.5.2. Argentina Reduced Fat Butter Regional Analysis and Outlook
8.5.3. Rest of South America Reduced Fat Butter Regional Analysis and Outlook
8.6. Middle East and Africa Reduced Fat Butter Revenue (USD Million) by Country (2021-2032)
8.6.1. Middle East Reduced Fat Butter Regional Analysis and Outlook
8.6.2. Africa Reduced Fat Butter Regional Analysis and Outlook
Chapter 9. North America Reduced Fat Butter Analysis and Outlook
9.1. North America Reduced Fat Butter Revenue (USD Million) by Segments (2021-2032)
9.1.1. North America Reduced Fat Butter Revenue (USD Million) by Type (2021-2032)
9.1.2. North America Reduced Fat Butter Revenue (USD Million) by Application (2021-2032)
9.1.3. North America Reduced Fat Butter Revenue (USD Million) by Product (2021-2032)
By Type
Salted
Unsalted
By Form
Spreadable
Non-spreadable
By Distribution Channel
Supermarkets/Hypermarkets
Convenience Stores
Online Retailers
Others
Chapter 10. Europe Reduced Fat Butter Analysis and Outlook
10.1. Europe Reduced Fat Butter Revenue (USD Million), by Segments (USD Million) (2021-2032)
10.1.1. Europe Reduced Fat Butter Revenue (USD Million) by Type (2021-2032)
10.1.2. Europe Reduced Fat Butter Revenue (USD Million) by Application (2021-2032)
10.1.3. Europe Reduced Fat Butter Revenue (USD Million) by Product (2021-2032)
By Type
Salted
Unsalted
By Form
Spreadable
Non-spreadable
By Distribution Channel
Supermarkets/Hypermarkets
Convenience Stores
Online Retailers
Others
Chapter 11. Asia Pacific Reduced Fat Butter Analysis and Outlook
11.1. Asia Pacific Reduced Fat Butter Revenue (USD Million), and Revenue (USD Million) by Segments (2021-2032)
11.1.1. Asia Pacific Reduced Fat Butter Revenue (USD Million) by Type (2021-2032)
11.1.2. Asia Pacific Reduced Fat Butter Revenue (USD Million) by Application (2021-2032)
11.1.3. Asia Pacific Reduced Fat Butter Revenue (USD Million) by Product (2021-2032)
By Type
Salted
Unsalted
By Form
Spreadable
Non-spreadable
By Distribution Channel
Supermarkets/Hypermarkets
Convenience Stores
Online Retailers
Others
Chapter 12. South America Reduced Fat Butter Analysis and Outlook
12.1. South America Reduced Fat Butter Revenue (USD Million), by Segments (2021-2032)
12.1.1. South America Reduced Fat Butter Revenue (USD Million) by Type (2021-2032)
12.1.2. South America Reduced Fat Butter Revenue (USD Million) by Application (2021-2032)
12.1.3. South America Reduced Fat Butter Revenue (USD Million) by Product (2021-2032)
By Type
Salted
Unsalted
By Form
Spreadable
Non-spreadable
By Distribution Channel
Supermarkets/Hypermarkets
Convenience Stores
Online Retailers
Others
Chapter 13. Middle East and Africa Reduced Fat Butter Analysis and Outlook
13.1. Middle East and Africa Reduced Fat Butter Revenue (USD Million), by Segments (2021-2032)
13.1.1. Middle East and Africa Reduced Fat Butter Revenue (USD Million) by Type (2021-2032)
13.1.2. Middle East and Africa Reduced Fat Butter Revenue (USD Million) by Application (2021-2032)
13.1.3. Middle East and Africa Reduced Fat Butter Revenue (USD Million) by Product (2021-2032)
By Type
Salted
Unsalted
By Form
Spreadable
Non-spreadable
By Distribution Channel
Supermarkets/Hypermarkets
Convenience Stores
Online Retailers
Others
Chapter 14. Reduced Fat Butter Company Profiles
14.1 Business Overview
14.2 Product Profiles
14.3 SWOT Profiles
14.5 Recent Developments
14.6 Financial Profile
List of Companies
Arla Foods amba
Finlandia Cheese Inc
GCMMF
Land O'Lakes Inc
Ornua Co-operative Ltd
Raisio Group plc
Rockview Farms
Saputo Inc
SAVENCIA SA
Unilever Plc
15. Methodology and Data Sources
15.1 Customization Offerings
15.2 Subscription Services
15.3 Related Reports
15.4 Publisher Expertise
LIST OF TABLES
Table 1 Market Segmentation Analysis
Table 2 Global Reduced Fat Butter Market Share of Leading Companies, 2023
Table 3 Product Offerings of Leading Companies
Table 4 Low Growth Scenario Forecasts
Table 5 Reference Case Growth Scenario
Table 6 High Growth Case Scenario
Table 7 Global Reduced Fat Butter Revenue (USD Million) And CAGR (%) By Type (2021-2032)
Table 8 Global Reduced Fat Butter Revenue (USD Million) And CAGR (%) By Application (2021-2032)
Table 9 Global Reduced Fat Butter Revenue (USD Million) And CAGR (%) By Product (2021-2032)
Table 10 Global Reduced Fat Butter Market Revenue (USD Million) By Regions (2021-2032)
Table 11 Global Reduced Fat Butter Market Share (%) By Regions (2021-2032)
Table 12 North America Reduced Fat Butter Revenue (USD Million) By Country (2021-2032)
Table 13 Europe Reduced Fat Butter Revenue (USD Million) By Country (2021-2032)
Table 14 Asia Pacific Reduced Fat Butter Revenue (USD Million) By Country (2021-2032)
Table 15 South America Reduced Fat Butter Revenue (USD Million) By Country (2021-2032)
Table 16 Middle East and Africa Reduced Fat Butter Revenue (USD Million) By Region (2021-2032)
Table 17 North America Reduced Fat Butter Revenue (USD Million) By Type (2021-2032)
Table 18 North America Reduced Fat Butter Revenue (USD Million) By Application (2021-2032)
Table 19 North America Reduced Fat Butter Revenue (USD Million) By Product (2021-2032)
Table 20 Europe Reduced Fat Butter Revenue (USD Million) By Type (2021-2032)
Table 21 Europe Reduced Fat Butter Revenue (USD Million) By Application (2021-2032)
Table 22 Europe Reduced Fat Butter Revenue (USD Million) By Product (2021-2032)
Table 23 Asia Pacific Reduced Fat Butter Revenue (USD Million) By Type (2021-2032)
Table 24 Asia Pacific Reduced Fat Butter Revenue (USD Million) By Application (2021-2032)
Table 25 Asia Pacific Reduced Fat Butter Revenue (USD Million) By Product (2021-2032)
Table 26 South America Reduced Fat Butter Revenue (USD Million) By Type (2021-2032)
Table 27 South America Reduced Fat Butter Revenue (USD Million) By Application (2021-2032)
Table 28 South America Reduced Fat Butter Revenue (USD Million) By Product (2021-2032)
Table 29 Middle East and Africa Reduced Fat Butter Revenue (USD Million) By Type (2021-2032)
Table 30 Middle East and Africa Reduced Fat Butter Revenue (USD Million) By Application (2021-2032)
Table 31 Middle East and Africa Reduced Fat Butter Revenue (USD Million) By Product (2021-2032)
LIST OF FIGURES
Figure 1. Market Scope
Figure 2. Pricing Forecasts Per Unit, 2023- 2032
Figure 3. Porter’s Five Forces
Figure 4. Global Reduced Fat Butter Market Revenue (USD Million) By Regions (2021-2032)
Figure 5. Global Reduced Fat Butter Market Share (%) By Regions (2023)
Figure 6. North America Reduced Fat Butter Revenue (USD Million) By Country (2021-2032)
Figure 7. United States Reduced Fat Butter Revenue (USD Million) By Country (2021-2032)
Figure 8. Canada Reduced Fat Butter Revenue (USD Million) By Country (2021-2032)
Figure 9. Mexico Reduced Fat Butter Revenue (USD Million) By Country (2021-2032)
Figure 10. Europe Reduced Fat Butter Revenue (USD Million) By Country (2021-2032)
Figure 11. Germany Reduced Fat Butter Revenue (USD Million) By Country (2021-2032)
Figure 12. France Reduced Fat Butter Revenue (USD Million) By Country (2021-2032)
Figure 13. United Kingdom Reduced Fat Butter Revenue (USD Million) By Country (2021-2032)
Figure 14. Spain Reduced Fat Butter Revenue (USD Million) By Country (2021-2032)
Figure 15. Italy Reduced Fat Butter Revenue (USD Million) By Country (2021-2032)
Figure 16. Russia Reduced Fat Butter Revenue (USD Million) By Country (2021-2032)
Figure 17. Rest of Europe Reduced Fat Butter Revenue (USD Million) By Country (2021-2032)
Figure 11. Asia Pacific Reduced Fat Butter Revenue (USD Million) By Country (2021-2032)
Figure 12. China Reduced Fat Butter Revenue (USD Million) By Country (2021-2032)
Figure 13. Japan Reduced Fat Butter Revenue (USD Million) By Country (2021-2032)
Figure 14. India Reduced Fat Butter Revenue (USD Million) By Country (2021-2032)
Figure 15. South Korea Reduced Fat Butter Revenue (USD Million) By Country (2021-2032)
Figure 16. Australia Reduced Fat Butter Revenue (USD Million) By Country (2021-2032)
Figure 17. South East Asia Reduced Fat Butter Revenue (USD Million) By Country (2021-2032)
Figure 18. South America Reduced Fat Butter Revenue (USD Million) By Country (2021-2032)
Figure 19. Brazil Reduced Fat Butter Revenue (USD Million) By Country (2021-2032)
Figure 20. Argentina Reduced Fat Butter Revenue (USD Million) By Country (2021-2032)
Figure 21. Rest of Asia Pacific Reduced Fat Butter Revenue (USD Million) By Country (2021-2032)
Figure 22. Middle East and Africa Reduced Fat Butter Revenue (USD Million) By Region (2021-2032)
Figure 23. Saudi Arabia Reduced Fat Butter Revenue (USD Million) By Region (2021-2032)
Figure 24. The UAE Reduced Fat Butter Revenue (USD Million) By Region (2021-2032)
Figure 25. Rest of Middle East Reduced Fat Butter Revenue (USD Million) By Region (2021-2032)
Figure 26. South Africa Reduced Fat Butter Revenue (USD Million) By Region (2021-2032)
Figure 27. Africa Reduced Fat Butter Revenue (USD Million) By Region (2021-2032)
Figure 28. North America Reduced Fat Butter Revenue (USD Million) By Type (2021-2032)
Figure 29. North America Reduced Fat Butter Revenue (USD Million) By Application (2021-2032)
Figure 30. North America Reduced Fat Butter Revenue (USD Million) By Product (2021-2032)
Figure 31. Europe Reduced Fat Butter Revenue (USD Million) By Type (2021-2032)
Figure 32. Europe Reduced Fat Butter Revenue (USD Million) By Application (2021-2032)
Figure 33. Europe Reduced Fat Butter Revenue (USD Million) By Product (2021-2032)
Figure 34. Asia Pacific Reduced Fat Butter Revenue (USD Million) By Type (2021-2032)
Figure 35. Asia Pacific Reduced Fat Butter Revenue (USD Million) By Application (2021-2032)
Figure 36. Asia Pacific Reduced Fat Butter Revenue (USD Million) By Product (2021-2032)
Figure 37. South America Reduced Fat Butter Revenue (USD Million) By Type (2021-2032)
Figure 38. South America Reduced Fat Butter Revenue (USD Million) By Application (2021-2032)
Figure 39. South America Reduced Fat Butter Revenue (USD Million) By Product (2021-2032)
Figure 40. Middle East and Africa Reduced Fat Butter Revenue (USD Million) By Type (2021-2032)
Figure 41. Middle East and Africa Reduced Fat Butter Revenue (USD Million) By Application (2021-2032)
Figure 42. Middle East and Africa Reduced Fat Butter Revenue (USD Million) By Product (2021-2032)
By Type
Salted
Unsalted
By Form
Spreadable
Non-spreadable
By Distribution Channel
Supermarkets/Hypermarkets
Convenience Stores
Online Retailers
Others
Countries Analyzed
North America (US, Canada, Mexico)
Europe (Germany, UK, France, Spain, Italy, Russia, Rest of Europe)
Asia Pacific (China, India, Japan, South Korea, Australia, South East Asia, Rest of Asia)
South America (Brazil, Argentina, Rest of South America)
Middle East and Africa (Saudi Arabia, UAE, Rest of Middle East, South Africa, Egypt, Rest of Africa)
