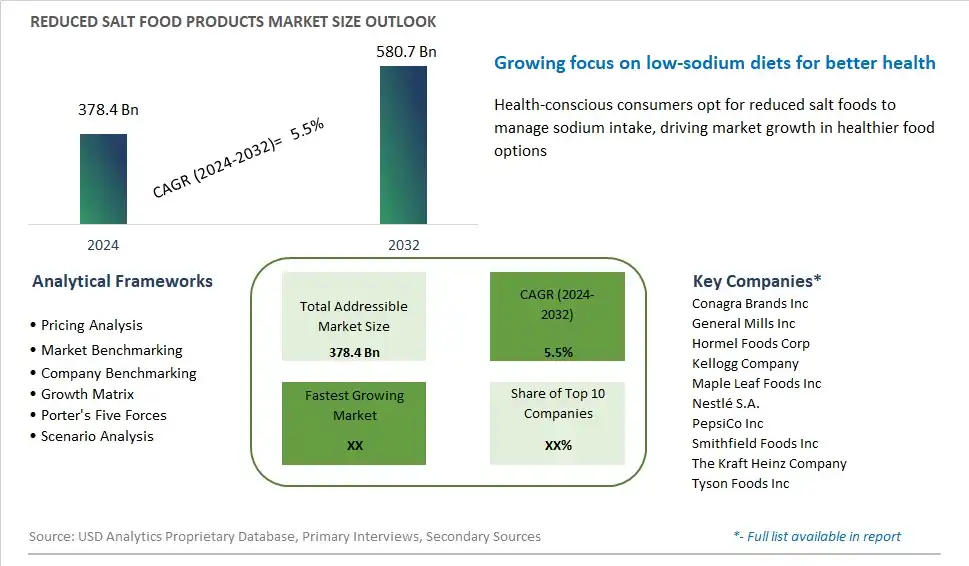
Global Reduced Salt Food Products Market Size is valued at $378.4 Billion in 2024 and is forecast to register a growth rate (CAGR) of 5.5% to reach $580.7 Billion by 2032.
The global Reduced Salt Food Products Market Comprehensive Study analyzes and forecasts the market size across 6 regions and 24 countries for diverse segments -By Type (Snacks, Meat, Poultry & Seafood, Others), By Distribution Channel (Offline, Online)
An Introduction to Reduced Salt Food Products Market
In response to growing health concerns regarding excessive salt consumption, the reduced salt food products market has witnessed significant expansion in 2024. Manufacturers are increasingly prioritizing the development of innovative formulations that retain flavor while reducing sodium content. This market shift is driven by consumer demand for healthier options without compromising taste or quality. With a focus on catering to health-conscious consumers, food companies are leveraging advanced technologies and natural flavor enhancers to create a diverse range of reduced salt alternatives across various food categories.
Reduced Salt Food Products Competitive Landscape
The market report analyses the leading companies in the industry including Conagra Brands Inc, General Mills Inc, Hormel Foods Corp, Kellogg Company, Maple Leaf Foods Inc, Nestlé S.A., PepsiCo Inc, Smithfield Foods Inc, The Kraft Heinz Company, Tyson Foods Inc, and Others.
Reduced Salt Food Products Market Dynamics
Reduced Salt Food Products Market Trend: Growing Health Consciousness and Dietary Awareness
The market for reduced salt food products is experiencing a prominent trend towards growing health consciousness and dietary awareness among consumers. This trend is driven by increasing awareness of the health risks associated with excessive salt consumption, such as hypertension and cardiovascular diseases. As consumers become more educated about the importance of reducing sodium intake for overall health and well-being, there is a growing demand for food products with lower salt content. Reduced salt food products cater to consumers' desire for healthier options without compromising on taste, flavor, or texture, making them increasingly popular among individuals seeking to adopt a more balanced and nutritious diet.
Market Driver: Regulatory Initiatives and Public Health Campaigns
The rapid expansion of the reduced salt food products market is primarily driven by regulatory initiatives and public health campaigns aimed at reducing sodium intake at the population level. Governments and health organizations worldwide have implemented policies and guidelines to encourage food manufacturers to reduce the salt content of their products and provide consumers with healthier choices. Additionally, public health campaigns raise awareness about the health risks associated with high salt consumption and educate consumers about the benefits of choosing reduced salt alternatives. As a result, food manufacturers are under increasing pressure to reformulate their products to meet regulatory requirements and consumer demand for lower salt options, driving the growth of the reduced salt food products market.
Market Opportunity: Innovation in Flavor Enhancement and Product Development
One significant opportunity within the reduced salt food products market lies in innovation in flavor enhancement and product development to meet consumer preferences for healthier yet flavorful options. Brands can differentiate themselves by offering reduced salt food products that incorporate alternative flavoring ingredients, such as herbs, spices, citrus zest, and natural flavor extracts, to enhance taste and palatability without the need for excessive salt. Moreover, exploring advanced food processing technologies, such as umami-enhancing techniques and sodium reduction solutions, can help manufacturers develop products that deliver satisfying flavor experiences while minimizing sodium content. Furthermore, leveraging consumer demand for clean label and transparent ingredients can create opportunities for brands to market reduced salt food products as natural, wholesome, and health-conscious choices. Collaborations with chefs, nutritionists, and food scientists can drive product innovation and ensure that reduced salt food products meet consumers' expectations for delicious, nutritious, and satisfying eating experiences. As the market for reduced salt food products continues to evolve, brands that prioritize innovation, taste, and healthfulness are well-positioned to capitalize on the growing demand for healthier food options.
Reduced Salt Food Products Market Share Analysis: Snacks held the dominant market share in 2024
Within the segmented landscape of the Reduced Salt Food Products Market categorized by Type, the Snacks category is the largest and most prevalent segment, driven by several key factors. Snacks represent a broad and diverse category of reduced-salt food products, encompassing a wide range of popular items such as chips, crackers, pretzels, and popcorn. As consumers increasingly prioritize health and wellness, the demand for reduced-salt snack options continues to rise. Snacks are often consumed between meals or as convenient on-the-go snacks, making them a prime target for manufacturers looking to offer healthier alternatives. Further, the innovation and creativity in the snack industry have led to the development of flavorful reduced-salt options that satisfy consumer cravings without compromising on taste. As consumers become more conscious of their sodium intake, the dominance of the Snacks segment in the Reduced Salt Food Products Market is expected to persist, driving overall market sales and growth.
Reduced Salt Food Products Market Share Analysis: Online market is poised to register the fastest growth rae over the forecast period to 2032
In the evolving landscape of the Reduced Salt Food Products Market segmented by Distribution Channel, the Online segment is the fastest-growing player, driven by several key factors. Online distribution channels offer consumers the convenience of purchasing reduced-salt food products from the comfort of their homes, eliminating the need for physical store visits. Further, the proliferation of e-commerce platforms and digital marketplaces has expanded the reach of reduced-salt food products to a broader audience, including consumers in remote areas. Additionally, the COVID-19 pandemic has accelerated the adoption of online shopping habits, as consumers prioritize safety and convenience. As health-conscious consumers seek convenient yet nutritious options to manage their sodium intake, the Online Distribution channel is poised to sustain its rapid growth trajectory in the Reduced Salt Food Products Market, reshaping the way consumers access and purchase healthier food options.
Reduced Salt Food Products Market Segmentation
By Type
Snacks
Meat, Poultry & Seafood
Others
By Distribution Channel
Offline
Online
Countries Analyzed
North America (US, Canada, Mexico)
Europe (Germany, UK, France, Spain, Italy, Russia, Rest of Europe)
Asia Pacific (China, India, Japan, South Korea, Australia, South East Asia, Rest of Asia)
South America (Brazil, Argentina, Rest of South America)
Middle East and Africa (Saudi Arabia, UAE, Rest of Middle East, South Africa, Egypt, Rest of Africa)
Reduced Salt Food Products Companies Profiled in the Study
Conagra Brands Inc
General Mills Inc
Hormel Foods Corp
Kellogg Company
Maple Leaf Foods Inc
Nestlé S.A.
PepsiCo Inc
Smithfield Foods Inc
The Kraft Heinz Company
Tyson Foods Inc
*- List Not Exhaustive
Chapter 1. TABLE OF CONTENTS
Chapter 2. Introduction to Reduced Salt Food Products Market
2.1. Market Overview
2.2. Key Statistics and Report Highlights
2.3. Scope of the Comprehensive Study
2.3.1. Market Definition
2.3.2 Countries and Regions Covered
2.3.3 Research Objective
2.3.4 Units, Currency, and Conversions
2.3.5 Industry Value Chain
2.4. Key Market Segments
2.5. Key Companies
2.6. Study Period
Chapter 3. Strategic Analysis Review
3.1. Reduced Salt Food Products Pricing Analysis and Forecast
3.2. Porter’s Five Forces
3.3. Market Ecosystem
3.4. SWOT Analysis
3.5. Regulatory Scenario
3.3. Effects of Inflation, Russia-Ukraine War, moderating economic growth, and other macroeconomic factors
Chapter 4. Competitive Landscape
4.1. Market Share Analysis
4.1.1. Global Reduced Salt Food Products Market Share by Company, 2023
4.1.2. Product Offerings of Leading Reduced Salt Food Products Companies
4.2. Market Entropy
4.2.1. New Product Launches in the Industry
4.2.2. Mergers, Acquisitions, Joint ventures, and Partnerships
4.3. Key Strategies and Best Practices
Chapter 5. Global Market Projections: Best, Reference, and Low Case Scenarios
5.1. Growth Analysis- Case Scenario Definitions
5.2. Low Growth Case Scenario Forecasts
5.3. Reference Growth Case Scenario Forecasts
5.4. High Growth Case Scenario Forecasts
Chapter 6. Market Dynamics
6.1. Reduced Salt Food Products Market Drivers
6.2. Reduced Salt Food Products Market Challenges
6.6. Reduced Salt Food Products Market Opportunities
6.4. Reduced Salt Food Products Market Trends
Chapter 7. Global Reduced Salt Food Products Market Outlook Trends
7.1. Global Reduced Salt Food Products Revenue (USD Million) and CAGR (%) by Type (2021-2032)
7.2. Global Reduced Salt Food Products Revenue (USD Million) and CAGR (%) by Application (2021-2032)
7.3. Global Reduced Salt Food Products Revenue (USD Million) and CAGR (%) by Product (2021-2032)
By Type
Snacks
Meat, Poultry & Seafood
Others
By Distribution Channel
Offline
Online
Chapter 8. Global Reduced Salt Food Products Regional Analysis and Outlook
8.1. Global Reduced Salt Food Products Revenue (USD Million) By Regions (2021- 2032)
8.2. North America Reduced Salt Food Products Revenue (USD Million) by Country (2021-2032)
8.2.1. United States Reduced Salt Food Products Regional Analysis and Outlook
8.2.2. Canada Reduced Salt Food Products Regional Analysis and Outlook
8.2.3. Mexico Reduced Salt Food Products Regional Analysis and Outlook
8.3. Europe Reduced Salt Food Products Revenue (USD Million), by Country (2021-2032)
8.3.1. Germany Reduced Salt Food Products Regional Analysis and Outlook
8.3.2. France Reduced Salt Food Products Regional Analysis and Outlook
8.3.3. United Kingdom Reduced Salt Food Products Regional Analysis and Outlook
8.3.4. Spain Reduced Salt Food Products Regional Analysis and Outlook
8.3.5. Italy Reduced Salt Food Products Regional Analysis and Outlook
8.3.6. Russia Reduced Salt Food Products Regional Analysis and Outlook
8.3.7. Rest of Europe Reduced Salt Food Products Regional Analysis and Outlook
8.4. Asia Pacific Reduced Salt Food Products Revenue (USD Million) by Country (2021-2032)
8.4.1. China Reduced Salt Food Products Regional Analysis and Outlook
8.4.2. Japan Reduced Salt Food Products Regional Analysis and Outlook
8.4.3. India Reduced Salt Food Products Regional Analysis and Outlook
8.4.4. South Korea Reduced Salt Food Products Regional Analysis and Outlook
8.4.5. Australia Reduced Salt Food Products Regional Analysis and Outlook
8.4.6. South East Asia Reduced Salt Food Products Regional Analysis and Outlook
8.4.7. Rest of Asia Pacific Reduced Salt Food Products Regional Analysis and Outlook
8.5. South America Reduced Salt Food Products Revenue (USD Million), by Country (2021-2032)
8.5.1. Brazil Reduced Salt Food Products Regional Analysis and Outlook
8.5.2. Argentina Reduced Salt Food Products Regional Analysis and Outlook
8.5.3. Rest of South America Reduced Salt Food Products Regional Analysis and Outlook
8.6. Middle East and Africa Reduced Salt Food Products Revenue (USD Million) by Country (2021-2032)
8.6.1. Middle East Reduced Salt Food Products Regional Analysis and Outlook
8.6.2. Africa Reduced Salt Food Products Regional Analysis and Outlook
Chapter 9. North America Reduced Salt Food Products Analysis and Outlook
9.1. North America Reduced Salt Food Products Revenue (USD Million) by Segments (2021-2032)
9.1.1. North America Reduced Salt Food Products Revenue (USD Million) by Type (2021-2032)
9.1.2. North America Reduced Salt Food Products Revenue (USD Million) by Application (2021-2032)
9.1.3. North America Reduced Salt Food Products Revenue (USD Million) by Product (2021-2032)
By Type
Snacks
Meat, Poultry & Seafood
Others
By Distribution Channel
Offline
Online
Chapter 10. Europe Reduced Salt Food Products Analysis and Outlook
10.1. Europe Reduced Salt Food Products Revenue (USD Million), by Segments (USD Million) (2021-2032)
10.1.1. Europe Reduced Salt Food Products Revenue (USD Million) by Type (2021-2032)
10.1.2. Europe Reduced Salt Food Products Revenue (USD Million) by Application (2021-2032)
10.1.3. Europe Reduced Salt Food Products Revenue (USD Million) by Product (2021-2032)
By Type
Snacks
Meat, Poultry & Seafood
Others
By Distribution Channel
Offline
Online
Chapter 11. Asia Pacific Reduced Salt Food Products Analysis and Outlook
11.1. Asia Pacific Reduced Salt Food Products Revenue (USD Million), and Revenue (USD Million) by Segments (2021-2032)
11.1.1. Asia Pacific Reduced Salt Food Products Revenue (USD Million) by Type (2021-2032)
11.1.2. Asia Pacific Reduced Salt Food Products Revenue (USD Million) by Application (2021-2032)
11.1.3. Asia Pacific Reduced Salt Food Products Revenue (USD Million) by Product (2021-2032)
By Type
Snacks
Meat, Poultry & Seafood
Others
By Distribution Channel
Offline
Online
Chapter 12. South America Reduced Salt Food Products Analysis and Outlook
12.1. South America Reduced Salt Food Products Revenue (USD Million), by Segments (2021-2032)
12.1.1. South America Reduced Salt Food Products Revenue (USD Million) by Type (2021-2032)
12.1.2. South America Reduced Salt Food Products Revenue (USD Million) by Application (2021-2032)
12.1.3. South America Reduced Salt Food Products Revenue (USD Million) by Product (2021-2032)
By Type
Snacks
Meat, Poultry & Seafood
Others
By Distribution Channel
Offline
Online
Chapter 13. Middle East and Africa Reduced Salt Food Products Analysis and Outlook
13.1. Middle East and Africa Reduced Salt Food Products Revenue (USD Million), by Segments (2021-2032)
13.1.1. Middle East and Africa Reduced Salt Food Products Revenue (USD Million) by Type (2021-2032)
13.1.2. Middle East and Africa Reduced Salt Food Products Revenue (USD Million) by Application (2021-2032)
13.1.3. Middle East and Africa Reduced Salt Food Products Revenue (USD Million) by Product (2021-2032)
By Type
Snacks
Meat, Poultry & Seafood
Others
By Distribution Channel
Offline
Online
Chapter 14. Reduced Salt Food Products Company Profiles
14.1 Business Overview
14.2 Product Profiles
14.3 SWOT Profiles
14.5 Recent Developments
14.6 Financial Profile
List of Companies
Conagra Brands Inc
General Mills Inc
Hormel Foods Corp
Kellogg Company
Maple Leaf Foods Inc
Nestlé S.A.
PepsiCo Inc
Smithfield Foods Inc
The Kraft Heinz Company
Tyson Foods Inc
15. Methodology and Data Sources
15.1 Customization Offerings
15.2 Subscription Services
15.3 Related Reports
15.4 Publisher Expertise
LIST OF TABLES
Table 1 Market Segmentation Analysis
Table 2 Global Reduced Salt Food Products Market Share of Leading Companies, 2023
Table 3 Product Offerings of Leading Companies
Table 4 Low Growth Scenario Forecasts
Table 5 Reference Case Growth Scenario
Table 6 High Growth Case Scenario
Table 7 Global Reduced Salt Food Products Revenue (USD Million) And CAGR (%) By Type (2021-2032)
Table 8 Global Reduced Salt Food Products Revenue (USD Million) And CAGR (%) By Application (2021-2032)
Table 9 Global Reduced Salt Food Products Revenue (USD Million) And CAGR (%) By Product (2021-2032)
Table 10 Global Reduced Salt Food Products Market Revenue (USD Million) By Regions (2021-2032)
Table 11 Global Reduced Salt Food Products Market Share (%) By Regions (2021-2032)
Table 12 North America Reduced Salt Food Products Revenue (USD Million) By Country (2021-2032)
Table 13 Europe Reduced Salt Food Products Revenue (USD Million) By Country (2021-2032)
Table 14 Asia Pacific Reduced Salt Food Products Revenue (USD Million) By Country (2021-2032)
Table 15 South America Reduced Salt Food Products Revenue (USD Million) By Country (2021-2032)
Table 16 Middle East and Africa Reduced Salt Food Products Revenue (USD Million) By Region (2021-2032)
Table 17 North America Reduced Salt Food Products Revenue (USD Million) By Type (2021-2032)
Table 18 North America Reduced Salt Food Products Revenue (USD Million) By Application (2021-2032)
Table 19 North America Reduced Salt Food Products Revenue (USD Million) By Product (2021-2032)
Table 20 Europe Reduced Salt Food Products Revenue (USD Million) By Type (2021-2032)
Table 21 Europe Reduced Salt Food Products Revenue (USD Million) By Application (2021-2032)
Table 22 Europe Reduced Salt Food Products Revenue (USD Million) By Product (2021-2032)
Table 23 Asia Pacific Reduced Salt Food Products Revenue (USD Million) By Type (2021-2032)
Table 24 Asia Pacific Reduced Salt Food Products Revenue (USD Million) By Application (2021-2032)
Table 25 Asia Pacific Reduced Salt Food Products Revenue (USD Million) By Product (2021-2032)
Table 26 South America Reduced Salt Food Products Revenue (USD Million) By Type (2021-2032)
Table 27 South America Reduced Salt Food Products Revenue (USD Million) By Application (2021-2032)
Table 28 South America Reduced Salt Food Products Revenue (USD Million) By Product (2021-2032)
Table 29 Middle East and Africa Reduced Salt Food Products Revenue (USD Million) By Type (2021-2032)
Table 30 Middle East and Africa Reduced Salt Food Products Revenue (USD Million) By Application (2021-2032)
Table 31 Middle East and Africa Reduced Salt Food Products Revenue (USD Million) By Product (2021-2032)
LIST OF FIGURES
Figure 1. Market Scope
Figure 2. Pricing Forecasts Per Unit, 2023- 2032
Figure 3. Porter’s Five Forces
Figure 4. Global Reduced Salt Food Products Market Revenue (USD Million) By Regions (2021-2032)
Figure 5. Global Reduced Salt Food Products Market Share (%) By Regions (2023)
Figure 6. North America Reduced Salt Food Products Revenue (USD Million) By Country (2021-2032)
Figure 7. United States Reduced Salt Food Products Revenue (USD Million) By Country (2021-2032)
Figure 8. Canada Reduced Salt Food Products Revenue (USD Million) By Country (2021-2032)
Figure 9. Mexico Reduced Salt Food Products Revenue (USD Million) By Country (2021-2032)
Figure 10. Europe Reduced Salt Food Products Revenue (USD Million) By Country (2021-2032)
Figure 11. Germany Reduced Salt Food Products Revenue (USD Million) By Country (2021-2032)
Figure 12. France Reduced Salt Food Products Revenue (USD Million) By Country (2021-2032)
Figure 13. United Kingdom Reduced Salt Food Products Revenue (USD Million) By Country (2021-2032)
Figure 14. Spain Reduced Salt Food Products Revenue (USD Million) By Country (2021-2032)
Figure 15. Italy Reduced Salt Food Products Revenue (USD Million) By Country (2021-2032)
Figure 16. Russia Reduced Salt Food Products Revenue (USD Million) By Country (2021-2032)
Figure 17. Rest of Europe Reduced Salt Food Products Revenue (USD Million) By Country (2021-2032)
Figure 11. Asia Pacific Reduced Salt Food Products Revenue (USD Million) By Country (2021-2032)
Figure 12. China Reduced Salt Food Products Revenue (USD Million) By Country (2021-2032)
Figure 13. Japan Reduced Salt Food Products Revenue (USD Million) By Country (2021-2032)
Figure 14. India Reduced Salt Food Products Revenue (USD Million) By Country (2021-2032)
Figure 15. South Korea Reduced Salt Food Products Revenue (USD Million) By Country (2021-2032)
Figure 16. Australia Reduced Salt Food Products Revenue (USD Million) By Country (2021-2032)
Figure 17. South East Asia Reduced Salt Food Products Revenue (USD Million) By Country (2021-2032)
Figure 18. South America Reduced Salt Food Products Revenue (USD Million) By Country (2021-2032)
Figure 19. Brazil Reduced Salt Food Products Revenue (USD Million) By Country (2021-2032)
Figure 20. Argentina Reduced Salt Food Products Revenue (USD Million) By Country (2021-2032)
Figure 21. Rest of Asia Pacific Reduced Salt Food Products Revenue (USD Million) By Country (2021-2032)
Figure 22. Middle East and Africa Reduced Salt Food Products Revenue (USD Million) By Region (2021-2032)
Figure 23. Saudi Arabia Reduced Salt Food Products Revenue (USD Million) By Region (2021-2032)
Figure 24. The UAE Reduced Salt Food Products Revenue (USD Million) By Region (2021-2032)
Figure 25. Rest of Middle East Reduced Salt Food Products Revenue (USD Million) By Region (2021-2032)
Figure 26. South Africa Reduced Salt Food Products Revenue (USD Million) By Region (2021-2032)
Figure 27. Africa Reduced Salt Food Products Revenue (USD Million) By Region (2021-2032)
Figure 28. North America Reduced Salt Food Products Revenue (USD Million) By Type (2021-2032)
Figure 29. North America Reduced Salt Food Products Revenue (USD Million) By Application (2021-2032)
Figure 30. North America Reduced Salt Food Products Revenue (USD Million) By Product (2021-2032)
Figure 31. Europe Reduced Salt Food Products Revenue (USD Million) By Type (2021-2032)
Figure 32. Europe Reduced Salt Food Products Revenue (USD Million) By Application (2021-2032)
Figure 33. Europe Reduced Salt Food Products Revenue (USD Million) By Product (2021-2032)
Figure 34. Asia Pacific Reduced Salt Food Products Revenue (USD Million) By Type (2021-2032)
Figure 35. Asia Pacific Reduced Salt Food Products Revenue (USD Million) By Application (2021-2032)
Figure 36. Asia Pacific Reduced Salt Food Products Revenue (USD Million) By Product (2021-2032)
Figure 37. South America Reduced Salt Food Products Revenue (USD Million) By Type (2021-2032)
Figure 38. South America Reduced Salt Food Products Revenue (USD Million) By Application (2021-2032)
Figure 39. South America Reduced Salt Food Products Revenue (USD Million) By Product (2021-2032)
Figure 40. Middle East and Africa Reduced Salt Food Products Revenue (USD Million) By Type (2021-2032)
Figure 41. Middle East and Africa Reduced Salt Food Products Revenue (USD Million) By Application (2021-2032)
Figure 42. Middle East and Africa Reduced Salt Food Products Revenue (USD Million) By Product (2021-2032)
By Type
Snacks
Meat, Poultry & Seafood
Others
By Distribution Channel
Offline
Online
Countries Analyzed
North America (US, Canada, Mexico)
Europe (Germany, UK, France, Spain, Italy, Russia, Rest of Europe)
Asia Pacific (China, India, Japan, South Korea, Australia, South East Asia, Rest of Asia)
South America (Brazil, Argentina, Rest of South America)
Middle East and Africa (Saudi Arabia, UAE, Rest of Middle East, South Africa, Egypt, Rest of Africa)
