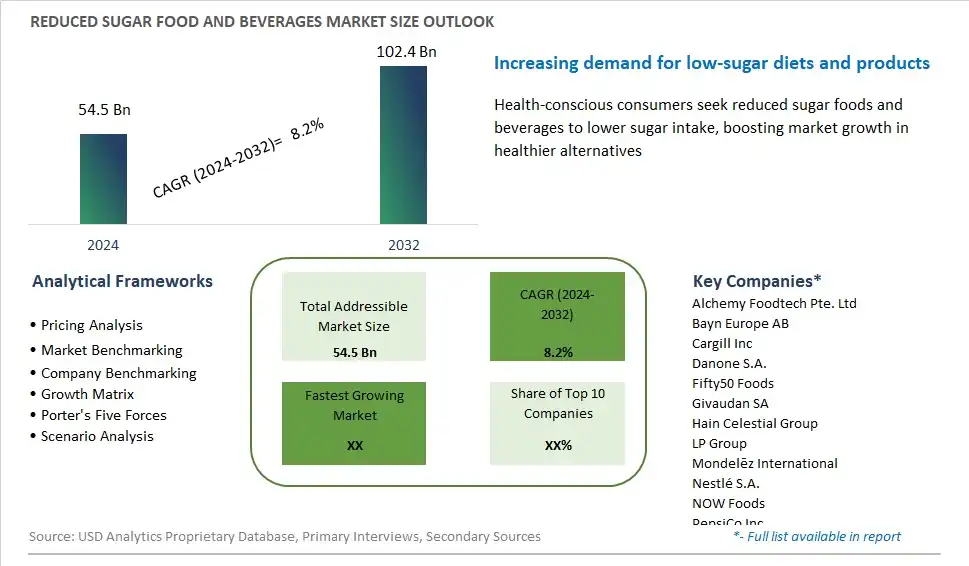
Global Reduced Sugar Food and Beverages Market Size is valued at $54.5 Billion in 2024 and is forecast to register a growth rate (CAGR) of 8.2% to reach $102.4 Billion by 2032.
The global Reduced Sugar Food and Beverages Market Comprehensive Study analyzes and forecasts the market size across 6 regions and 24 countries for diverse segments -By Product (Bakery, Beverages, Confectionery, Dairy, Snacks, Others), By Distribution Channel (Supermarkets/Hypermarkets, Convenience Stores, Online, Others)
An Introduction to Reduced Sugar Food and Beverages Market
The reduced sugar food and beverages market has experienced a surge in growth as consumers become more health-conscious and seek alternatives to high-sugar products. In 2024, there is a notable emphasis on reformulating traditional recipes to reduce sugar content without sacrificing taste or texture. This trend is particularly evident in categories such as beverages, snacks, and confectionery, where manufacturers are innovating with low-calorie sweeteners and natural sugar substitutes. As regulatory pressures and consumer preferences converge, companies are investing in research and development to offer a wide array of reduced sugar options that appeal to the evolving dietary preferences of consumers.
Reduced Sugar Food and Beverages Competitive Landscape
The market report analyses the leading companies in the industry including Alchemy Foodtech Pte. Ltd, Bayn Europe AB, Cargill Inc, Danone S.A., Fifty50 Foods, Givaudan SA, Hain Celestial Group, LP Group, MondelÄ“z International, Nestlé S.A., NOW Foods, PepsiCo Inc, The Coca-Cola Company, The J. M. Smucker Company, Unilever plc, and Others.
Reduced Sugar Food and Beverages Market Dynamics
Reduced Sugar Food and Beverages Market Trend: Health-Conscious Consumer Preferences and Dietary Awareness
The market for reduced sugar food and beverages is witnessing a prominent trend towards health-conscious consumer preferences and increased dietary awareness. As consumers become more educated about the adverse health effects of excessive sugar consumption, such as obesity, diabetes, and other metabolic disorders, there is a growing demand for products with lower sugar content. This trend is driven by a desire among individuals to make healthier choices and adopt a balanced diet that supports overall well-being. Reduced sugar food and beverage options align with consumers' health goals, making them increasingly popular choices among those seeking to reduce their sugar intake without sacrificing taste or enjoyment.
Market Driver: Regulatory Policies and Public Health Initiatives
The rapid expansion of the reduced sugar food and beverages market is primarily driven by regulatory policies and public health initiatives aimed at addressing the global rise in sugar-related health concerns. Governments and health organizations worldwide have implemented measures to reduce sugar consumption, such as sugar taxes, front-of-pack labeling regulations, and public awareness campaigns. These initiatives raise awareness about the health risks associated with high sugar intake and encourage consumers to make healthier food and beverage choices. As a result, food and beverage manufacturers are under increasing pressure to reformulate their products to reduce sugar content, driving innovation and growth in the reduced sugar market segment.
Market Opportunity: Innovation in Flavor Enhancement and Product Development
One significant opportunity within the reduced sugar food and beverages market lies in innovation in flavor enhancement and product development to meet consumer preferences for healthier yet flavorful options. Brands can differentiate themselves by offering reduced sugar products that utilize alternative sweeteners, natural flavorings, and innovative food technologies to maintain taste and palatability while reducing sugar content. Exploring sugar alternatives such as stevia, monk fruit extract, and erythritol can help manufacturers develop products that deliver sweetness without the negative health effects associated with sugar. Moreover, leveraging consumer demand for clean label and transparent ingredients can create opportunities for brands to market reduced sugar products as natural, wholesome, and health-conscious choices. Collaborations with food scientists, flavor experts, and nutritionists can drive product innovation and ensure that reduced sugar food and beverage offerings meet consumers' expectations for delicious, nutritious, and satisfying eating experiences. As the market for reduced sugar food and beverages continues to evolve, brands that prioritize innovation, taste, and healthfulness are well-positioned to capitalize on the growing demand for healthier alternatives to traditional high-sugar products.
Reduced Sugar Food and Beverages Market Share Analysis: Beverages held the dominant market share in 2024
In the segmented landscape of the Reduced Sugar Food and Beverages Market categorized by Product, Beverages emerge as the largest and most prevalent segment, driven by several key factors. Reduced sugar beverages encompass a wide range of products, including juices, soft drinks, teas, and flavored waters, offering consumers a healthier alternative to traditional sugary drinks. As consumers become increasingly health-conscious and seek to reduce their sugar intake, the demand for reduced sugar beverages has surged. Manufacturers have responded by innovating and formulating beverages with lower sugar content while maintaining flavor and sweetness through natural and artificial sweeteners. Additionally, the convenience and on-the-go nature of beverages make them a popular choice for consumers seeking quick and refreshing options. With growing concerns about obesity and related health issues, the dominance of Beverages in the Reduced Sugar Food and Beverages Market is expected to persist, driving overall market sales and growth.
Reduced Sugar Food and Beverages Market Share Analysis: Online market is poised to register the fastest growth rae over the forecast period to 2032
In the evolving landscape of the Reduced Sugar Food and Beverages Market segmented by Distribution Channel, the Online segment is the fastest-growing player, propelled by several key factors. Online distribution channels offer consumers the convenience of purchasing reduced sugar food and beverages from the comfort of their homes, eliminating the need for physical store visits. Further, the proliferation of e-commerce platforms and digital marketplaces has expanded the reach of reduced sugar products to a broader audience, including health-conscious consumers seeking convenient yet nutritious options. Additionally, the COVID-19 pandemic has accelerated the adoption of online shopping habits, as consumers prioritize safety and convenience. As more individuals turn to online platforms for their grocery needs and seek healthier alternatives to traditional sugary products, the Online Distribution channel is poised to sustain its rapid growth trajectory in the Reduced Sugar Food and Beverages Market, reshaping the way consumers access and purchase healthier food options.
Reduced Sugar Food and Beverages Market Segmentation
By Product
Bakery
Beverages
Confectionery
Dairy
Snacks
Others
By Distribution Channel
Supermarkets/Hypermarkets
Convenience Stores
Online
Others
Countries Analyzed
North America (US, Canada, Mexico)
Europe (Germany, UK, France, Spain, Italy, Russia, Rest of Europe)
Asia Pacific (China, India, Japan, South Korea, Australia, South East Asia, Rest of Asia)
South America (Brazil, Argentina, Rest of South America)
Middle East and Africa (Saudi Arabia, UAE, Rest of Middle East, South Africa, Egypt, Rest of Africa)
Reduced Sugar Food and Beverages Companies Profiled in the Study
Alchemy Foodtech Pte. Ltd
Bayn Europe AB
Cargill Inc
Danone S.A.
Fifty50 Foods
Givaudan SA
Hain Celestial Group
LP Group
Mondelēz International
Nestlé S.A.
NOW Foods
PepsiCo Inc
The Coca-Cola Company
The J. M. Smucker Company
Unilever plc
*- List Not Exhaustive
Chapter 1. TABLE OF CONTENTS
Chapter 2. Introduction to Reduced Sugar Food and Beverages Market
2.1. Market Overview
2.2. Key Statistics and Report Highlights
2.3. Scope of the Comprehensive Study
2.3.1. Market Definition
2.3.2 Countries and Regions Covered
2.3.3 Research Objective
2.3.4 Units, Currency, and Conversions
2.3.5 Industry Value Chain
2.4. Key Market Segments
2.5. Key Companies
2.6. Study Period
Chapter 3. Strategic Analysis Review
3.1. Reduced Sugar Food and Beverages Pricing Analysis and Forecast
3.2. Porter’s Five Forces
3.3. Market Ecosystem
3.4. SWOT Analysis
3.5. Regulatory Scenario
3.3. Effects of Inflation, Russia-Ukraine War, moderating economic growth, and other macroeconomic factors
Chapter 4. Competitive Landscape
4.1. Market Share Analysis
4.1.1. Global Reduced Sugar Food and Beverages Market Share by Company, 2023
4.1.2. Product Offerings of Leading Reduced Sugar Food and Beverages Companies
4.2. Market Entropy
4.2.1. New Product Launches in the Industry
4.2.2. Mergers, Acquisitions, Joint ventures, and Partnerships
4.3. Key Strategies and Best Practices
Chapter 5. Global Market Projections: Best, Reference, and Low Case Scenarios
5.1. Growth Analysis- Case Scenario Definitions
5.2. Low Growth Case Scenario Forecasts
5.3. Reference Growth Case Scenario Forecasts
5.4. High Growth Case Scenario Forecasts
Chapter 6. Market Dynamics
6.1. Reduced Sugar Food and Beverages Market Drivers
6.2. Reduced Sugar Food and Beverages Market Challenges
6.6. Reduced Sugar Food and Beverages Market Opportunities
6.4. Reduced Sugar Food and Beverages Market Trends
Chapter 7. Global Reduced Sugar Food and Beverages Market Outlook Trends
7.1. Global Reduced Sugar Food and Beverages Revenue (USD Million) and CAGR (%) by Type (2021-2032)
7.2. Global Reduced Sugar Food and Beverages Revenue (USD Million) and CAGR (%) by Application (2021-2032)
7.3. Global Reduced Sugar Food and Beverages Revenue (USD Million) and CAGR (%) by Product (2021-2032)
By Product
Bakery
Beverages
Confectionery
Dairy
Snacks
Others
By Distribution Channel
Supermarkets/Hypermarkets
Convenience Stores
Online
Others
Chapter 8. Global Reduced Sugar Food and Beverages Regional Analysis and Outlook
8.1. Global Reduced Sugar Food and Beverages Revenue (USD Million) By Regions (2021- 2032)
8.2. North America Reduced Sugar Food and Beverages Revenue (USD Million) by Country (2021-2032)
8.2.1. United States Reduced Sugar Food and Beverages Regional Analysis and Outlook
8.2.2. Canada Reduced Sugar Food and Beverages Regional Analysis and Outlook
8.2.3. Mexico Reduced Sugar Food and Beverages Regional Analysis and Outlook
8.3. Europe Reduced Sugar Food and Beverages Revenue (USD Million), by Country (2021-2032)
8.3.1. Germany Reduced Sugar Food and Beverages Regional Analysis and Outlook
8.3.2. France Reduced Sugar Food and Beverages Regional Analysis and Outlook
8.3.3. United Kingdom Reduced Sugar Food and Beverages Regional Analysis and Outlook
8.3.4. Spain Reduced Sugar Food and Beverages Regional Analysis and Outlook
8.3.5. Italy Reduced Sugar Food and Beverages Regional Analysis and Outlook
8.3.6. Russia Reduced Sugar Food and Beverages Regional Analysis and Outlook
8.3.7. Rest of Europe Reduced Sugar Food and Beverages Regional Analysis and Outlook
8.4. Asia Pacific Reduced Sugar Food and Beverages Revenue (USD Million) by Country (2021-2032)
8.4.1. China Reduced Sugar Food and Beverages Regional Analysis and Outlook
8.4.2. Japan Reduced Sugar Food and Beverages Regional Analysis and Outlook
8.4.3. India Reduced Sugar Food and Beverages Regional Analysis and Outlook
8.4.4. South Korea Reduced Sugar Food and Beverages Regional Analysis and Outlook
8.4.5. Australia Reduced Sugar Food and Beverages Regional Analysis and Outlook
8.4.6. South East Asia Reduced Sugar Food and Beverages Regional Analysis and Outlook
8.4.7. Rest of Asia Pacific Reduced Sugar Food and Beverages Regional Analysis and Outlook
8.5. South America Reduced Sugar Food and Beverages Revenue (USD Million), by Country (2021-2032)
8.5.1. Brazil Reduced Sugar Food and Beverages Regional Analysis and Outlook
8.5.2. Argentina Reduced Sugar Food and Beverages Regional Analysis and Outlook
8.5.3. Rest of South America Reduced Sugar Food and Beverages Regional Analysis and Outlook
8.6. Middle East and Africa Reduced Sugar Food and Beverages Revenue (USD Million) by Country (2021-2032)
8.6.1. Middle East Reduced Sugar Food and Beverages Regional Analysis and Outlook
8.6.2. Africa Reduced Sugar Food and Beverages Regional Analysis and Outlook
Chapter 9. North America Reduced Sugar Food and Beverages Analysis and Outlook
9.1. North America Reduced Sugar Food and Beverages Revenue (USD Million) by Segments (2021-2032)
9.1.1. North America Reduced Sugar Food and Beverages Revenue (USD Million) by Type (2021-2032)
9.1.2. North America Reduced Sugar Food and Beverages Revenue (USD Million) by Application (2021-2032)
9.1.3. North America Reduced Sugar Food and Beverages Revenue (USD Million) by Product (2021-2032)
By Product
Bakery
Beverages
Confectionery
Dairy
Snacks
Others
By Distribution Channel
Supermarkets/Hypermarkets
Convenience Stores
Online
Others
Chapter 10. Europe Reduced Sugar Food and Beverages Analysis and Outlook
10.1. Europe Reduced Sugar Food and Beverages Revenue (USD Million), by Segments (USD Million) (2021-2032)
10.1.1. Europe Reduced Sugar Food and Beverages Revenue (USD Million) by Type (2021-2032)
10.1.2. Europe Reduced Sugar Food and Beverages Revenue (USD Million) by Application (2021-2032)
10.1.3. Europe Reduced Sugar Food and Beverages Revenue (USD Million) by Product (2021-2032)
By Product
Bakery
Beverages
Confectionery
Dairy
Snacks
Others
By Distribution Channel
Supermarkets/Hypermarkets
Convenience Stores
Online
Others
Chapter 11. Asia Pacific Reduced Sugar Food and Beverages Analysis and Outlook
11.1. Asia Pacific Reduced Sugar Food and Beverages Revenue (USD Million), and Revenue (USD Million) by Segments (2021-2032)
11.1.1. Asia Pacific Reduced Sugar Food and Beverages Revenue (USD Million) by Type (2021-2032)
11.1.2. Asia Pacific Reduced Sugar Food and Beverages Revenue (USD Million) by Application (2021-2032)
11.1.3. Asia Pacific Reduced Sugar Food and Beverages Revenue (USD Million) by Product (2021-2032)
By Product
Bakery
Beverages
Confectionery
Dairy
Snacks
Others
By Distribution Channel
Supermarkets/Hypermarkets
Convenience Stores
Online
Others
Chapter 12. South America Reduced Sugar Food and Beverages Analysis and Outlook
12.1. South America Reduced Sugar Food and Beverages Revenue (USD Million), by Segments (2021-2032)
12.1.1. South America Reduced Sugar Food and Beverages Revenue (USD Million) by Type (2021-2032)
12.1.2. South America Reduced Sugar Food and Beverages Revenue (USD Million) by Application (2021-2032)
12.1.3. South America Reduced Sugar Food and Beverages Revenue (USD Million) by Product (2021-2032)
By Product
Bakery
Beverages
Confectionery
Dairy
Snacks
Others
By Distribution Channel
Supermarkets/Hypermarkets
Convenience Stores
Online
Others
Chapter 13. Middle East and Africa Reduced Sugar Food and Beverages Analysis and Outlook
13.1. Middle East and Africa Reduced Sugar Food and Beverages Revenue (USD Million), by Segments (2021-2032)
13.1.1. Middle East and Africa Reduced Sugar Food and Beverages Revenue (USD Million) by Type (2021-2032)
13.1.2. Middle East and Africa Reduced Sugar Food and Beverages Revenue (USD Million) by Application (2021-2032)
13.1.3. Middle East and Africa Reduced Sugar Food and Beverages Revenue (USD Million) by Product (2021-2032)
By Product
Bakery
Beverages
Confectionery
Dairy
Snacks
Others
By Distribution Channel
Supermarkets/Hypermarkets
Convenience Stores
Online
Others
Chapter 14. Reduced Sugar Food and Beverages Company Profiles
14.1 Business Overview
14.2 Product Profiles
14.3 SWOT Profiles
14.5 Recent Developments
14.6 Financial Profile
List of Companies
Alchemy Foodtech Pte. Ltd
Bayn Europe AB
Cargill Inc
Danone S.A.
Fifty50 Foods
Givaudan SA
Hain Celestial Group
LP Group
Mondelēz International
Nestlé S.A.
NOW Foods
PepsiCo Inc
The Coca-Cola Company
The J. M. Smucker Company
Unilever plc
15. Methodology and Data Sources
15.1 Customization Offerings
15.2 Subscription Services
15.3 Related Reports
15.4 Publisher Expertise
LIST OF TABLES
Table 1 Market Segmentation Analysis
Table 2 Global Reduced Sugar Food and Beverages Market Share of Leading Companies, 2023
Table 3 Product Offerings of Leading Companies
Table 4 Low Growth Scenario Forecasts
Table 5 Reference Case Growth Scenario
Table 6 High Growth Case Scenario
Table 7 Global Reduced Sugar Food and Beverages Revenue (USD Million) And CAGR (%) By Type (2021-2032)
Table 8 Global Reduced Sugar Food and Beverages Revenue (USD Million) And CAGR (%) By Application (2021-2032)
Table 9 Global Reduced Sugar Food and Beverages Revenue (USD Million) And CAGR (%) By Product (2021-2032)
Table 10 Global Reduced Sugar Food and Beverages Market Revenue (USD Million) By Regions (2021-2032)
Table 11 Global Reduced Sugar Food and Beverages Market Share (%) By Regions (2021-2032)
Table 12 North America Reduced Sugar Food and Beverages Revenue (USD Million) By Country (2021-2032)
Table 13 Europe Reduced Sugar Food and Beverages Revenue (USD Million) By Country (2021-2032)
Table 14 Asia Pacific Reduced Sugar Food and Beverages Revenue (USD Million) By Country (2021-2032)
Table 15 South America Reduced Sugar Food and Beverages Revenue (USD Million) By Country (2021-2032)
Table 16 Middle East and Africa Reduced Sugar Food and Beverages Revenue (USD Million) By Region (2021-2032)
Table 17 North America Reduced Sugar Food and Beverages Revenue (USD Million) By Type (2021-2032)
Table 18 North America Reduced Sugar Food and Beverages Revenue (USD Million) By Application (2021-2032)
Table 19 North America Reduced Sugar Food and Beverages Revenue (USD Million) By Product (2021-2032)
Table 20 Europe Reduced Sugar Food and Beverages Revenue (USD Million) By Type (2021-2032)
Table 21 Europe Reduced Sugar Food and Beverages Revenue (USD Million) By Application (2021-2032)
Table 22 Europe Reduced Sugar Food and Beverages Revenue (USD Million) By Product (2021-2032)
Table 23 Asia Pacific Reduced Sugar Food and Beverages Revenue (USD Million) By Type (2021-2032)
Table 24 Asia Pacific Reduced Sugar Food and Beverages Revenue (USD Million) By Application (2021-2032)
Table 25 Asia Pacific Reduced Sugar Food and Beverages Revenue (USD Million) By Product (2021-2032)
Table 26 South America Reduced Sugar Food and Beverages Revenue (USD Million) By Type (2021-2032)
Table 27 South America Reduced Sugar Food and Beverages Revenue (USD Million) By Application (2021-2032)
Table 28 South America Reduced Sugar Food and Beverages Revenue (USD Million) By Product (2021-2032)
Table 29 Middle East and Africa Reduced Sugar Food and Beverages Revenue (USD Million) By Type (2021-2032)
Table 30 Middle East and Africa Reduced Sugar Food and Beverages Revenue (USD Million) By Application (2021-2032)
Table 31 Middle East and Africa Reduced Sugar Food and Beverages Revenue (USD Million) By Product (2021-2032)
LIST OF FIGURES
Figure 1. Market Scope
Figure 2. Pricing Forecasts Per Unit, 2023- 2032
Figure 3. Porter’s Five Forces
Figure 4. Global Reduced Sugar Food and Beverages Market Revenue (USD Million) By Regions (2021-2032)
Figure 5. Global Reduced Sugar Food and Beverages Market Share (%) By Regions (2023)
Figure 6. North America Reduced Sugar Food and Beverages Revenue (USD Million) By Country (2021-2032)
Figure 7. United States Reduced Sugar Food and Beverages Revenue (USD Million) By Country (2021-2032)
Figure 8. Canada Reduced Sugar Food and Beverages Revenue (USD Million) By Country (2021-2032)
Figure 9. Mexico Reduced Sugar Food and Beverages Revenue (USD Million) By Country (2021-2032)
Figure 10. Europe Reduced Sugar Food and Beverages Revenue (USD Million) By Country (2021-2032)
Figure 11. Germany Reduced Sugar Food and Beverages Revenue (USD Million) By Country (2021-2032)
Figure 12. France Reduced Sugar Food and Beverages Revenue (USD Million) By Country (2021-2032)
Figure 13. United Kingdom Reduced Sugar Food and Beverages Revenue (USD Million) By Country (2021-2032)
Figure 14. Spain Reduced Sugar Food and Beverages Revenue (USD Million) By Country (2021-2032)
Figure 15. Italy Reduced Sugar Food and Beverages Revenue (USD Million) By Country (2021-2032)
Figure 16. Russia Reduced Sugar Food and Beverages Revenue (USD Million) By Country (2021-2032)
Figure 17. Rest of Europe Reduced Sugar Food and Beverages Revenue (USD Million) By Country (2021-2032)
Figure 11. Asia Pacific Reduced Sugar Food and Beverages Revenue (USD Million) By Country (2021-2032)
Figure 12. China Reduced Sugar Food and Beverages Revenue (USD Million) By Country (2021-2032)
Figure 13. Japan Reduced Sugar Food and Beverages Revenue (USD Million) By Country (2021-2032)
Figure 14. India Reduced Sugar Food and Beverages Revenue (USD Million) By Country (2021-2032)
Figure 15. South Korea Reduced Sugar Food and Beverages Revenue (USD Million) By Country (2021-2032)
Figure 16. Australia Reduced Sugar Food and Beverages Revenue (USD Million) By Country (2021-2032)
Figure 17. South East Asia Reduced Sugar Food and Beverages Revenue (USD Million) By Country (2021-2032)
Figure 18. South America Reduced Sugar Food and Beverages Revenue (USD Million) By Country (2021-2032)
Figure 19. Brazil Reduced Sugar Food and Beverages Revenue (USD Million) By Country (2021-2032)
Figure 20. Argentina Reduced Sugar Food and Beverages Revenue (USD Million) By Country (2021-2032)
Figure 21. Rest of Asia Pacific Reduced Sugar Food and Beverages Revenue (USD Million) By Country (2021-2032)
Figure 22. Middle East and Africa Reduced Sugar Food and Beverages Revenue (USD Million) By Region (2021-2032)
Figure 23. Saudi Arabia Reduced Sugar Food and Beverages Revenue (USD Million) By Region (2021-2032)
Figure 24. The UAE Reduced Sugar Food and Beverages Revenue (USD Million) By Region (2021-2032)
Figure 25. Rest of Middle East Reduced Sugar Food and Beverages Revenue (USD Million) By Region (2021-2032)
Figure 26. South Africa Reduced Sugar Food and Beverages Revenue (USD Million) By Region (2021-2032)
Figure 27. Africa Reduced Sugar Food and Beverages Revenue (USD Million) By Region (2021-2032)
Figure 28. North America Reduced Sugar Food and Beverages Revenue (USD Million) By Type (2021-2032)
Figure 29. North America Reduced Sugar Food and Beverages Revenue (USD Million) By Application (2021-2032)
Figure 30. North America Reduced Sugar Food and Beverages Revenue (USD Million) By Product (2021-2032)
Figure 31. Europe Reduced Sugar Food and Beverages Revenue (USD Million) By Type (2021-2032)
Figure 32. Europe Reduced Sugar Food and Beverages Revenue (USD Million) By Application (2021-2032)
Figure 33. Europe Reduced Sugar Food and Beverages Revenue (USD Million) By Product (2021-2032)
Figure 34. Asia Pacific Reduced Sugar Food and Beverages Revenue (USD Million) By Type (2021-2032)
Figure 35. Asia Pacific Reduced Sugar Food and Beverages Revenue (USD Million) By Application (2021-2032)
Figure 36. Asia Pacific Reduced Sugar Food and Beverages Revenue (USD Million) By Product (2021-2032)
Figure 37. South America Reduced Sugar Food and Beverages Revenue (USD Million) By Type (2021-2032)
Figure 38. South America Reduced Sugar Food and Beverages Revenue (USD Million) By Application (2021-2032)
Figure 39. South America Reduced Sugar Food and Beverages Revenue (USD Million) By Product (2021-2032)
Figure 40. Middle East and Africa Reduced Sugar Food and Beverages Revenue (USD Million) By Type (2021-2032)
Figure 41. Middle East and Africa Reduced Sugar Food and Beverages Revenue (USD Million) By Application (2021-2032)
Figure 42. Middle East and Africa Reduced Sugar Food and Beverages Revenue (USD Million) By Product (2021-2032)
By Product
Bakery
Beverages
Confectionery
Dairy
Snacks
Others
By Distribution Channel
Supermarkets/Hypermarkets
Convenience Stores
Online
Others
Countries Analyzed
North America (US, Canada, Mexico)
Europe (Germany, UK, France, Spain, Italy, Russia, Rest of Europe)
Asia Pacific (China, India, Japan, South Korea, Australia, South East Asia, Rest of Asia)
South America (Brazil, Argentina, Rest of South America)
Middle East and Africa (Saudi Arabia, UAE, Rest of Middle East, South Africa, Egypt, Rest of Africa)
