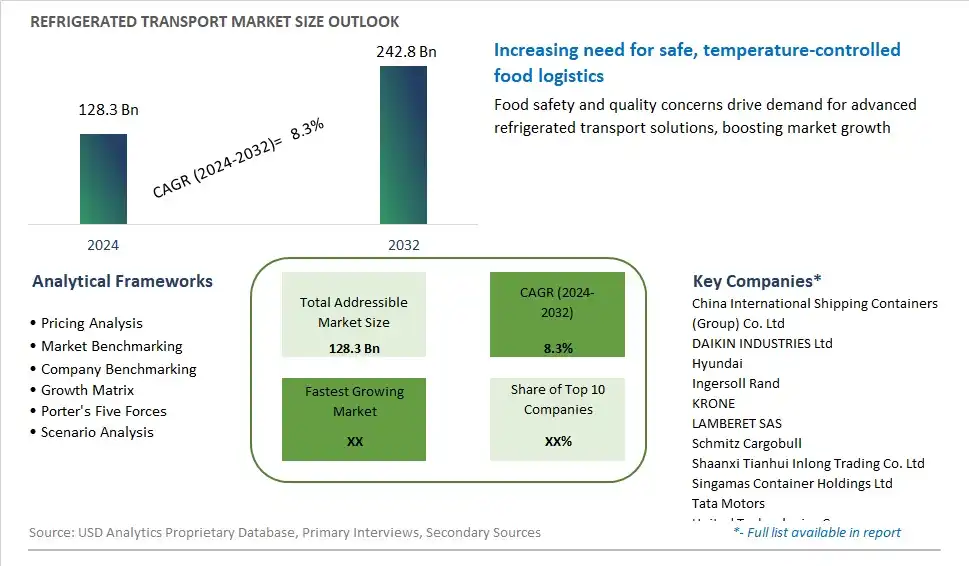
Global Refrigerated Transport Market Size is valued at $128.3 Billion in 2024 and is forecast to register a growth rate (CAGR) of 8.3% to reach $242.8 Billion by 2032.
The global Refrigerated Transport Market Comprehensive Study analyzes and forecasts the market size across 6 regions and 24 countries for diverse segments -By Application (Chilled food, Frozen food), By Mode of Transport (LCV, MHCV, HCV), By Temperature (Single temperature, Multi-temperature), By Technology (Air-blown Evaporators, Eutectic Devices, Hybrid, Fully Electrified)
An Introduction to Refrigerated Transport Market
Refrigerated transport refers to the transportation of perishable goods such as fresh produce, dairy products, meat, seafood, and pharmaceuticals under temperature-controlled conditions to maintain quality, safety, and shelf life during transit in 2024. Refrigerated transport vehicles, also known as reefers, are equipped with refrigeration units and temperature monitoring systems to regulate temperature and humidity levels according to the requirements of the cargo. Refrigerated transport plays a critical role in the supply chain, ensuring that temperature-sensitive products reach their destination in optimal condition, free from spoilage, contamination, and deterioration. With the globalization of food supply chains, increasing demand for fresh and frozen foods, and stricter food safety regulations, the market for refrigerated transport is growing, driven by investments in refrigeration technology, fleet expansion, and cold chain logistics that enable manufacturers, retailers, and distributors to meet consumer demands for high-quality, perishable goods year-round, regardless of geographical location or seasonal availability.
Refrigerated Transport Competitive Landscape
The market report analyses the leading companies in the industry including China International Shipping Containers (Group) Co. Ltd, DAIKIN INDUSTRIES Ltd, Hyundai, Ingersoll Rand, KRONE, LAMBERET SAS, Schmitz Cargobull, Shaanxi Tianhui Inlong Trading Co. Ltd, Singamas Container Holdings Ltd, Tata Motors, United Technologies Corp, Utility Trailer Manufacturing Company, VE Commercial Vehicles Ltd, Wabash National Corp and Great Dane LLC, and Others.
Refrigerated Transport Market Dynamics
Refrigerated Transport Market Trend: Growing Demand for Temperature-Sensitive Products
One prominent market trend in refrigerated transport is the growing demand for temperature-sensitive products. With the expansion of global trade and e-commerce, there's an increasing need to transport perishable goods such as fresh produce, dairy products, meat, seafood, pharmaceuticals, and vaccines over long distances while maintaining their quality and safety. This trend is driven by consumers' preferences for fresh, high-quality foods, as well as the pharmaceutical industry's requirements for strict temperature control to ensure the efficacy and integrity of sensitive medications. As a result, there's a rising reliance on refrigerated transport solutions to preserve the cold chain and meet regulatory requirements for product safety and quality assurance.
Market Driver: Stringent Regulations and Quality Standards
A key driver propelling the market for refrigerated transport is the presence of stringent regulations and quality standards governing the transportation of perishable goods. Government agencies and international organizations impose strict guidelines on temperature control, sanitation, traceability, and handling practices to prevent foodborne illnesses, minimize product spoilage, and safeguard public health. Similarly, pharmaceutical manufacturers must adhere to Good Distribution Practices (GDP) and Good Manufacturing Practices (GMP) to ensure the safety, efficacy, and compliance of their products throughout the supply chain. The need to comply with these regulations and quality standards drives the demand for refrigerated transport services equipped with advanced temperature monitoring, tracking, and reporting capabilities to maintain the integrity and safety of temperature-sensitive goods during transit.
Market Opportunity: Adoption of Advanced Refrigeration Technologies and Sustainability Initiatives
An opportunity within the refrigerated transport market lies in the adoption of advanced refrigeration technologies and sustainability initiatives to enhance efficiency, reduce costs, and minimize environmental impact. As concerns about climate change, energy consumption, and greenhouse gas emissions continue to escalate, there's a growing emphasis on adopting eco-friendly refrigeration systems powered by renewable energy sources, such as solar, wind, or electric power, to reduce reliance on fossil fuels and mitigate carbon footprint. Additionally, there's an opportunity to invest in innovative insulation materials, temperature-controlled packaging, and refrigeration units equipped with energy-efficient compressors and smart sensors to optimize temperature management, minimize refrigerant leakage, and reduce operating costs. By embracing sustainability initiatives and technological advancements, refrigerated transport providers can enhance their competitive advantage, attract environmentally conscious customers, and position themselves as leaders in the evolving cold chain logistics industry.
Refrigerated Transport Market Share Analysis: Chilled Food held the dominant market share in 2024
The chilled food segment dominates the refrigerated transport market due to the extensive range of perishable food products requiring temperature-controlled transportation to maintain freshness, quality, and safety. Chilled food items, including milk, dairy products, bakery and confectionery products, beverages, and fresh fruits and vegetables, are highly susceptible to spoilage and microbial contamination if not transported under appropriate temperature conditions. Refrigerated transport ensures that these perishable items are maintained at optimal temperatures throughout the supply chain, from production facilities to distribution centers and retail outlets, to preserve their shelf life and ensure consumer satisfaction. Further, the increasing consumer demand for convenience, healthy eating, and fresh food products has led to the expansion of chilled food categories and the need for efficient refrigerated transport solutions. As a result, the chilled food segment remains the largest and most significant application segment in the refrigerated transport market, driving continued growth and innovation in the industry.
Refrigerated Transport Market Share Analysis: MHCV market is poised to register the fastest growth rae over the forecast period to 2032
The medium and heavy commercial vehicles (MHCV) segment is experiencing rapid growth in the refrigerated transport market due to increasing demand for efficient and larger-capacity vehicles to transport perishable goods over longer distances. MHCVs offer higher payload capacities and are equipped with advanced refrigeration systems capable of maintaining precise temperature control throughout the transportation process, ensuring the freshness and quality of perishable goods. Further, MHCVs are essential for transporting bulk quantities of chilled and frozen food products, including dairy, meat, seafood, fruits, and vegetables, to meet the needs of urban centers and distant markets. Additionally, advancements in vehicle design, fuel efficiency, and refrigeration technology have improved the performance and reliability of MHCVs, making them the preferred choice for refrigerated transport operators seeking cost-effective and sustainable solutions. As global trade in perishable goods continues to expand, driven by changing consumer preferences and international supply chain dynamics, the MHCV segment is expected to sustain its rapid growth trajectory in the refrigerated transport market.
Refrigerated Transport Market Share Analysis: Single Temperature held the dominant market share in 2024
The single temperature segment dominates the refrigerated transport market due to its wide applicability and cost-effectiveness for transporting a variety of perishable goods that require consistent temperature control throughout the journey. Single temperature refrigerated vehicles maintain a constant temperature range ideal for preserving a specific type of perishable product, such as chilled or frozen foods. This segment caters to a diverse range of industries, including dairy, meat, seafood, fruits, vegetables, and pharmaceuticals, where products have similar temperature requirements during transportation. Single temperature refrigerated transport offers simplicity in operation and maintenance, making it a preferred choice for logistics companies and fleet operators. Additionally, the single temperature segment benefits from economies of scale, as vehicles can be optimized for specific temperature ranges, resulting in lower operating costs and improved efficiency. As the demand for perishable goods continues to rise globally, driven by population growth, urbanization, and changing consumer preferences, the single temperature segment is expected to maintain its dominance in the refrigerated transport market.
Refrigerated Transport Market Segmentation
By Application
Chilled food
-Milk
-Bakery & confectionery products
-Dairy products
-Beverages
-Fresh fruits & vegetables
Frozen food
-Ice cream
-Frozen dairy products
-Meat-processed
-Fish & sea food
-Bakery products
By Mode of Transport
LCV
MHCV
HCV
By Temperature
Single temperature
Multi-temperature
By Technology
Air-blown Evaporators
Eutectic Devices
Hybrid
Fully Electrified
Countries Analyzed
North America (US, Canada, Mexico)
Europe (Germany, UK, France, Spain, Italy, Russia, Rest of Europe)
Asia Pacific (China, India, Japan, South Korea, Australia, South East Asia, Rest of Asia)
South America (Brazil, Argentina, Rest of South America)
Middle East and Africa (Saudi Arabia, UAE, Rest of Middle East, South Africa, Egypt, Rest of Africa)
Refrigerated Transport Companies Profiled in the Study
China International Shipping Containers (Group) Co. Ltd
DAIKIN INDUSTRIES Ltd
Hyundai
Ingersoll Rand
KRONE
LAMBERET SAS
Schmitz Cargobull
Shaanxi Tianhui Inlong Trading Co. Ltd
Singamas Container Holdings Ltd
Tata Motors
United Technologies Corp
Utility Trailer Manufacturing Company
VE Commercial Vehicles Ltd
Wabash National Corp and Great Dane LLC
*- List Not Exhaustive
Chapter 1. TABLE OF CONTENTS
Chapter 2. Introduction to Refrigerated Transport Market
2.1. Market Overview
2.2. Key Statistics and Report Highlights
2.3. Scope of the Comprehensive Study
2.3.1. Market Definition
2.3.2 Countries and Regions Covered
2.3.3 Research Objective
2.3.4 Units, Currency, and Conversions
2.3.5 Industry Value Chain
2.4. Key Market Segments
2.5. Key Companies
2.6. Study Period
Chapter 3. Strategic Analysis Review
3.1. Refrigerated Transport Pricing Analysis and Forecast
3.2. Porter’s Five Forces
3.3. Market Ecosystem
3.4. SWOT Analysis
3.5. Regulatory Scenario
3.3. Effects of Inflation, Russia-Ukraine War, moderating economic growth, and other macroeconomic factors
Chapter 4. Competitive Landscape
4.1. Market Share Analysis
4.1.1. Global Refrigerated Transport Market Share by Company, 2023
4.1.2. Product Offerings of Leading Refrigerated Transport Companies
4.2. Market Entropy
4.2.1. New Product Launches in the Industry
4.2.2. Mergers, Acquisitions, Joint ventures, and Partnerships
4.3. Key Strategies and Best Practices
Chapter 5. Global Market Projections: Best, Reference, and Low Case Scenarios
5.1. Growth Analysis- Case Scenario Definitions
5.2. Low Growth Case Scenario Forecasts
5.3. Reference Growth Case Scenario Forecasts
5.4. High Growth Case Scenario Forecasts
Chapter 6. Market Dynamics
6.1. Refrigerated Transport Market Drivers
6.2. Refrigerated Transport Market Challenges
6.6. Refrigerated Transport Market Opportunities
6.4. Refrigerated Transport Market Trends
Chapter 7. Global Refrigerated Transport Market Outlook Trends
7.1. Global Refrigerated Transport Revenue (USD Million) and CAGR (%) by Type (2021-2032)
7.2. Global Refrigerated Transport Revenue (USD Million) and CAGR (%) by Application (2021-2032)
7.3. Global Refrigerated Transport Revenue (USD Million) and CAGR (%) by Product (2021-2032)
By Application
Chilled food
-Milk
-Bakery & confectionery products
-Dairy products
-Beverages
-Fresh fruits & vegetables
Frozen food
-Ice cream
-Frozen dairy products
-Meat-processed
-Fish & sea food
-Bakery products
By Mode of Transport
LCV
MHCV
HCV
By Temperature
Single temperature
Multi-temperature
By Technology
Air-blown Evaporators
Eutectic Devices
Hybrid
Fully Electrified
Chapter 8. Global Refrigerated Transport Regional Analysis and Outlook
8.1. Global Refrigerated Transport Revenue (USD Million) By Regions (2021- 2032)
8.2. North America Refrigerated Transport Revenue (USD Million) by Country (2021-2032)
8.2.1. United States Refrigerated Transport Regional Analysis and Outlook
8.2.2. Canada Refrigerated Transport Regional Analysis and Outlook
8.2.3. Mexico Refrigerated Transport Regional Analysis and Outlook
8.3. Europe Refrigerated Transport Revenue (USD Million), by Country (2021-2032)
8.3.1. Germany Refrigerated Transport Regional Analysis and Outlook
8.3.2. France Refrigerated Transport Regional Analysis and Outlook
8.3.3. United Kingdom Refrigerated Transport Regional Analysis and Outlook
8.3.4. Spain Refrigerated Transport Regional Analysis and Outlook
8.3.5. Italy Refrigerated Transport Regional Analysis and Outlook
8.3.6. Russia Refrigerated Transport Regional Analysis and Outlook
8.3.7. Rest of Europe Refrigerated Transport Regional Analysis and Outlook
8.4. Asia Pacific Refrigerated Transport Revenue (USD Million) by Country (2021-2032)
8.4.1. China Refrigerated Transport Regional Analysis and Outlook
8.4.2. Japan Refrigerated Transport Regional Analysis and Outlook
8.4.3. India Refrigerated Transport Regional Analysis and Outlook
8.4.4. South Korea Refrigerated Transport Regional Analysis and Outlook
8.4.5. Australia Refrigerated Transport Regional Analysis and Outlook
8.4.6. South East Asia Refrigerated Transport Regional Analysis and Outlook
8.4.7. Rest of Asia Pacific Refrigerated Transport Regional Analysis and Outlook
8.5. South America Refrigerated Transport Revenue (USD Million), by Country (2021-2032)
8.5.1. Brazil Refrigerated Transport Regional Analysis and Outlook
8.5.2. Argentina Refrigerated Transport Regional Analysis and Outlook
8.5.3. Rest of South America Refrigerated Transport Regional Analysis and Outlook
8.6. Middle East and Africa Refrigerated Transport Revenue (USD Million) by Country (2021-2032)
8.6.1. Middle East Refrigerated Transport Regional Analysis and Outlook
8.6.2. Africa Refrigerated Transport Regional Analysis and Outlook
Chapter 9. North America Refrigerated Transport Analysis and Outlook
9.1. North America Refrigerated Transport Revenue (USD Million) by Segments (2021-2032)
9.1.1. North America Refrigerated Transport Revenue (USD Million) by Type (2021-2032)
9.1.2. North America Refrigerated Transport Revenue (USD Million) by Application (2021-2032)
9.1.3. North America Refrigerated Transport Revenue (USD Million) by Product (2021-2032)
By Application
Chilled food
-Milk
-Bakery & confectionery products
-Dairy products
-Beverages
-Fresh fruits & vegetables
Frozen food
-Ice cream
-Frozen dairy products
-Meat-processed
-Fish & sea food
-Bakery products
By Mode of Transport
LCV
MHCV
HCV
By Temperature
Single temperature
Multi-temperature
By Technology
Air-blown Evaporators
Eutectic Devices
Hybrid
Fully Electrified
Chapter 10. Europe Refrigerated Transport Analysis and Outlook
10.1. Europe Refrigerated Transport Revenue (USD Million), by Segments (USD Million) (2021-2032)
10.1.1. Europe Refrigerated Transport Revenue (USD Million) by Type (2021-2032)
10.1.2. Europe Refrigerated Transport Revenue (USD Million) by Application (2021-2032)
10.1.3. Europe Refrigerated Transport Revenue (USD Million) by Product (2021-2032)
By Application
Chilled food
-Milk
-Bakery & confectionery products
-Dairy products
-Beverages
-Fresh fruits & vegetables
Frozen food
-Ice cream
-Frozen dairy products
-Meat-processed
-Fish & sea food
-Bakery products
By Mode of Transport
LCV
MHCV
HCV
By Temperature
Single temperature
Multi-temperature
By Technology
Air-blown Evaporators
Eutectic Devices
Hybrid
Fully Electrified
Chapter 11. Asia Pacific Refrigerated Transport Analysis and Outlook
11.1. Asia Pacific Refrigerated Transport Revenue (USD Million), and Revenue (USD Million) by Segments (2021-2032)
11.1.1. Asia Pacific Refrigerated Transport Revenue (USD Million) by Type (2021-2032)
11.1.2. Asia Pacific Refrigerated Transport Revenue (USD Million) by Application (2021-2032)
11.1.3. Asia Pacific Refrigerated Transport Revenue (USD Million) by Product (2021-2032)
By Application
Chilled food
-Milk
-Bakery & confectionery products
-Dairy products
-Beverages
-Fresh fruits & vegetables
Frozen food
-Ice cream
-Frozen dairy products
-Meat-processed
-Fish & sea food
-Bakery products
By Mode of Transport
LCV
MHCV
HCV
By Temperature
Single temperature
Multi-temperature
By Technology
Air-blown Evaporators
Eutectic Devices
Hybrid
Fully Electrified
Chapter 12. South America Refrigerated Transport Analysis and Outlook
12.1. South America Refrigerated Transport Revenue (USD Million), by Segments (2021-2032)
12.1.1. South America Refrigerated Transport Revenue (USD Million) by Type (2021-2032)
12.1.2. South America Refrigerated Transport Revenue (USD Million) by Application (2021-2032)
12.1.3. South America Refrigerated Transport Revenue (USD Million) by Product (2021-2032)
By Application
Chilled food
-Milk
-Bakery & confectionery products
-Dairy products
-Beverages
-Fresh fruits & vegetables
Frozen food
-Ice cream
-Frozen dairy products
-Meat-processed
-Fish & sea food
-Bakery products
By Mode of Transport
LCV
MHCV
HCV
By Temperature
Single temperature
Multi-temperature
By Technology
Air-blown Evaporators
Eutectic Devices
Hybrid
Fully Electrified
Chapter 13. Middle East and Africa Refrigerated Transport Analysis and Outlook
13.1. Middle East and Africa Refrigerated Transport Revenue (USD Million), by Segments (2021-2032)
13.1.1. Middle East and Africa Refrigerated Transport Revenue (USD Million) by Type (2021-2032)
13.1.2. Middle East and Africa Refrigerated Transport Revenue (USD Million) by Application (2021-2032)
13.1.3. Middle East and Africa Refrigerated Transport Revenue (USD Million) by Product (2021-2032)
By Application
Chilled food
-Milk
-Bakery & confectionery products
-Dairy products
-Beverages
-Fresh fruits & vegetables
Frozen food
-Ice cream
-Frozen dairy products
-Meat-processed
-Fish & sea food
-Bakery products
By Mode of Transport
LCV
MHCV
HCV
By Temperature
Single temperature
Multi-temperature
By Technology
Air-blown Evaporators
Eutectic Devices
Hybrid
Fully Electrified
Chapter 14. Refrigerated Transport Company Profiles
14.1 Business Overview
14.2 Product Profiles
14.3 SWOT Profiles
14.5 Recent Developments
14.6 Financial Profile
List of Companies
China International Shipping Containers (Group) Co. Ltd
DAIKIN INDUSTRIES Ltd
Hyundai
Ingersoll Rand
KRONE
LAMBERET SAS
Schmitz Cargobull
Shaanxi Tianhui Inlong Trading Co. Ltd
Singamas Container Holdings Ltd
Tata Motors
United Technologies Corp
Utility Trailer Manufacturing Company
VE Commercial Vehicles Ltd
Wabash National Corp and Great Dane LLC
15. Methodology and Data Sources
15.1 Customization Offerings
15.2 Subscription Services
15.3 Related Reports
15.4 Publisher Expertise
LIST OF TABLES
Table 1 Market Segmentation Analysis
Table 2 Global Refrigerated Transport Market Share of Leading Companies, 2023
Table 3 Product Offerings of Leading Companies
Table 4 Low Growth Scenario Forecasts
Table 5 Reference Case Growth Scenario
Table 6 High Growth Case Scenario
Table 7 Global Refrigerated Transport Revenue (USD Million) And CAGR (%) By Type (2021-2032)
Table 8 Global Refrigerated Transport Revenue (USD Million) And CAGR (%) By Application (2021-2032)
Table 9 Global Refrigerated Transport Revenue (USD Million) And CAGR (%) By Product (2021-2032)
Table 10 Global Refrigerated Transport Market Revenue (USD Million) By Regions (2021-2032)
Table 11 Global Refrigerated Transport Market Share (%) By Regions (2021-2032)
Table 12 North America Refrigerated Transport Revenue (USD Million) By Country (2021-2032)
Table 13 Europe Refrigerated Transport Revenue (USD Million) By Country (2021-2032)
Table 14 Asia Pacific Refrigerated Transport Revenue (USD Million) By Country (2021-2032)
Table 15 South America Refrigerated Transport Revenue (USD Million) By Country (2021-2032)
Table 16 Middle East and Africa Refrigerated Transport Revenue (USD Million) By Region (2021-2032)
Table 17 North America Refrigerated Transport Revenue (USD Million) By Type (2021-2032)
Table 18 North America Refrigerated Transport Revenue (USD Million) By Application (2021-2032)
Table 19 North America Refrigerated Transport Revenue (USD Million) By Product (2021-2032)
Table 20 Europe Refrigerated Transport Revenue (USD Million) By Type (2021-2032)
Table 21 Europe Refrigerated Transport Revenue (USD Million) By Application (2021-2032)
Table 22 Europe Refrigerated Transport Revenue (USD Million) By Product (2021-2032)
Table 23 Asia Pacific Refrigerated Transport Revenue (USD Million) By Type (2021-2032)
Table 24 Asia Pacific Refrigerated Transport Revenue (USD Million) By Application (2021-2032)
Table 25 Asia Pacific Refrigerated Transport Revenue (USD Million) By Product (2021-2032)
Table 26 South America Refrigerated Transport Revenue (USD Million) By Type (2021-2032)
Table 27 South America Refrigerated Transport Revenue (USD Million) By Application (2021-2032)
Table 28 South America Refrigerated Transport Revenue (USD Million) By Product (2021-2032)
Table 29 Middle East and Africa Refrigerated Transport Revenue (USD Million) By Type (2021-2032)
Table 30 Middle East and Africa Refrigerated Transport Revenue (USD Million) By Application (2021-2032)
Table 31 Middle East and Africa Refrigerated Transport Revenue (USD Million) By Product (2021-2032)
LIST OF FIGURES
Figure 1. Market Scope
Figure 2. Pricing Forecasts Per Unit, 2023- 2032
Figure 3. Porter’s Five Forces
Figure 4. Global Refrigerated Transport Market Revenue (USD Million) By Regions (2021-2032)
Figure 5. Global Refrigerated Transport Market Share (%) By Regions (2023)
Figure 6. North America Refrigerated Transport Revenue (USD Million) By Country (2021-2032)
Figure 7. United States Refrigerated Transport Revenue (USD Million) By Country (2021-2032)
Figure 8. Canada Refrigerated Transport Revenue (USD Million) By Country (2021-2032)
Figure 9. Mexico Refrigerated Transport Revenue (USD Million) By Country (2021-2032)
Figure 10. Europe Refrigerated Transport Revenue (USD Million) By Country (2021-2032)
Figure 11. Germany Refrigerated Transport Revenue (USD Million) By Country (2021-2032)
Figure 12. France Refrigerated Transport Revenue (USD Million) By Country (2021-2032)
Figure 13. United Kingdom Refrigerated Transport Revenue (USD Million) By Country (2021-2032)
Figure 14. Spain Refrigerated Transport Revenue (USD Million) By Country (2021-2032)
Figure 15. Italy Refrigerated Transport Revenue (USD Million) By Country (2021-2032)
Figure 16. Russia Refrigerated Transport Revenue (USD Million) By Country (2021-2032)
Figure 17. Rest of Europe Refrigerated Transport Revenue (USD Million) By Country (2021-2032)
Figure 11. Asia Pacific Refrigerated Transport Revenue (USD Million) By Country (2021-2032)
Figure 12. China Refrigerated Transport Revenue (USD Million) By Country (2021-2032)
Figure 13. Japan Refrigerated Transport Revenue (USD Million) By Country (2021-2032)
Figure 14. India Refrigerated Transport Revenue (USD Million) By Country (2021-2032)
Figure 15. South Korea Refrigerated Transport Revenue (USD Million) By Country (2021-2032)
Figure 16. Australia Refrigerated Transport Revenue (USD Million) By Country (2021-2032)
Figure 17. South East Asia Refrigerated Transport Revenue (USD Million) By Country (2021-2032)
Figure 18. South America Refrigerated Transport Revenue (USD Million) By Country (2021-2032)
Figure 19. Brazil Refrigerated Transport Revenue (USD Million) By Country (2021-2032)
Figure 20. Argentina Refrigerated Transport Revenue (USD Million) By Country (2021-2032)
Figure 21. Rest of Asia Pacific Refrigerated Transport Revenue (USD Million) By Country (2021-2032)
Figure 22. Middle East and Africa Refrigerated Transport Revenue (USD Million) By Region (2021-2032)
Figure 23. Saudi Arabia Refrigerated Transport Revenue (USD Million) By Region (2021-2032)
Figure 24. The UAE Refrigerated Transport Revenue (USD Million) By Region (2021-2032)
Figure 25. Rest of Middle East Refrigerated Transport Revenue (USD Million) By Region (2021-2032)
Figure 26. South Africa Refrigerated Transport Revenue (USD Million) By Region (2021-2032)
Figure 27. Africa Refrigerated Transport Revenue (USD Million) By Region (2021-2032)
Figure 28. North America Refrigerated Transport Revenue (USD Million) By Type (2021-2032)
Figure 29. North America Refrigerated Transport Revenue (USD Million) By Application (2021-2032)
Figure 30. North America Refrigerated Transport Revenue (USD Million) By Product (2021-2032)
Figure 31. Europe Refrigerated Transport Revenue (USD Million) By Type (2021-2032)
Figure 32. Europe Refrigerated Transport Revenue (USD Million) By Application (2021-2032)
Figure 33. Europe Refrigerated Transport Revenue (USD Million) By Product (2021-2032)
Figure 34. Asia Pacific Refrigerated Transport Revenue (USD Million) By Type (2021-2032)
Figure 35. Asia Pacific Refrigerated Transport Revenue (USD Million) By Application (2021-2032)
Figure 36. Asia Pacific Refrigerated Transport Revenue (USD Million) By Product (2021-2032)
Figure 37. South America Refrigerated Transport Revenue (USD Million) By Type (2021-2032)
Figure 38. South America Refrigerated Transport Revenue (USD Million) By Application (2021-2032)
Figure 39. South America Refrigerated Transport Revenue (USD Million) By Product (2021-2032)
Figure 40. Middle East and Africa Refrigerated Transport Revenue (USD Million) By Type (2021-2032)
Figure 41. Middle East and Africa Refrigerated Transport Revenue (USD Million) By Application (2021-2032)
Figure 42. Middle East and Africa Refrigerated Transport Revenue (USD Million) By Product (2021-2032)
By Application
Chilled food
-Milk
-Bakery & confectionery products
-Dairy products
-Beverages
-Fresh fruits & vegetables
Frozen food
-Ice cream
-Frozen dairy products
-Meat-processed
-Fish & sea food
-Bakery products
By Mode of Transport
LCV
MHCV
HCV
By Temperature
Single temperature
Multi-temperature
By Technology
Air-blown Evaporators
Eutectic Devices
Hybrid
Fully Electrified
Countries Analyzed
North America (US, Canada, Mexico)
Europe (Germany, UK, France, Spain, Italy, Russia, Rest of Europe)
Asia Pacific (China, India, Japan, South Korea, Australia, South East Asia, Rest of Asia)
South America (Brazil, Argentina, Rest of South America)
Middle East and Africa (Saudi Arabia, UAE, Rest of Middle East, South Africa, Egypt, Rest of Africa)
