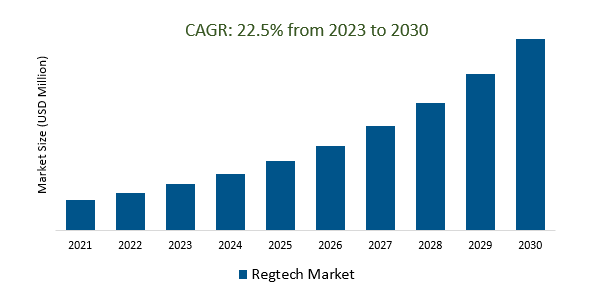
The Global Regtech Market Size is estimated to register 22.5% growth over the forecast period from 2023 to 2030.
The Regtech Market is characterized by increasing regulatory complexity, cost reduction, data analytics, AI, cybersecurity concerns, globalization of compliance, cloud adoption, regulatory sandboxes, AI and machine learning, blockchain and distributed ledger technology, digital identity verification, real-time monitoring, cross-industry application, regulatory reporting automation, regulatory sandboxes and collaboration, and sustainable and ESG compliance. RegTech solutions help financial institutions manage regulatory compliance and risk, automating manual processes, reducing costs, enhancing cybersecurity, and facilitating real-time monitoring. The use of AI and machine learning algorithms, blockchain and distributed ledger technology, digital identity verification, real-time monitoring, cross-industry application, regulatory reporting automation, regulatory sandboxes and collaboration, and sustainable and ESG compliance are driving the market's growth and development. These trends are fostering innovation and the development of tailored solutions for businesses in various industries.
Rising Regulatory Complexity Fuels Demand for Innovative RegTech Solutions.
The escalating intricacy of regulatory frameworks across various industries has spurred a growing demand for innovative RegTech (Regulatory Technology) solutions within the RegTech market. As governments and regulatory bodies continuously introduce new rules and compliance requirements, businesses are seeking advanced technological tools to navigate this evolving landscape efficiently. RegTech solutions, powered by artificial intelligence, machine learning, and data analytics, offer businesses the means to streamline compliance processes, enhance risk management, and ensure adherence to stringent regulations. This increasing reliance on RegTech reflects a fundamental shift towards proactive and automated regulatory compliance strategies, enabling organizations to stay ahead of regulatory changes and reduce compliance-related costs. As a result, the RegTech market is witnessing significant growth as it has become an indispensable resource for companies striving to maintain compliance while staying competitive in today's highly regulated environment.
Cost Reduction through RegTech Solutions by Streamlining Compliance Processes and Minimizing Risk is creating a demand in the market.
The RegTech market is experiencing a surge in demand as businesses increasingly recognize the potential for cost reduction through the adoption of innovative regulatory technology solutions. By leveraging RegTech tools, companies can streamline their compliance processes, reducing the need for manual interventions and extensive paperwork. This not only saves time but also significantly cuts down operational expenses. Moreover, RegTech solutions offer sophisticated risk management capabilities, enabling organizations to identify and mitigate potential risks proactively. As regulatory requirements become more complex and stringent, the need for efficient and technologically advanced compliance solutions grows, making the RegTech market a thriving hub of innovation and investment. This trend is set to continue as businesses prioritize compliance efficiency and risk minimization in an ever-evolving regulatory landscape.
The adoption of cloud-based RegTech solutions is boosting the market.
The adoption of cloud-based RegTech (Regulatory Technology) solutions is experiencing a remarkable surge, propelling significant growth in the RegTech market. Companies and financial institutions are increasingly turning to cloud technology to streamline their regulatory compliance processes. This trend offers several advantages, including cost-effectiveness, scalability, and enhanced data security. Cloud-based RegTech solutions empower organizations to efficiently navigate complex regulatory landscapes, manage risk, and ensure compliance with evolving industry standards. As the regulatory environment continues to evolve, the RegTech market is poised to expand further, offering innovative, cloud-driven solutions to meet the ever-growing compliance challenges of businesses across various sectors.
Market Share Analysis:
Solutions are the most dominant type in the RegTech market.
RegTech solutions, comprising software tools and applications, hold a commanding position in the market, primarily assisting financial institutions in meeting regulatory obligations. These solutions automate diverse compliance tasks, encompassing areas like Know Your Customer (KYC), Anti-Money Laundering (AML), compliance reporting, risk management, and transaction monitoring. The surging demand for RegTech solutions is a direct response to the growing complexity and rigor of regulatory mandates faced by financial institutions, underscoring their critical role in ensuring adherence to regulatory standards.
In the RegTech market, Risk and Compliance Management stands out as the predominant application due to its vital role in financial institutions.
RegTech solutions play a pivotal role in automating and streamlining risk and compliance processes, allowing organizations to allocate resources to more strategic endeavors while simultaneously mitigating the risk of regulatory fines and penalties. These solutions offer several advantages, including enhanced efficiency by automating repetitive tasks like transaction monitoring and reporting, reducing overall risk by improving risk identification and management and ensuring better compliance through up-to-date regulatory adherence, thereby minimizing the risk of regulatory scrutiny and enforcement actions.
Cloud is the most dominant deployment type in the RegTech market.
The RegTech market is witnessing a significant shift towards cloud deployment, driven by several key factors. Firstly, the rising popularity of cloud computing offers distinct advantages like scalability, flexibility, and cost-efficiency compared to on-premises alternatives. Secondly, the increasing demand for RegTech solutions from small and medium-sized enterprises (SMEs), lacking the resources for on-premises investments, contributes to this trend. Additionally, the growing complexity of regulatory compliance requirements is pushing financial institutions towards cloud-based solutions to effectively manage their obligations. These cloud-based RegTech solutions provide scalability without the need for additional hardware or software, offer flexibility for remote teams, and generate cost savings by reducing IT expenses, including hardware, software, and maintenance.
The RegTech market is characterized by the dominance of large enterprises, which play a pivotal role in shaping its landscape.
The industry giants possess substantial financial resources and a well-established market presence, allowing them to invest heavily in research, development, and innovation within the regulatory technology sector. As a result, they often set the industry standards and drive technological advancements, staying at the forefront of compliance solutions. Furthermore, large enterprises have the capacity to build extensive networks and partnerships with regulatory authorities, financial institutions, and other key stakeholders. This positions them as trusted leaders in providing cutting-edge compliance solutions that address complex regulatory challenges. Their global reach enables them to cater to a wide range of clients, from multinational corporations to smaller businesses, facilitating the widespread adoption of RegTech solutions. Additionally, large enterprises can offer comprehensive, end-to-end RegTech suites that encompass various aspects of compliance, thereby providing clients with one-stop solutions for their regulatory needs. While startups and smaller players contribute to innovation and niche solutions within the RegTech space, the dominance of large enterprises underscores the significance of their role in shaping the industry's future.
The banking and capital industry is the most dominant end-user in the RegTech market.
The banking and capital industry is the primary end-user driving growth in the RegTech (Regulatory Technology) market. This growth is spurred by several factors, including the increasing complexity of financial regulations, the imperative to enhance compliance and risk management, rising compliance costs, and the growing demand for digital transformation. Given the constantly evolving landscape of financial regulations, banks and financial institutions face challenges in staying compliant. RegTech solutions offer automation and streamlining capabilities, reducing compliance costs, and enhancing the accuracy and efficiency of compliance programs. Moreover, these solutions are aiding in risk identification and mitigation, thus lowering the risk of financial losses. Additionally, as the industry undergoes digital transformation, RegTech solutions are instrumental in automating and improving the efficiency and customer experience of digital services.
Regtech Market Segmentation
Type
- Solutions
- Consulting Services
- Implementation Services
- Support and Maintenance Services
- Managed Services
Application
- Risk and Compliance Management
- Identity Management
- Regulatory Reporting
- Anti-Money Laundering and Fraud Management
- Regulatory Intelligence
Deployment
Organization Size
End-User
- Banking and Capital Industry
- Insurance
- Non-Finance Industries
By Region
- North America (United States, Canada, Mexico)
- Europe (Germany, France, United Kingdom, Spain, Italy, Others)
- Asia Pacific (China, India, Japan, South Korea, Australia, Others)
- Latin America (Brazil, Argentina, Others)
- Middle East and Africa (Saudi Arabia, UAE, Kuwait, Other Middle East, South Africa, Nigeria, Other Africa)
Regtech Market Companies
- Actico
- Broadridge
- Deloitte
- London Stock Exchange Group
- IBM
- Jumio
- Metricstream
- Nice Actimize
- PWC
- Thomson Reuters
- Trulioo
- Wolters Kluwer
- Fenergo
*List not exhaustive
Regtech Market Outlook 2023
1 Market Overview
1.1 Introduction to the Regtech Market
1.2 Scope of the Study
1.3 Research Objective
1.3.1 Key Market Scope and Segments
1.3.2 Players Covered
1.3.3 Years Considered
2 Executive Summary
2.1 2023 Regtech Industry- Market Statistics
3 Market Dynamics
3.1 Market Drivers
3.2 Market Challenges
3.3 Market Opportunities
3.4 Market Trends
4 Market Factor Analysis
4.1 Porter’s Five Forces
4.2 Market Entropy
4.2.1 Global Regtech Market Companies with Area Served
4.2.2 Products Offerings Global Regtech Market
5 COVID-19 Impact Analysis and Outlook Scenarios
5.1.1 Covid-19 Impact Analysis
5.1.2 post-COVID-19 Scenario- Low Growth Case
5.1.3 post-COVID-19 Scenario- Reference Growth Case
5.1.4 post-COVID-19 Scenario- Low Growth Case
6 Global Regtech Market Trends
6.1 Global Regtech Revenue (USD Million) and CAGR (%) by Type (2018-2030)
6.2 Global Regtech Revenue (USD Million) and CAGR (%) by Applications (2018-2030)
6.3 Global Regtech Revenue (USD Million) and CAGR (%) by regions (2018-2030)
7 Global Regtech Market Revenue (USD Million) by Type, and Applications (2018-2022)
7.1 Global Regtech Revenue (USD Million) by Type (2018-2022)
7.1.1 Global Regtech Revenue (USD Million), Market Share (%) by Type (2018-2022)
7.2 Global Regtech Revenue (USD Million) by Applications (2018-2022)
7.2.1 Global Regtech Revenue (USD Million), Market Share (%) by Applications (2018-2022)
8 Global Regtech Development Regional Status and Outlook
8.1 Global Regtech Revenue (USD Million) By Regions (2018-2022)
8.2 North America Regtech Revenue (USD Million) by Type, and Application (2018-2022)
8.2.1 North America Regtech Revenue (USD Million) by Country (2018-2022)
8.2.2 North America Regtech Revenue (USD Million) by Type (2018-2022)
8.2.3 North America Regtech Revenue (USD Million) by Applications (2018-2022)
8.3 Europe Regtech Revenue (USD Million), by Type, and Applications (USD Million) (2018-2022)
8.3.1 Europe Regtech Revenue (USD Million), by Country (2018-2022)
8.3.2 Europe Regtech Revenue (USD Million) by Type (2018-2022)
8.3.3 Europe Regtech Revenue (USD Million) by Applications (2018-2022)
8.4 Asia Pacific Regtech Revenue (USD Million), and Revenue (USD Million) by Type, and Applications (2018-2022)
8.4.1 Asia Pacific Regtech Revenue (USD Million) by Country (2018-2022)
8.4.2 Asia Pacific Regtech Revenue (USD Million) by Type (2018-2022)
8.4.3 Asia Pacific Regtech Revenue (USD Million) by Applications (2018-2022)
8.5 South America Regtech Revenue (USD Million), by Type, and Applications (2018-2022)
8.5.1 South America Regtech Revenue (USD Million), by Country (2018-2022)
8.5.2 South America Regtech Revenue (USD Million) by Type (2018-2022)
8.5.3 South America Regtech Revenue (USD Million) by Applications (2018-2022)
8.6 Middle East and Africa Regtech Revenue (USD Million), by Type, Technology, Application, Thickness (2018-2022)
8.6.1 Middle East and Africa Regtech Revenue (USD Million) by Country (2018-2022)
8.6.2 Middle East and Africa Regtech Revenue (USD Million) by Type (2018-2022)
8.6.3 Middle East and Africa Regtech Revenue (USD Million) by Applications (2018-2022)
9 Company Profiles
10 Global Regtech Market Revenue (USD Million), by Type, and Applications (2023-2030)
10.1 Global Regtech Revenue (USD Million) and Market Share (%) by Type (2023-2030)
10.1.1 Global Regtech Revenue (USD Million), and Market Share (%) by Type (2023-2030)
10.2 Global Regtech Revenue (USD Million) and Market Share (%) by Applications (2023-2030)
10.2.1 Global Regtech Revenue (USD Million), and Market Share (%) by Applications (2023-2030)
11 Global Regtech Development Regional Status and Outlook Forecast
11.1 Global Regtech Revenue (USD Million) By Regions (2023-2030)
11.2 North America Regtech Revenue (USD Million) by Type, and Applications (2023-2030)
11.2.1 North America Regtech Revenue (USD) Million by Country (2023-2030)
11.2.2 North America Regtech Revenue (USD Million), by Type (2023-2030)
11.2.3 North America Regtech Revenue (USD Million), Market Share (%) by Applications (2023-2030)
11.3 Europe Regtech Revenue (USD Million), by Type, and Applications (2023-2030)
11.3.1 Europe Regtech Revenue (USD Million), by Country (2023-2030)
11.3.2 Europe Regtech Revenue (USD Million), by Type (2023-2030)
11.3.3 Europe Regtech Revenue (USD Million), by Applications (2023-2030)
11.4 Asia Pacific Regtech Revenue (USD Million) by Type, and Applications (2023-2030)
11.4.1 Asia Pacific Regtech Revenue (USD Million), by Country (2023-2030)
11.4.2 Asia Pacific Regtech Revenue (USD Million), by Type (2023-2030)
11.4.3 Asia Pacific Regtech Revenue (USD Million), by Applications (2023-2030)
11.5 South America Regtech Revenue (USD Million), by Type, and Applications (2023-2030)
11.5.1 South America Regtech Revenue (USD Million), by Country (2023-2030)
11.5.2 South America Regtech Revenue (USD Million), by Type (2023-2030)
11.5.3 South America Regtech Revenue (USD Million), by Applications (2023-2030)
11.6 Middle East and Africa Regtech Revenue (USD Million), by Type, and Applications (2023-2030)
11.6.1 Middle East and Africa Regtech Revenue (USD Million), by region (2023-2030)
11.6.2 Middle East and Africa Regtech Revenue (USD Million), by Type (2023-2030)
11.6.3 Middle East and Africa Regtech Revenue (USD Million), by Applications (2023-2030)
12 Methodology and Data Sources
12.1 Methodology/Research Approach
12.1.1 Research Programs/Design
12.1.2 Market Size Estimation
12.1.3 Market Breakdown and Data Triangulation
12.2 Data Sources
12.2.1 Secondary Sources
12.2.2 Primary Sources
12.3 Disclaimer
List of Tables
Table 1 Market Segmentation Analysis
Table 2 Global Regtech Market Companies with Areas Served
Table 3 Products Offerings Global Regtech Market
Table 4 Low Growth Scenario Forecasts
Table 5 Reference Case Growth Scenario
Table 6 High Growth Case Scenario
Table 7 Global Regtech Revenue (USD Million) And CAGR (%) By Type (2018-2030)
Table 8 Global Regtech Revenue (USD Million) And CAGR (%) By Applications (2018-2030)
Table 9 Global Regtech Revenue (USD Million) And CAGR (%) By Regions (2018-2030)
Table 10 Global Regtech Revenue (USD Million) By Type (2018-2022)
Table 11 Global Regtech Revenue Market Share (%) By Type (2018-2022)
Table 12 Global Regtech Revenue (USD Million) By Applications (2018-2022)
Table 13 Global Regtech Revenue Market Share (%) By Applications (2018-2022)
Table 14 Global Regtech Market Revenue (USD Million) By Regions (2018-2022)
Table 15 Global Regtech Market Share (%) By Regions (2018-2022)
Table 16 North America Regtech Revenue (USD Million) By Country (2018-2022)
Table 17 North America Regtech Revenue (USD Million) By Type (2018-2022)
Table 18 North America Regtech Revenue (USD Million) By Applications (2018-2022)
Table 19 Europe Regtech Revenue (USD Million) By Country (2018-2022)
Table 20 Europe Regtech Revenue (USD Million) By Type (2018-2022)
Table 21 Europe Regtech Revenue (USD Million) By Applications (2018-2022)
Table 22 Asia Pacific Regtech Revenue (USD Million) By Country (2018-2022)
Table 23 Asia Pacific Regtech Revenue (USD Million) By Type (2018-2022)
Table 24 Asia Pacific Regtech Revenue (USD Million) By Applications (2018-2022)
Table 25 South America Regtech Revenue (USD Million) By Country (2018-2022)
Table 26 South America Regtech Revenue (USD Million) By Type (2018-2022)
Table 27 South America Regtech Revenue (USD Million) By Applications (2018-2022)
Table 28 Middle East and Africa Regtech Revenue (USD Million) By Region (2018-2022)
Table 29 Middle East and Africa Regtech Revenue (USD Million) By Type (2018-2022)
Table 30 Middle East and Africa Regtech Revenue (USD Million) By Applications (2018-2022)
Table 31 Financial Analysis
Table 32 Global Regtech Revenue (USD Million) By Type (2023-2030)
Table 33 Global Regtech Revenue Market Share (%) By Type (2023-2030)
Table 34 Global Regtech Revenue (USD Million) By Applications (2023-2030)
Table 35 Global Regtech Revenue Market Share (%) By Applications (2023-2030)
Table 36 Global Regtech Market Revenue (USD Million), And Revenue (USD Million) By Regions (2023-2030)
Table 37 North America Regtech Revenue (USD)By Country (2023-2030)
Table 38 North America Regtech Revenue (USD Million) By Type (2023-2030)
Table 39 North America Regtech Revenue (USD Million) By Applications (2023-2030)
Table 40 Europe Regtech Revenue (USD Million) By Country (2023-2030)
Table 41 Europe Regtech Revenue (USD Million) By Type (2023-2030)
Table 42 Europe Regtech Revenue (USD Million) By Applications (2023-2030)
Table 43 Asia Pacific Regtech Revenue (USD Million) By Country (2023-2030)
Table 44 Asia Pacific Regtech Revenue (USD Million) By Type (2023-2030)
Table 45 Asia Pacific Regtech Revenue (USD Million) By Applications (2023-2030)
Table 46 South America Regtech Revenue (USD Million) By Country (2023-2030)
Table 47 South America Regtech Revenue (USD Million) By Type (2023-2030)
Table 48 South America Regtech Revenue (USD Million) By Applications (2023-2030)
Table 49 Middle East and Africa Regtech Revenue (USD Million) By Region (2023-2030)
Table 50 Middle East and Africa Regtech Revenue (USD Million) By Region (2023-2030)
Table 51 Middle East and Africa Regtech Revenue (USD Million) By Type (2023-2030)
Table 52 Middle East and Africa Regtech Revenue (USD Million) By Applications (2023-2030)
Table 53 Research Programs/Design for This Report
Table 54 Key Data Information from Secondary Sources
Table 55 Key Data Information from Primary Sources
List of Figures
Figure 1 Market Scope
Figure 2 Porter’s Five Forces
Figure 3 Global Regtech Revenue (USD Million) By Type (2018-2022)
Figure 4 Global Regtech Revenue Market Share (%) By Type (2022)
Figure 5 Global Regtech Revenue (USD Million) By Applications (2018-2022)
Figure 6 Global Regtech Revenue Market Share (%) By Applications (2022)
Figure 7 Global Regtech Market Revenue (USD Million) By Regions (2018-2022)
Figure 8 Global Regtech Market Share (%) By Regions (2022)
Figure 9 North America Regtech Revenue (USD Million) By Country (2018-2022)
Figure 10 North America Regtech Revenue (USD Million) By Type (2018-2022)
Figure 11 North America Regtech Revenue (USD Million) By Applications (2018-2022)
Figure 12 Europe Regtech Revenue (USD Million) By Country (2018-2022)
Figure 13 Europe Regtech Revenue (USD Million) By Type (2018-2022)
Figure 14 Europe Regtech Revenue (USD Million) By Applications (2018-2022)
Figure 15 Asia Pacific Regtech Revenue (USD Million) By Country (2018-2022)
Figure 16 Asia Pacific Regtech Revenue (USD Million) By Type (2018-2022)
Figure 17 Asia Pacific Regtech Revenue (USD Million) By Applications (2018-2022)
Figure 18 South America Regtech Revenue (USD Million) By Country (2018-2022)
Figure 19 South America Regtech Revenue (USD Million) By Type (2018-2022)
Figure 20 South America Regtech Revenue (USD Million) By Applications (2018-2022)
Figure 21 Middle East and Africa Regtech Revenue (USD Million) By Region (2018-2022)
Figure 22 Middle East and Africa Regtech Revenue (USD Million) By Type (2018-2022)
Figure 23 Middle East and Africa Regtech Revenue (USD Million) By Applications (2018-2022)
Figure 24 Global Regtech Revenue (USD Million) By Type (2023-2030)
Figure 25 Global Regtech Revenue Market Share (%) By Type (2030)
Figure 26 Global Regtech Revenue (USD Million) By Applications (2023-2030)
Figure 27 Global Regtech Revenue Market Share (%) By Applications (2030)
Figure 28 Global Regtech Market Revenue (USD Million) By Regions (2023-2030)
Figure 29 North America Regtech Revenue (USD Million) By Country (2023-2030)
Figure 30 North America Regtech Revenue (USD Million) By Type (2023-2030)
Figure 31 North America Regtech Revenue (USD Million) By Applications (2023-2030)
Figure 32 Europe Regtech Revenue (USD Million) By Country (2023-2030)
Figure 33 Europe Regtech Revenue (USD Million) By Type (2023-2030)
Figure 34 Europe Regtech Revenue (USD Million) By Applications (2023-2030)
Figure 35 Asia Pacific Regtech Revenue (USD Million) By Country (2023-2030)
Figure 36 Asia Pacific Regtech Revenue (USD Million) By Type (2023-2030)
Figure 37 Asia Pacific Regtech Revenue (USD Million) By Applications (2023-2030)
Figure 38 South America Regtech Revenue (USD Million) By Country (2023-2030)
Figure 39 South America Regtech Revenue (USD Million) By Type (2023-2030)
Figure 40 South America Regtech Revenue (USD Million) By Applications (2023-2030)
Figure 41 Middle East and Africa Regtech Revenue (USD Million) By Region (2023-2030)
Figure 42 Middle East and Africa Regtech Revenue (USD Million) By Region (2023-2030)
Figure 43 Middle East and Africa Regtech Revenue (USD Million) By Type (2023-2030)
Figure 44 Middle East and Africa Regtech Revenue (USD Million) By Applications (2023-2030)
Figure 45 Bottom-Up and Top-Down Approaches for This Report
Figure 46 Data Triangulation
