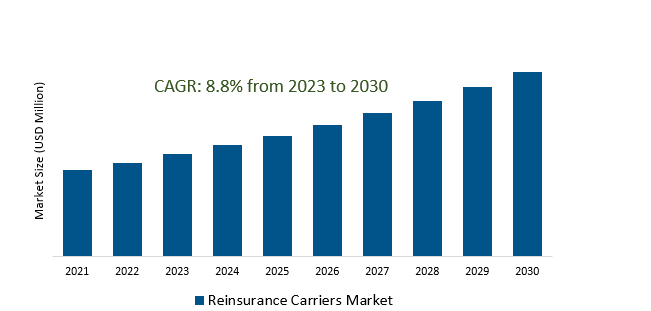
The Reinsurance Carriers Market Size is estimated to register 8.8% growth over the forecast period from 2023 to 2030.
Reinsurance Carriers Market Overview
The rise in frequency and severity of natural disasters, such as hurricanes, wildfires, and floods, along with other catastrophic events, drives the demand for market growth. The rise of new and emerging risks, such as cyber threats, climate change-related risks, and pandemic exposures are driving the demand. Reinsurance carriers are increasingly adopting innovative risk transfer strategies to manage and spread risks effectively including the use of alternative capital sources, such as catastrophe bonds, sidecars, and insurance-linked securities, to diversify risk portfolios. Further, the globalization of risks and insurance markets are prompting reinsurance carriers to expand their geographical presence and product offerings, capitalizing on growth opportunities in emerging markets. Increasing demand for specialized insurance products, such as cyber insurance, parametric insurance, and other alternative risk transfer solutions are propelling the market demand.
Reinsurance Carriers Market Dynamics
Market Trends- Focus on Risk Transfer Strategies in the Reinsurance Carriers Market.
The utilization of alternative risk transfer mechanisms, such as catastrophe bonds, collateralized reinsurance, and insurance-linked securities are driving the market growth.
Reinsurers are actively exploring strategies to spread risks more efficiently, collaborating with primary insurers to offload specific risks and improve overall risk management capabilities.
Further, the market is driven by greater risk resilience, flexibility, and the creation of new risk transfer mechanisms tailored to meet evolving market demands and uncertainties.
Market Driver- Emerging Risks and Complexities drives the Reinsurance Carriers Market.
The challenge of addressing various emerging risks, including cyber threats, climate change-related perils, and pandemic exposures are the key factors.
Reinsurance carriers are playing a pivotal role in partnering with primary insurers in offering effective risk mitigation strategies, evolving to meet the demands posed by new and intricate risk landscapes.
The ability to adapt to and anticipate emerging risks, allowing reinsurers to stay ahead in addressing new and intricate risk landscapes, offering solutions aligned with evolving market demands are fueling the demand.
Market Opportunity- Collaborative Innovation and Ecosystem Development in Reinsurance Carriers Market.
Reinsurers are increasingly engaging in collaborative innovation efforts, partnering with insurtech firms, startups, and technology providers to harness innovative solutions.
The industry's push towards digital transformation acts as significant a driver for collaborative innovation. Further, Partnerships and ecosystems help them offer unique solutions and stay agile in responding to market demands.
The growing ecosystem development, fostering a network of interconnected entities, including primary insurers, brokers, technology providers, and clients are aiming to create value through synergistic collaborations and tailored offerings, thereby driving the market growth.
Market Share Analysis- Non-proportional Reinsurance will register the fastest growth.
The Reinsurance Carriers Market is analyzed across Facultative Reinsurance, Treaty Reinsurance, Proportional Reinsurance, Non-proportional Reinsurance & Others. Non-proportional Reinsurance is poised to register the fastest growth. There are various forms of non-proportional reinsurance, including excess of loss and stop-loss covers. Excess of loss reinsurance involves the reinsurer paying for losses above a specified amount, providing coverage for individual large claims or aggregate losses that surpass the agreed-upon threshold. Stop-loss covers offer protection when losses exceed a certain level within a defined period, allowing the primary insurer to limit its liability for such losses. It allows primary insurers to protect themselves from substantial or unexpected losses, providing a financial safeguard against severe events that could otherwise significantly impact their financial stability. Reinsurance carriers offer non-proportional reinsurance arrangements to manage risks beyond certain thresholds, ensuring that catastrophic or unusually large losses do not disproportionately affect the primary insurer's financial reserves.
Market Share Analysis- Direct Writing held a significant market share in 2023.
The Reinsurance Carriers Market is analyzed across various applications including Agency and Broker, Bancassurance, Direct Writing & Others. Of these, Direct Writing held a significant market share in 2023. In this model, the primary insurer retains all the risk associated with the policies it writes and does not transfer a portion of that risk to reinsurers through reinsurance arrangements. Direct writing allows the primary insurer to fully retain control over its underwriting decisions, risk assessment, and claims management processes. By directly underwriting policies, the insurer assumes the financial responsibility for losses that occur within the covered policies, without sharing these risks with external reinsurers. Direct writing signifies that the primary insurer is solely responsible for assessing risks and managing claims without the support of external reinsurance. Further, they offer benefits such as increased autonomy for the primary insurer in setting pricing and coverage terms, more direct interaction with policyholders, and potential cost savings by bypassing reinsurance costs.
Reinsurance Carriers Market Segmentation
By Type
- Facultative Reinsurance
- Treaty Reinsurance
- Proportional Reinsurance
- Non-proportional Reinsurance
- Others
By Application
- Agency and Broker
- Bancassurance
- Direct Writing
- Others
By Region
- North America (United States, Canada, Mexico)
- Europe (Germany, France, United Kingdom, Spain, Italy, Others)
- Asia Pacific (China, India, Japan, South Korea, Australia, Others)
- Latin America (Brazil, Argentina, Others)
- Middle East and Africa (Saudi Arabia, UAE, Kuwait, Other Middle East, South Africa, Nigeria, Other Africa)
Reinsurance Carriers Market Companies
- Swiss Re Ltd (Switzerland)
- Berkshire Hathaway Inc (United States)
- China Reinsurance Corporation (China)
- SCOR S.E. (France)
- PartnerRe Ltd (Bermuda)
- Transatlantic Holdings Inc (United States)
- Munich Reinsurance Company (Germany)
- Sompo International Holdings Ltd (Bermuda)
- The Toa Reinsurance Company Ltd (Japan)
- Axis Capital Holdings Ltd (Bermuda)
*List not exhaustive
Reinsurance Carriers Market Outlook 2023
1 Market Overview
1.1 Introduction to the Reinsurance Carriers Market
1.2 Scope of the Study
1.3 Research Objective
1.3.1 Key Market Scope and Segments
1.3.2 Players Covered
1.3.3 Years Considered
2 Executive Summary
2.1 2023 Reinsurance Carriers Industry- Market Statistics
3 Market Dynamics
3.1 Market Drivers
3.2 Market Challenges
3.3 Market Opportunities
3.4 Market Trends
4 Market Factor Analysis
4.1 Porter’s Five Forces
4.2 Market Entropy
4.2.1 Global Reinsurance Carriers Market Companies with Area Served
4.2.2 Products Offerings Global Reinsurance Carriers Market
5 COVID-19 Impact Analysis and Outlook Scenarios
5.1.1 Covid-19 Impact Analysis
5.1.2 post-COVID-19 Scenario- Low Growth Case
5.1.3 post-COVID-19 Scenario- Reference Growth Case
5.1.4 post-COVID-19 Scenario- Low Growth Case
6 Global Reinsurance Carriers Market Trends
6.1 Global Reinsurance Carriers Revenue (USD Million) and CAGR (%) by Type (2018-2030)
6.2 Global Reinsurance Carriers Revenue (USD Million) and CAGR (%) by Applications (2018-2030)
6.3 Global Reinsurance Carriers Revenue (USD Million) and CAGR (%) by regions (2018-2030)
7 Global Reinsurance Carriers Market Revenue (USD Million) by Type, and Applications (2018-2022)
7.1 Global Reinsurance Carriers Revenue (USD Million) by Type (2018-2022)
7.1.1 Global Reinsurance Carriers Revenue (USD Million), Market Share (%) by Type (2018-2022)
7.2 Global Reinsurance Carriers Revenue (USD Million) by Applications (2018-2022)
7.2.1 Global Reinsurance Carriers Revenue (USD Million), Market Share (%) by Applications (2018-2022)
8 Global Reinsurance Carriers Development Regional Status and Outlook
8.1 Global Reinsurance Carriers Revenue (USD Million) By Regions (2018-2022)
8.2 North America Reinsurance Carriers Revenue (USD Million) by Type, and Application (2018-2022)
8.2.1 North America Reinsurance Carriers Revenue (USD Million) by Country (2018-2022)
8.2.2 North America Reinsurance Carriers Revenue (USD Million) by Type (2018-2022)
8.2.3 North America Reinsurance Carriers Revenue (USD Million) by Applications (2018-2022)
8.3 Europe Reinsurance Carriers Revenue (USD Million), by Type, and Applications (USD Million) (2018-2022)
8.3.1 Europe Reinsurance Carriers Revenue (USD Million), by Country (2018-2022)
8.3.2 Europe Reinsurance Carriers Revenue (USD Million) by Type (2018-2022)
8.3.3 Europe Reinsurance Carriers Revenue (USD Million) by Applications (2018-2022)
8.4 Asia Pacific Reinsurance Carriers Revenue (USD Million), and Revenue (USD Million) by Type, and Applications (2018-2022)
8.4.1 Asia Pacific Reinsurance Carriers Revenue (USD Million) by Country (2018-2022)
8.4.2 Asia Pacific Reinsurance Carriers Revenue (USD Million) by Type (2018-2022)
8.4.3 Asia Pacific Reinsurance Carriers Revenue (USD Million) by Applications (2018-2022)
8.5 South America Reinsurance Carriers Revenue (USD Million), by Type, and Applications (2018-2022)
8.5.1 South America Reinsurance Carriers Revenue (USD Million), by Country (2018-2022)
8.5.2 South America Reinsurance Carriers Revenue (USD Million) by Type (2018-2022)
8.5.3 South America Reinsurance Carriers Revenue (USD Million) by Applications (2018-2022)
8.6 Middle East and Africa Reinsurance Carriers Revenue (USD Million), by Type, Technology, Application, Thickness (2018-2022)
8.6.1 Middle East and Africa Reinsurance Carriers Revenue (USD Million) by Country (2018-2022)
8.6.2 Middle East and Africa Reinsurance Carriers Revenue (USD Million) by Type (2018-2022)
8.6.3 Middle East and Africa Reinsurance Carriers Revenue (USD Million) by Applications (2018-2022)
9 Company Profiles
10 Global Reinsurance Carriers Market Revenue (USD Million), by Type, and Applications (2023-2030)
10.1 Global Reinsurance Carriers Revenue (USD Million) and Market Share (%) by Type (2023-2030)
10.1.1 Global Reinsurance Carriers Revenue (USD Million), and Market Share (%) by Type (2023-2030)
10.2 Global Reinsurance Carriers Revenue (USD Million) and Market Share (%) by Applications (2023-2030)
10.2.1 Global Reinsurance Carriers Revenue (USD Million), and Market Share (%) by Applications (2023-2030)
11 Global Reinsurance Carriers Development Regional Status and Outlook Forecast
11.1 Global Reinsurance Carriers Revenue (USD Million) By Regions (2023-2030)
11.2 North America Reinsurance Carriers Revenue (USD Million) by Type, and Applications (2023-2030)
11.2.1 North America Reinsurance Carriers Revenue (USD) Million by Country (2023-2030)
11.2.2 North America Reinsurance Carriers Revenue (USD Million), by Type (2023-2030)
11.2.3 North America Reinsurance Carriers Revenue (USD Million), Market Share (%) by Applications (2023-2030)
11.3 Europe Reinsurance Carriers Revenue (USD Million), by Type, and Applications (2023-2030)
11.3.1 Europe Reinsurance Carriers Revenue (USD Million), by Country (2023-2030)
11.3.2 Europe Reinsurance Carriers Revenue (USD Million), by Type (2023-2030)
11.3.3 Europe Reinsurance Carriers Revenue (USD Million), by Applications (2023-2030)
11.4 Asia Pacific Reinsurance Carriers Revenue (USD Million) by Type, and Applications (2023-2030)
11.4.1 Asia Pacific Reinsurance Carriers Revenue (USD Million), by Country (2023-2030)
11.4.2 Asia Pacific Reinsurance Carriers Revenue (USD Million), by Type (2023-2030)
11.4.3 Asia Pacific Reinsurance Carriers Revenue (USD Million), by Applications (2023-2030)
11.5 South America Reinsurance Carriers Revenue (USD Million), by Type, and Applications (2023-2030)
11.5.1 South America Reinsurance Carriers Revenue (USD Million), by Country (2023-2030)
11.5.2 South America Reinsurance Carriers Revenue (USD Million), by Type (2023-2030)
11.5.3 South America Reinsurance Carriers Revenue (USD Million), by Applications (2023-2030)
11.6 Middle East and Africa Reinsurance Carriers Revenue (USD Million), by Type, and Applications (2023-2030)
11.6.1 Middle East and Africa Reinsurance Carriers Revenue (USD Million), by region (2023-2030)
11.6.2 Middle East and Africa Reinsurance Carriers Revenue (USD Million), by Type (2023-2030)
11.6.3 Middle East and Africa Reinsurance Carriers Revenue (USD Million), by Applications (2023-2030)
12 Methodology and Data Sources
12.1 Methodology/Research Approach
12.1.1 Research Programs/Design
12.1.2 Market Size Estimation
12.1.3 Market Breakdown and Data Triangulation
12.2 Data Sources
12.2.1 Secondary Sources
12.2.2 Primary Sources
12.3 Disclaimer
List of Tables
Table 1 Market Segmentation Analysis
Table 2 Global Reinsurance Carriers Market Companies with Areas Served
Table 3 Products Offerings Global Reinsurance Carriers Market
Table 4 Low Growth Scenario Forecasts
Table 5 Reference Case Growth Scenario
Table 6 High Growth Case Scenario
Table 7 Global Reinsurance Carriers Revenue (USD Million) And CAGR (%) By Type (2018-2030)
Table 8 Global Reinsurance Carriers Revenue (USD Million) And CAGR (%) By Applications (2018-2030)
Table 9 Global Reinsurance Carriers Revenue (USD Million) And CAGR (%) By Regions (2018-2030)
Table 10 Global Reinsurance Carriers Revenue (USD Million) By Type (2018-2022)
Table 11 Global Reinsurance Carriers Revenue Market Share (%) By Type (2018-2022)
Table 12 Global Reinsurance Carriers Revenue (USD Million) By Applications (2018-2022)
Table 13 Global Reinsurance Carriers Revenue Market Share (%) By Applications (2018-2022)
Table 14 Global Reinsurance Carriers Market Revenue (USD Million) By Regions (2018-2022)
Table 15 Global Reinsurance Carriers Market Share (%) By Regions (2018-2022)
Table 16 North America Reinsurance Carriers Revenue (USD Million) By Country (2018-2022)
Table 17 North America Reinsurance Carriers Revenue (USD Million) By Type (2018-2022)
Table 18 North America Reinsurance Carriers Revenue (USD Million) By Applications (2018-2022)
Table 19 Europe Reinsurance Carriers Revenue (USD Million) By Country (2018-2022)
Table 20 Europe Reinsurance Carriers Revenue (USD Million) By Type (2018-2022)
Table 21 Europe Reinsurance Carriers Revenue (USD Million) By Applications (2018-2022)
Table 22 Asia Pacific Reinsurance Carriers Revenue (USD Million) By Country (2018-2022)
Table 23 Asia Pacific Reinsurance Carriers Revenue (USD Million) By Type (2018-2022)
Table 24 Asia Pacific Reinsurance Carriers Revenue (USD Million) By Applications (2018-2022)
Table 25 South America Reinsurance Carriers Revenue (USD Million) By Country (2018-2022)
Table 26 South America Reinsurance Carriers Revenue (USD Million) By Type (2018-2022)
Table 27 South America Reinsurance Carriers Revenue (USD Million) By Applications (2018-2022)
Table 28 Middle East and Africa Reinsurance Carriers Revenue (USD Million) By Region (2018-2022)
Table 29 Middle East and Africa Reinsurance Carriers Revenue (USD Million) By Type (2018-2022)
Table 30 Middle East and Africa Reinsurance Carriers Revenue (USD Million) By Applications (2018-2022)
Table 31 Financial Analysis
Table 32 Global Reinsurance Carriers Revenue (USD Million) By Type (2023-2030)
Table 33 Global Reinsurance Carriers Revenue Market Share (%) By Type (2023-2030)
Table 34 Global Reinsurance Carriers Revenue (USD Million) By Applications (2023-2030)
Table 35 Global Reinsurance Carriers Revenue Market Share (%) By Applications (2023-2030)
Table 36 Global Reinsurance Carriers Market Revenue (USD Million), And Revenue (USD Million) By Regions (2023-2030)
Table 37 North America Reinsurance Carriers Revenue (USD)By Country (2023-2030)
Table 38 North America Reinsurance Carriers Revenue (USD Million) By Type (2023-2030)
Table 39 North America Reinsurance Carriers Revenue (USD Million) By Applications (2023-2030)
Table 40 Europe Reinsurance Carriers Revenue (USD Million) By Country (2023-2030)
Table 41 Europe Reinsurance Carriers Revenue (USD Million) By Type (2023-2030)
Table 42 Europe Reinsurance Carriers Revenue (USD Million) By Applications (2023-2030)
Table 43 Asia Pacific Reinsurance Carriers Revenue (USD Million) By Country (2023-2030)
Table 44 Asia Pacific Reinsurance Carriers Revenue (USD Million) By Type (2023-2030)
Table 45 Asia Pacific Reinsurance Carriers Revenue (USD Million) By Applications (2023-2030)
Table 46 South America Reinsurance Carriers Revenue (USD Million) By Country (2023-2030)
Table 47 South America Reinsurance Carriers Revenue (USD Million) By Type (2023-2030)
Table 48 South America Reinsurance Carriers Revenue (USD Million) By Applications (2023-2030)
Table 49 Middle East and Africa Reinsurance Carriers Revenue (USD Million) By Region (2023-2030)
Table 50 Middle East and Africa Reinsurance Carriers Revenue (USD Million) By Region (2023-2030)
Table 51 Middle East and Africa Reinsurance Carriers Revenue (USD Million) By Type (2023-2030)
Table 52 Middle East and Africa Reinsurance Carriers Revenue (USD Million) By Applications (2023-2030)
Table 53 Research Programs/Design for This Report
Table 54 Key Data Information from Secondary Sources
Table 55 Key Data Information from Primary Sources
List of Figures
Figure 1 Market Scope
Figure 2 Porter’s Five Forces
Figure 3 Global Reinsurance Carriers Revenue (USD Million) By Type (2018-2022)
Figure 4 Global Reinsurance Carriers Revenue Market Share (%) By Type (2022)
Figure 5 Global Reinsurance Carriers Revenue (USD Million) By Applications (2018-2022)
Figure 6 Global Reinsurance Carriers Revenue Market Share (%) By Applications (2022)
Figure 7 Global Reinsurance Carriers Market Revenue (USD Million) By Regions (2018-2022)
Figure 8 Global Reinsurance Carriers Market Share (%) By Regions (2022)
Figure 9 North America Reinsurance Carriers Revenue (USD Million) By Country (2018-2022)
Figure 10 North America Reinsurance Carriers Revenue (USD Million) By Type (2018-2022)
Figure 11 North America Reinsurance Carriers Revenue (USD Million) By Applications (2018-2022)
Figure 12 Europe Reinsurance Carriers Revenue (USD Million) By Country (2018-2022)
Figure 13 Europe Reinsurance Carriers Revenue (USD Million) By Type (2018-2022)
Figure 14 Europe Reinsurance Carriers Revenue (USD Million) By Applications (2018-2022)
Figure 15 Asia Pacific Reinsurance Carriers Revenue (USD Million) By Country (2018-2022)
Figure 16 Asia Pacific Reinsurance Carriers Revenue (USD Million) By Type (2018-2022)
Figure 17 Asia Pacific Reinsurance Carriers Revenue (USD Million) By Applications (2018-2022)
Figure 18 South America Reinsurance Carriers Revenue (USD Million) By Country (2018-2022)
Figure 19 South America Reinsurance Carriers Revenue (USD Million) By Type (2018-2022)
Figure 20 South America Reinsurance Carriers Revenue (USD Million) By Applications (2018-2022)
Figure 21 Middle East and Africa Reinsurance Carriers Revenue (USD Million) By Region (2018-2022)
Figure 22 Middle East and Africa Reinsurance Carriers Revenue (USD Million) By Type (2018-2022)
Figure 23 Middle East and Africa Reinsurance Carriers Revenue (USD Million) By Applications (2018-2022)
Figure 24 Global Reinsurance Carriers Revenue (USD Million) By Type (2023-2030)
Figure 25 Global Reinsurance Carriers Revenue Market Share (%) By Type (2030)
Figure 26 Global Reinsurance Carriers Revenue (USD Million) By Applications (2023-2030)
Figure 27 Global Reinsurance Carriers Revenue Market Share (%) By Applications (2030)
Figure 28 Global Reinsurance Carriers Market Revenue (USD Million) By Regions (2023-2030)
Figure 29 North America Reinsurance Carriers Revenue (USD Million) By Country (2023-2030)
Figure 30 North America Reinsurance Carriers Revenue (USD Million) By Type (2023-2030)
Figure 31 North America Reinsurance Carriers Revenue (USD Million) By Applications (2023-2030)
Figure 32 Europe Reinsurance Carriers Revenue (USD Million) By Country (2023-2030)
Figure 33 Europe Reinsurance Carriers Revenue (USD Million) By Type (2023-2030)
Figure 34 Europe Reinsurance Carriers Revenue (USD Million) By Applications (2023-2030)
Figure 35 Asia Pacific Reinsurance Carriers Revenue (USD Million) By Country (2023-2030)
Figure 36 Asia Pacific Reinsurance Carriers Revenue (USD Million) By Type (2023-2030)
Figure 37 Asia Pacific Reinsurance Carriers Revenue (USD Million) By Applications (2023-2030)
Figure 38 South America Reinsurance Carriers Revenue (USD Million) By Country (2023-2030)
Figure 39 South America Reinsurance Carriers Revenue (USD Million) By Type (2023-2030)
Figure 40 South America Reinsurance Carriers Revenue (USD Million) By Applications (2023-2030)
Figure 41 Middle East and Africa Reinsurance Carriers Revenue (USD Million) By Region (2023-2030)
Figure 42 Middle East and Africa Reinsurance Carriers Revenue (USD Million) By Region (2023-2030)
Figure 43 Middle East and Africa Reinsurance Carriers Revenue (USD Million) By Type (2023-2030)
Figure 44 Middle East and Africa Reinsurance Carriers Revenue (USD Million) By Applications (2023-2030)
Figure 45 Bottom-Up and Top-Down Approaches for This Report
Figure 46 Data Triangulation
