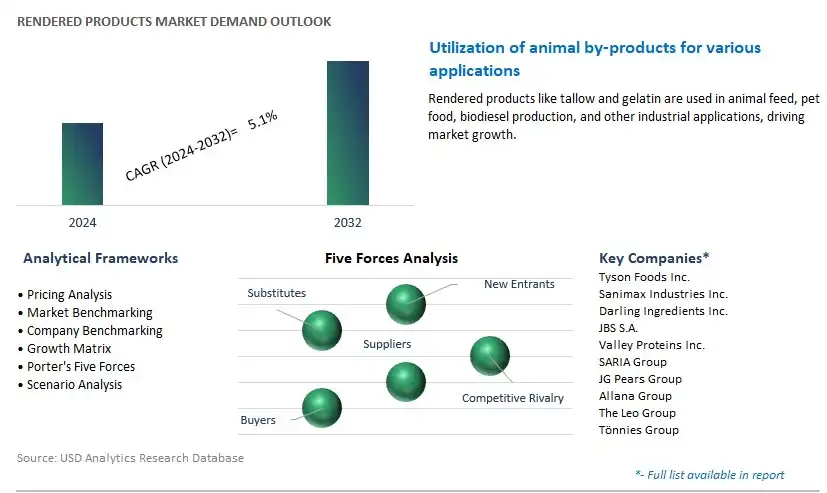
Rendered Products Market is estimated to increase at a growth rate of 5.1% CAGR over the forecast period from 2024 to 2030.
The Rendered Products Market Study forecasts the market size across 6 regions and 24 countries for diverse segments including-Type (Meat and Bone Meal, Feather Meal, Blood Meal, Liquified Fat, Grease, Others), Application (Biodiesel, Animal Feed, Chemical, Agriculture, Food and Beverages, Cosmetics), Source (Beef, Pork, Mutton, Poultry, Others).
An Introduction to Rendered Products Market, 2024
Rendered Products: The market for rendered products is driven by the demand for animal-derived ingredients used in various industries, including pet food, cosmetics, pharmaceuticals, and industrial applications. Drivers include the utilization of animal by-products, fats, and proteins from rendering processes. The market growth is influenced by animal protein consumption trends, sustainability initiatives, and the wide array of applications for rendered products in diverse sectors.
Rendered Products Market Trend: Sustainable Utilization of Animal By-Products
A prominent trend in the rendered products market is the increasing emphasis on sustainable utilization of animal by-products. Rendered products, derived from the processing of animal by-products such as fats, bones, and offal, are gaining traction as valuable ingredients in various industries. The trend leans towards maximizing the use of all parts of the animal, reducing waste, and contributing to sustainability efforts within the food, feed, and other industries that utilize rendered products.
Rendered Products Market Driver: Demand for Animal Protein Sources and Industrial Applications
A key driver propelling the rendered products market is the demand for animal protein sources and their diverse industrial applications. Rendered products, such as animal fats and proteins, are essential components in animal feed, pet food, biodiesel production, cosmetics, and pharmaceuticals. The increasing global demand for protein-rich ingredients and functional components derived from animal by-products drives the market, supporting the utilization of rendered products across multiple sectors.
Rendered Products Market Opportunity: Innovation in Value-Added Applications and Processing Techniques
An opportunity within the rendered products market lies in innovating value-added applications and refining processing techniques. Developing novel applications or value-added products from rendered materials, such as specialized animal feeds with enhanced nutritional profiles or high-value pharmaceutical-grade extracts, presents an opportunity for market expansion. Additionally, advancements in processing technologies aimed at improving efficiency, yield, and quality of rendered products could enhance competitiveness and open new avenues for utilization in diverse industries.
Rendered Products Market Segmentation
Type
Meat and Bone Meal
Feather Meal
Blood Meal
Liquified Fat
Grease
Others
Application
Biodiesel
Animal Feed
Chemical
Agriculture
Food and Beverages
Cosmetics
Source
Beef
Pork
Mutton
Poultry
Others
Geographical Segmentation
• North America (US, Canada, Mexico)
• Europe (Germany, UK, France, Spain, Italy, Russia, Rest of Europe)
• Asia Pacific (China, India, Japan, South Korea, South East Asia, Rest of Asia Pacific)
• South America (Brazil, Argentina, Rest of South America)
• Middle East and Africa (Saudi Arabia, UAE, Rest of Middle East, Egypt, South Africa, Nigeria, Rest of Africa)
Rendered Products Companies Profiled in the Study-
Tyson Foods, Inc.
Sanimax Industries Inc.
Darling Ingredients Inc.
JBS S.A.
Valley Proteins, Inc.
SARIA Group
JG Pears Group
Allana Group
The Leo Group
Tönnies Group
Reasons to Buy the Rendered Products Market Study
• Deepen your industry insights and navigate uncertainties for strategy formulation, CAPEX, and Operational decisions
• Gain access to detailed insights on the Rendered Products Market, encompassing current market size, growth trends, and forecasts till 2030.
• Access detailed competitor analysis, enabling competitive advantage through a thorough understanding of market players, strategies, and potential differentiation opportunities
• Stay ahead of the curve with insights on technological advancements, innovations, and upcoming trends
• Identify lucrative investment avenues and expansion opportunities within the Rendered Products Market industry, guided by robust, data-backed analysis.
• Understand regional and global markets through country-wise analysis, regional market potential, regulatory nuances, and dynamics
• Execute strategies with confidence and speed through information, analytics, and insights on the industry value chain
• Corporate leaders, strategists, financial experts, shareholders, asset managers, and governmental representatives can make long-term planning scenarios and build an integrated and timely understanding of market dynamics
• Benefit from tailored solutions and expert consultation based on report insights, providing personalized strategies aligned with specific business needs.
TABLE OF CONTENTS
1 Introduction To 2024 Rendered Products Markets
1.1 Market Overview
1.2 Quick Facts
1.3 Scope/Objective of the Study
1.4 Market Definition
1.5 Countries and Regions Included
1.6 Units, Currency, and Conversions
1.7 Industry Value Chain
2 Research Methodology
2.1 Market Size Estimation
2.2 Sources and Research Methodology
2.3 Data Triangulation
2.4 Assumptions and Limitations
3 Executive Summary
3.1 Global Rendered Products Market Size Outlook, $ Million, 2021 to 2030
3.2 Rendered Products Market Outlook by Type, $ Million, 2021 to 2030
3.3 Rendered Products Market Outlook by Product, $ Million, 2021 to 2030
3.4 Rendered Products Market Outlook by Application, $ Million, 2021 to 2030
3.5 Rendered Products Market Outlook by Key Countries, $ Million, 2021 to 2030
4 Market Dynamics
4.1 Key Driving Forces of Rendered Products Industry
4.2 Key Market Trends in Rendered Products Industry
4.3 Potential Opportunities in Rendered Products Industry
4.4 Key Challenges in Rendered Products Industry
5 Market Factor Analysis
5.1 Competitive Landscape
5.1.1 Global Rendered Products Market Share by Company
5.1.2 Product Offerings by Company
5.2 Porter’s Five Forces Analysis
6 Growth Outlook Across Scenarios
6.1 Growth Analysis-Case Scenario Definitions
6.2 Low Growth Scenario Forecasts
6.3 Reference Growth Scenario Forecasts
6.4 High Growth Scenario Forecasts
7 Global Rendered Products Market Outlook by Segments
7.1 Rendered Products Market Outlook by Segments
Type
Meat and Bone Meal
Feather Meal
Blood Meal
Liquified Fat
Grease
Others
Application
Biodiesel
Animal Feed
Chemical
Agriculture
Food and Beverages
Cosmetics
Source
Beef
Pork
Mutton
Poultry
Others
8 North America Rendered Products Market Analysis and Outlook To 2030
8.1 Introduction to North America Rendered Products Markets in 2024
8.2 North America Rendered Products Market Size Outlook by Country, 2021-2030
8.2.1 United States
8.2.2 Canada
8.2.3 Mexico
8.3 North America Rendered Products Market size Outlook by Segments, 2021-2030
Type
Meat and Bone Meal
Feather Meal
Blood Meal
Liquified Fat
Grease
Others
Application
Biodiesel
Animal Feed
Chemical
Agriculture
Food and Beverages
Cosmetics
Source
Beef
Pork
Mutton
Poultry
Others
9 Europe Rendered Products Market Analysis and Outlook To 2030
9.1 Introduction to Europe Rendered Products Markets in 2024
9.2 Europe Rendered Products Market Size Outlook by Country, 2021-2030
9.2.1 Germany
9.2.2 France
9.2.3 Spain
9.2.4 United Kingdom
9.2.4 Italy
9.2.5 Russia
9.2.6 Norway
9.2.7 Rest of Europe
9.3 Europe Rendered Products Market size Outlook by Segments, 2021-2030
Type
Meat and Bone Meal
Feather Meal
Blood Meal
Liquified Fat
Grease
Others
Application
Biodiesel
Animal Feed
Chemical
Agriculture
Food and Beverages
Cosmetics
Source
Beef
Pork
Mutton
Poultry
Others
10 Asia Pacific Rendered Products Market Analysis and Outlook To 2030
10.1 Introduction to Asia Pacific Rendered Products Markets in 2024
10.2 Asia Pacific Rendered Products Market Size Outlook by Country, 2021-2030
10.2.1 China
10.2.2 India
10.2.3 Japan
10.2.4 South Korea
10.2.5 Indonesia
10.2.6 Malaysia
10.2.7 Australia
10.2.8 Rest of Asia Pacific
10.3 Asia Pacific Rendered Products Market size Outlook by Segments, 2021-2030
Type
Meat and Bone Meal
Feather Meal
Blood Meal
Liquified Fat
Grease
Others
Application
Biodiesel
Animal Feed
Chemical
Agriculture
Food and Beverages
Cosmetics
Source
Beef
Pork
Mutton
Poultry
Others
11 South America Rendered Products Market Analysis and Outlook To 2030
11.1 Introduction to South America Rendered Products Markets in 2024
11.2 South America Rendered Products Market Size Outlook by Country, 2021-2030
11.2.1 Brazil
11.2.2 Argentina
11.2.3 Rest of South America
11.3 South America Rendered Products Market size Outlook by Segments, 2021-2030
Type
Meat and Bone Meal
Feather Meal
Blood Meal
Liquified Fat
Grease
Others
Application
Biodiesel
Animal Feed
Chemical
Agriculture
Food and Beverages
Cosmetics
Source
Beef
Pork
Mutton
Poultry
Others
12 Middle East and Africa Rendered Products Market Analysis and Outlook To 2030
12.1 Introduction to Middle East and Africa Rendered Products Markets in 2024
12.2 Middle East and Africa Rendered Products Market Size Outlook by Country, 2021-2030
12.2.1 Saudi Arabia
12.2.2 UAE
12.2.3 Oman
12.2.4 Rest of Middle East
12.2.5 Egypt
12.2.6 Nigeria
12.2.7 South Africa
12.2.8 Rest of Africa
12.3 Middle East and Africa Rendered Products Market size Outlook by Segments, 2021-2030
Type
Meat and Bone Meal
Feather Meal
Blood Meal
Liquified Fat
Grease
Others
Application
Biodiesel
Animal Feed
Chemical
Agriculture
Food and Beverages
Cosmetics
Source
Beef
Pork
Mutton
Poultry
Others
List of Companies
Tyson Foods, Inc.
Sanimax Industries Inc.
Darling Ingredients Inc.
JBS S.A.
Valley Proteins, Inc.
SARIA Group
JG Pears Group
Allana Group
The Leo Group
Tönnies Group
13 Company Profiles
13.1 Company Snapshot
13.2 SWOT Profiles
13.3 Products and Services
13.4 Recent Developments
13.5 Financial Profile
14 Appendix
14.1 Customization Offerings
14.2 Subscription Services
14.3 Related Reports
14.4 Publisher Expertise
Type/brMeat and Bone Meal /brFeather Meal /brBlood Meal /brLiquified Fat /brGrease /brOthers /br/brApplication/brBiodiesel /brAnimal Feed /brChemical /brAgriculture /brFood and Beverages /brCosmetics /br/brSource /brBeef /brPork /brMutton /brPoultry /brOthers
