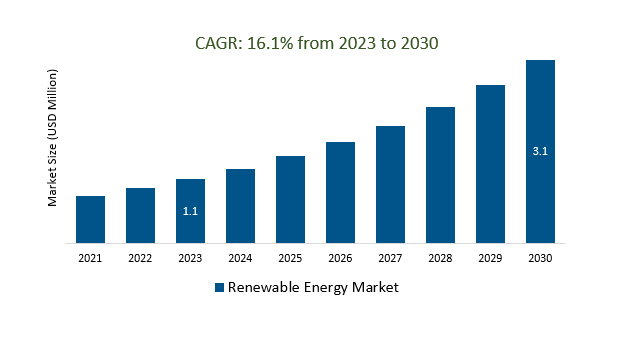
The Global renewable energy market Size is estimated to be US 1.1 Billion in 2023 and is poised to register 16.1% growth over the forecast period from 2023 to 2030 to reach US $ 3.1 billion in 2030.
The renewable energy market is driven by environmental concerns, energy security, cost competitiveness, government policies, technological advancements, energy storage, corporate sustainability goals, and trends. Environmental concerns drive adoption, while energy security enhances reliance on renewables. Technological advancements make renewable energy more accessible and practical. Companies are committing to using renewable energy as part of their sustainability strategies, driving demand for renewable power purchase agreements and certificates. Trends include decentralization, hybrid systems, grid integration, energy transition plans, green hydrogen, offshore wind, EV charging infrastructure, and the circular economy. Green hydrogen is gaining traction for transportation and industrial processes, offshore wind farms are emerging, and the shift towards electric vehicles is driving demand for clean electricity.
Addressing Environmental Concerns and Reducing Greenhouse Gas Emissions is boosting the market.
Addressing environmental concerns and reducing greenhouse gas emissions has become a paramount priority in recent years, driving significant growth in the renewable energy market. As the world grapples with the consequences of climate change, governments, businesses, and individuals are increasingly turning to renewable energy sources such as solar, wind, and hydropower. This surge in demand has led to technological advancements, increased investments, and favourable policies, creating a thriving industry that not only mitigates the environmental impact but also fosters economic growth. The renewable energy market's expansion not only offers sustainable alternatives to fossil fuels but also generates jobs, enhances energy security, and contributes to a more sustainable future for generations to come.
Government Policies and Incentives Boost Renewable Energy Adoption and Investment.
Government policies and incentives play a pivotal role in driving the rapid growth of renewable energy adoption and investment within the renewable energy market. These policies create a favourable environment by offering financial incentives, tax credits, and regulatory support to businesses and individuals who invest in renewable energy sources such as solar, wind, and hydropower. Additionally, government mandates and targets for renewable energy production encourage both public and private sectors to transition towards cleaner and sustainable energy solutions. These initiatives not only reduce greenhouse gas emissions but also stimulate economic growth by creating jobs in the renewable energy sector. As governments worldwide increasingly prioritize sustainability, their policies continue to drive innovation, attract investments, and pave the way for a greener and more sustainable energy future.
The Rise of Renewable Energy PPAs and RECs in Corporate Sustainability Goals is attracting a wide customer base.
The proliferation of Renewable Energy Power Purchase Agreements (PPAs) and Renewable Energy Certificates (RECs) within corporate sustainability initiatives has sparked a remarkable surge in interest and adoption across a diverse customer base within the renewable energy market. As companies increasingly prioritize sustainability goals, they are actively seeking ways to reduce their carbon footprint and transition to cleaner energy sources. PPAs enable businesses to secure a stable supply of renewable energy, often through long-term contracts with renewable energy producers, while RECs certify and track the environmental attributes of renewable energy generation. This trend not only aligns with corporate sustainability targets but also serves as a significant driver for the growth of the renewable energy sector, ultimately contributing to a greener and more sustainable future.
Market Share Analysis:
Solar Power and Wind Power are the most dominant renewable energy sources.
Solar power and wind power stand out as the most dominant renewable energy sources in the global energy landscape. Solar power harnesses the energy from the sun through photovoltaic panels or solar thermal systems, providing a clean and abundant source of electricity. It is highly versatile, with applications ranging from rooftop solar panels on residential buildings to massive solar farms in sun-rich regions. Solar power's popularity is driven by its accessibility, scalability, and decreasing costs over the years, making it a reliable choice for both individuals and utilities. On the other hand, wind power relies on the kinetic energy of moving air to generate electricity through wind turbines. Wind power has rapidly gained traction as one of the most scalable and efficient renewable energy sources, particularly in regions with consistent wind patterns, such as coastal areas and open plains. Advances in wind turbine technology have led to increased efficiency and the ability to harness energy even in lower wind speeds. Additionally, wind power complements solar power by producing energy during different times of the day and in varying weather conditions, enhancing the reliability of renewable energy generation. Together, solar power and wind power form a powerful duo in the transition towards cleaner and more sustainable energy systems, contributing significantly to reducing greenhouse gas emissions, mitigating climate change, and fostering energy independence. Their continued growth and dominance in the renewable energy sector are underpinned by ongoing technological advancements, favourable government policies, and the increasing global emphasis on decarbonization and sustainable energy sources.
Industrial is the most dominant application in the renewable energy market.
The prominence can be attributed to several compelling factors. Firstly, industries have a substantial appetite for energy due to their complex operations and high energy demands, making them eager adopters of renewable energy solutions to reduce their environmental footprint and operational costs. Secondly, as sustainability becomes an integral part of corporate social responsibility, industries are increasingly committed to meeting renewable energy targets and reducing greenhouse gas emissions. This drive has led to significant investments in renewable energy infrastructure, such as solar panels, wind turbines, and biomass facilities, to power manufacturing plants and facilities. Furthermore, government incentives, tax credits, and renewable energy mandates have incentivized industries to transition toward clean energy sources. The growing availability of advanced technologies, energy storage solutions, and grid integration capabilities has also made it more feasible for industries to harness the benefits of renewable energy while ensuring a stable and uninterrupted power supply for their operations. In summary, the industrial sector's dominance in the renewable energy market stems from its substantial energy requirements, commitment to sustainability, policy support, and advancements in renewable energy technologies.
The Asia-Pacific region holds a dominant position in the renewable energy market.
Rapid economic growth and urbanization have fuelled the demand for electricity, while the region benefits from abundant renewable energy resources like solar and wind power. Government support for renewable energy development further reinforces its leading role. This trend is expected to persist in the years ahead, driven by robust economic growth, ongoing availability of renewable resources, and continued governmental backing. Additional contributors to this growth include decreasing costs of renewable technologies, heightened environmental awareness, and rising demand for sustainable energy from both businesses and consumers.
Renewable Energy Market Segmentation
By Type
- Hydropower
- Wind Power
- Solar Power
- Bioenergy
- Others
By Application
- Industrial
- Residential
- Commercial
By Region
- North America (United States, Canada, Mexico)
- Europe (Germany, France, United Kingdom, Spain, Italy, Others)
- Asia Pacific (China, India, Japan, South Korea, Australia, Others)
- Latin America (Brazil, Argentina, Others)
- Middle East and Africa (Saudi Arabia, UAE, Kuwait, Other Middle East, South Africa, Nigeria, Other Africa)
Renewable Energy Market Companies
- General Electric
- ABB
- Acconia S.A.
- Enel Spa
- Tata Power
- Innergex
- Invenergy
- Schneider Electric
- Siemens Gamesa Renewable Energy, S.A.
- Suzlon Energy Ltd.
*List not exhaustive
Renewable Energy Market Outlook 2023
1 Market Overview
1.1 Introduction to the Renewable Energy Market
1.2 Scope of the Study
1.3 Research Objective
1.3.1 Key Market Scope and Segments
1.3.2 Players Covered
1.3.3 Years Considered
2 Executive Summary
2.1 2023 Renewable Energy Industry- Market Statistics
3 Market Dynamics
3.1 Market Drivers
3.2 Market Challenges
3.3 Market Opportunities
3.4 Market Trends
4 Market Factor Analysis
4.1 Porter’s Five Forces
4.2 Market Entropy
4.2.1 Global Renewable Energy Market Companies with Area Served
4.2.2 Products Offerings Global Renewable Energy Market
5 COVID-19 Impact Analysis and Outlook Scenarios
5.1.1 Covid-19 Impact Analysis
5.1.2 Post-COVID-19 Scenario- Low Growth Case
5.1.3 Post-COVID-19 Scenario- Reference Growth Case
5.1.4 Post-COVID-19 Scenario- Low Growth Case
6 Global Renewable Energy Market Trends
6.1 Global Renewable Energy Revenue (USD Million) and CAGR (%) by Type (2018-2030)
6.2 Global Renewable Energy Revenue (USD Million) and CAGR (%) by Applications (2018-2030)
6.3 Global Renewable Energy Revenue (USD Million) and CAGR (%) by Regions (2018-2030)
7 Global Renewable Energy Market Revenue (USD Million) by Type, and Applications (2018-2022)
7.1 Global Renewable Energy Revenue (USD Million) by Type (2018-2022)
7.1.1 Global Renewable Energy Revenue (USD Million), Market Share (%) by Type (2018-2022)
7.2 Global Renewable Energy Revenue (USD Million) by Applications (2018-2022)
7.2.1 Global Renewable Energy Revenue (USD Million), Market Share (%) by Applications (2018-2022)
8 Global Renewable Energy Development Regional Status and Outlook
8.1 Global Renewable Energy Revenue (USD Million) By Regions (2018-2022)
8.2 North America Renewable Energy Revenue (USD Million) by Type, and Application (2018-2022)
8.2.1 North America Renewable Energy Revenue (USD Million) by Country (2018-2022)
8.2.2 North America Renewable Energy Revenue (USD Million) by Type (2018-2022)
8.2.3 North America Renewable Energy Revenue (USD Million) by Applications (2018-2022)
8.3 Europe Renewable Energy Revenue (USD Million), by Type, and Applications (USD Million) (2018-2022)
8.3.1 Europe Renewable Energy Revenue (USD Million), by Country (2018-2022)
8.3.2 Europe Renewable Energy Revenue (USD Million) by Type (2018-2022)
8.3.3 Europe Renewable Energy Revenue (USD Million) by Applications (2018-2022)
8.4 Asia Pacific Renewable Energy Revenue (USD Million), and Revenue (USD Million) by Type, and Applications (2018-2022)
8.4.1 Asia Pacific Renewable Energy Revenue (USD Million) by Country (2018-2022)
8.4.2 Asia Pacific Renewable Energy Revenue (USD Million) by Type (2018-2022)
8.4.3 Asia Pacific Renewable Energy Revenue (USD Million) by Applications (2018-2022)
8.5 South America Renewable Energy Revenue (USD Million), by Type, and Applications (2018-2022)
8.5.1 South America Renewable Energy Revenue (USD Million), by Country (2018-2022)
8.5.2 South America Renewable Energy Revenue (USD Million) by Type (2018-2022)
8.5.3 South America Renewable Energy Revenue (USD Million) by Applications (2018-2022)
8.6 Middle East and Africa Renewable Energy Revenue (USD Million), by Type, Technology, Application, Thickness (2018-2022)
8.6.1 Middle East and Africa Renewable Energy Revenue (USD Million) by Country (2018-2022)
8.6.2 Middle East and Africa Renewable Energy Revenue (USD Million) by Type (2018-2022)
8.6.3 Middle East and Africa Renewable Energy Revenue (USD Million) by Applications (2018-2022)
9 Company Profiles
10 Global Renewable Energy Market Revenue (USD Million), by Type, and Applications (2023-2030)
10.1 Global Renewable Energy Revenue (USD Million) and Market Share (%) by Type (2023-2030)
10.1.1 Global Renewable Energy Revenue (USD Million), and Market Share (%) by Type (2023-2030)
10.2 Global Renewable Energy Revenue (USD Million) and Market Share (%) by Applications (2023-2030)
10.2.1 Global Renewable Energy Revenue (USD Million), and Market Share (%) by Applications (2023-2030)
11 Global Renewable Energy Development Regional Status and Outlook Forecast
11.1 Global Renewable Energy Revenue (USD Million) By Regions (2023-2030)
11.2 North America Renewable Energy Revenue (USD Million) by Type, and Applications (2023-2030)
11.2.1 North America Renewable Energy Revenue (USD) Million by Country (2023-2030)
11.2.2 North America Renewable Energy Revenue (USD Million), by Type (2023-2030)
11.2.3 North America Renewable Energy Revenue (USD Million), Market Share (%) by Applications (2023-2030)
11.3 Europe Renewable Energy Revenue (USD Million), by Type, and Applications (2023-2030)
11.3.1 Europe Renewable Energy Revenue (USD Million), by Country (2023-2030)
11.3.2 Europe Renewable Energy Revenue (USD Million), by Type (2023-2030)
11.3.3 Europe Renewable Energy Revenue (USD Million), by Applications (2023-2030)
11.4 Asia Pacific Renewable Energy Revenue (USD Million) by Type, and Applications (2023-2030)
11.4.1 Asia Pacific Renewable Energy Revenue (USD Million), by Country (2023-2030)
11.4.2 Asia Pacific Renewable Energy Revenue (USD Million), by Type (2023-2030)
11.4.3 Asia Pacific Renewable Energy Revenue (USD Million), by Applications (2023-2030)
11.5 South America Renewable Energy Revenue (USD Million), by Type, and Applications (2023-2030)
11.5.1 South America Renewable Energy Revenue (USD Million), by Country (2023-2030)
11.5.2 South America Renewable Energy Revenue (USD Million), by Type (2023-2030)
11.5.3 South America Renewable Energy Revenue (USD Million), by Applications (2023-2030)
11.6 Middle East and Africa Renewable Energy Revenue (USD Million), by Type, and Applications (2023-2030)
11.6.1 Middle East and Africa Renewable Energy Revenue (USD Million), by Region (2023-2030)
11.6.2 Middle East and Africa Renewable Energy Revenue (USD Million), by Type (2023-2030)
11.6.3 Middle East and Africa Renewable Energy Revenue (USD Million), by Applications (2023-2030)
12 Methodology and Data Sources
12.1 Methodology/Research Approach
12.1.1 Research Programs/Design
12.1.2 Market Size Estimation
12.1.3 Market Breakdown and Data Triangulation
12.2 Data Sources
12.2.1 Secondary Sources
12.2.2 Primary Sources
12.3 Disclaimer
List of Tables
Table 1 Market Segmentation Analysis
Table 2 Global Renewable Energy Market Companies with Areas Served
Table 3 Products Offerings Global Renewable Energy Market
Table 4 Low Growth Scenario Forecasts
Table 5 Reference Case Growth Scenario
Table 6 High Growth Case Scenario
Table 7 Global Renewable Energy Revenue (USD Million) And CAGR (%) By Type (2018-2030)
Table 8 Global Renewable Energy Revenue (USD Million) And CAGR (%) By Applications (2018-2030)
Table 9 Global Renewable Energy Revenue (USD Million) And CAGR (%) By Regions (2018-2030)
Table 10 Global Renewable Energy Revenue (USD Million) By Type (2018-2022)
Table 11 Global Renewable Energy Revenue Market Share (%) By Type (2018-2022)
Table 12 Global Renewable Energy Revenue (USD Million) By Applications (2018-2022)
Table 13 Global Renewable Energy Revenue Market Share (%) By Applications (2018-2022)
Table 14 Global Renewable Energy Market Revenue (USD Million) By Regions (2018-2022)
Table 15 Global Renewable Energy Market Share (%) By Regions (2018-2022)
Table 16 North America Renewable Energy Revenue (USD Million) By Country (2018-2022)
Table 17 North America Renewable Energy Revenue (USD Million) By Type (2018-2022)
Table 18 North America Renewable Energy Revenue (USD Million) By Applications (2018-2022)
Table 19 Europe Renewable Energy Revenue (USD Million) By Country (2018-2022)
Table 20 Europe Renewable Energy Revenue (USD Million) By Type (2018-2022)
Table 21 Europe Renewable Energy Revenue (USD Million) By Applications (2018-2022)
Table 22 Asia Pacific Renewable Energy Revenue (USD Million) By Country (2018-2022)
Table 23 Asia Pacific Renewable Energy Revenue (USD Million) By Type (2018-2022)
Table 24 Asia Pacific Renewable Energy Revenue (USD Million) By Applications (2018-2022)
Table 25 South America Renewable Energy Revenue (USD Million) By Country (2018-2022)
Table 26 South America Renewable Energy Revenue (USD Million) By Type (2018-2022)
Table 27 South America Renewable Energy Revenue (USD Million) By Applications (2018-2022)
Table 28 Middle East and Africa Renewable Energy Revenue (USD Million) By Region (2018-2022)
Table 29 Middle East and Africa Renewable Energy Revenue (USD Million) By Type (2018-2022)
Table 30 Middle East and Africa Renewable Energy Revenue (USD Million) By Applications (2018-2022)
Table 31 Financial Analysis
Table 32 Global Renewable Energy Revenue (USD Million) By Type (2023-2030)
Table 33 Global Renewable Energy Revenue Market Share (%) By Type (2023-2030)
Table 34 Global Renewable Energy Revenue (USD Million) By Applications (2023-2030)
Table 35 Global Renewable Energy Revenue Market Share (%) By Applications (2023-2030)
Table 36 Global Renewable Energy Market Revenue (USD Million), And Revenue (USD Million) By Regions (2023-2030)
Table 37 North America Renewable Energy Revenue (USD)By Country (2023-2030)
Table 38 North America Renewable Energy Revenue (USD Million) By Type (2023-2030)
Table 39 North America Renewable Energy Revenue (USD Million) By Applications (2023-2030)
Table 40 Europe Renewable Energy Revenue (USD Million) By Country (2023-2030)
Table 41 Europe Renewable Energy Revenue (USD Million) By Type (2023-2030)
Table 42 Europe Renewable Energy Revenue (USD Million) By Applications (2023-2030)
Table 43 Asia Pacific Renewable Energy Revenue (USD Million) By Country (2023-2030)
Table 44 Asia Pacific Renewable Energy Revenue (USD Million) By Type (2023-2030)
Table 45 Asia Pacific Renewable Energy Revenue (USD Million) By Applications (2023-2030)
Table 46 South America Renewable Energy Revenue (USD Million) By Country (2023-2030)
Table 47 South America Renewable Energy Revenue (USD Million) By Type (2023-2030)
Table 48 South America Renewable Energy Revenue (USD Million) By Applications (2023-2030)
Table 49 Middle East and Africa Renewable Energy Revenue (USD Million) By Region (2023-2030)
Table 50 Middle East and Africa Renewable Energy Revenue (USD Million) By Region (2023-2030)
Table 51 Middle East and Africa Renewable Energy Revenue (USD Million) By Type (2023-2030)
Table 52 Middle East and Africa Renewable Energy Revenue (USD Million) By Applications (2023-2030)
Table 53 Research Programs/Design for This Report
Table 54 Key Data Information from Secondary Sources
Table 55 Key Data Information from Primary Sources
List of Figures
Figure 1 Market Scope
Figure 2 Porter’s Five Forces
Figure 3 Global Renewable Energy Revenue (USD Million) By Type (2018-2022)
Figure 4 Global Renewable Energy Revenue Market Share (%) By Type (2022)
Figure 5 Global Renewable Energy Revenue (USD Million) By Applications (2018-2022)
Figure 6 Global Renewable Energy Revenue Market Share (%) By Applications (2022)
Figure 7 Global Renewable Energy Market Revenue (USD Million) By Regions (2018-2022)
Figure 8 Global Renewable Energy Market Share (%) By Regions (2022)
Figure 9 North America Renewable Energy Revenue (USD Million) By Country (2018-2022)
Figure 10 North America Renewable Energy Revenue (USD Million) By Type (2018-2022)
Figure 11 North America Renewable Energy Revenue (USD Million) By Applications (2018-2022)
Figure 12 Europe Renewable Energy Revenue (USD Million) By Country (2018-2022)
Figure 13 Europe Renewable Energy Revenue (USD Million) By Type (2018-2022)
Figure 14 Europe Renewable Energy Revenue (USD Million) By Applications (2018-2022)
Figure 15 Asia Pacific Renewable Energy Revenue (USD Million) By Country (2018-2022)
Figure 16 Asia Pacific Renewable Energy Revenue (USD Million) By Type (2018-2022)
Figure 17 Asia Pacific Renewable Energy Revenue (USD Million) By Applications (2018-2022)
Figure 18 South America Renewable Energy Revenue (USD Million) By Country (2018-2022)
Figure 19 South America Renewable Energy Revenue (USD Million) By Type (2018-2022)
Figure 20 South America Renewable Energy Revenue (USD Million) By Applications (2018-2022)
Figure 21 Middle East and Africa Renewable Energy Revenue (USD Million) By Region (2018-2022)
Figure 22 Middle East and Africa Renewable Energy Revenue (USD Million) By Type (2018-2022)
Figure 23 Middle East and Africa Renewable Energy Revenue (USD Million) By Applications (2018-2022)
Figure 24 Global Renewable Energy Revenue (USD Million) By Type (2023-2030)
Figure 25 Global Renewable Energy Revenue Market Share (%) By Type (2030)
Figure 26 Global Renewable Energy Revenue (USD Million) By Applications (2023-2030)
Figure 27 Global Renewable Energy Revenue Market Share (%) By Applications (2030)
Figure 28 Global Renewable Energy Market Revenue (USD Million) By Regions (2023-2030)
Figure 29 North America Renewable Energy Revenue (USD Million) By Country (2023-2030)
Figure 30 North America Renewable Energy Revenue (USD Million) By Type (2023-2030)
Figure 31 North America Renewable Energy Revenue (USD Million) By Applications (2023-2030)
Figure 32 Europe Renewable Energy Revenue (USD Million) By Country (2023-2030)
Figure 33 Europe Renewable Energy Revenue (USD Million) By Type (2023-2030)
Figure 34 Europe Renewable Energy Revenue (USD Million) By Applications (2023-2030)
Figure 35 Asia Pacific Renewable Energy Revenue (USD Million) By Country (2023-2030)
Figure 36 Asia Pacific Renewable Energy Revenue (USD Million) By Type (2023-2030)
Figure 37 Asia Pacific Renewable Energy Revenue (USD Million) By Applications (2023-2030)
Figure 38 South America Renewable Energy Revenue (USD Million) By Country (2023-2030)
Figure 39 South America Renewable Energy Revenue (USD Million) By Type (2023-2030)
Figure 40 South America Renewable Energy Revenue (USD Million) By Applications (2023-2030)
Figure 41 Middle East and Africa Renewable Energy Revenue (USD Million) By Region (2023-2030)
Figure 42 Middle East and Africa Renewable Energy Revenue (USD Million) By Region (2023-2030)
Figure 43 Middle East and Africa Renewable Energy Revenue (USD Million) By Type (2023-2030)
Figure 44 Middle East and Africa Renewable Energy Revenue (USD Million) By Applications (2023-2030)
Figure 45 Bottom-Up and Top-Down Approaches For This Report
Figure 46 Data Triangulation
