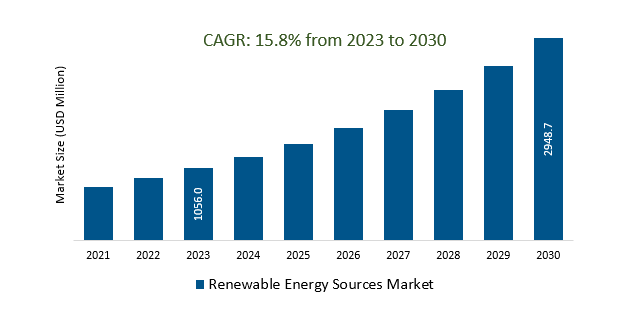
The Global Renewable Energy Sources Market Size is estimated to be US 1056.0 Billion in 2023 and is poised to register 15.8% growth over the forecast period from 2023 to 2030 to reach US $ 2948.7 billion in 2030.
The market growth is driven by the increasing urgency to reduce greenhouse gas emissions and combat climate change is a major driver for the adoption of renewable energy sources. Leading companies that are focused on Global Expansion, Energy Transition, Energy Storage Solutions, Grid Integration, Hydrogen Economy, Circular Economy, and others to boost market shares in the industry.
Market Overview
The Renewable Energy Sources Market, encompassing solar, wind, hydroelectric, geothermal, and biomass energy, has seen significant global growth driven by climate change mitigation, supportive government policies, technological advancements, and declining costs. Solar and wind energy, in particular, have rapidly expanded. However, challenges such as intermittency, grid integration, energy storage, and initial capital costs persist. Despite these challenges, the market's future looks promising, with increasing investments, job creation, and a crucial role in global efforts to combat climate change through sustainable energy solutions.
Market Dynamics
Market Trends - The impact of EV adoption on renewable energy demand
The adoption of electric vehicles (EVs) has the potential to increase the demand for renewable energy in the Renewable Energy Sources Market by driving additional electricity consumption and providing an opportunity for load shifting. To maximize the synergy between EVs and renewables, smart grid infrastructure and green charging solutions are crucial, as they enable efficient grid management and clean energy integration. Policy incentives can further encourage the use of renewables for EV charging, contributing to emissions reduction and overall decarbonization efforts.
Market Driver- Public Awareness and Education Demand Renewable Energy Sources Market
Public awareness and education have a pivotal role in stimulating demand for renewable energy sources in the Renewable Energy Sources Market. Informed consumers drive preferences for clean energy, advocate for supportive policies, and attract investment, ultimately accelerating market growth and technological advancements. Additionally, public awareness campaigns promote environmental responsibility, energy conservation, and sustainability, fostering a conducive environment for renewable energy adoption.
Market Opportunity-Introduction of Technological Advancements
Technological advancements have revolutionized the Renewable Energy Sources Market by enhancing the efficiency and affordability of renewable energy solutions such as solar and wind power, energy storage, and grid integration technologies. These innovations drive increased capacity and reliability, making renewable energy sources competitive with conventional fossil fuels and accelerating the transition to a sustainable energy landscape, offering significant promise for a cleaner and more environmentally friendly future.
Market Share Analysis- Solar Energy Renewable Energy Sources Market will register the fastest growth
The Global Renewable Energy Sources Market is analyzed across Solar Energy, Wind Energy, Hydroelectric Energy, Tidal Energy, and others. Electricity Generation is poised to register the fastest growth. Solar energy is a pivotal component of the Renewable Energy Sources Market, harnessing sunlight through photovoltaic technology to produce electricity. It involves the installation of solar panels in various locations to convert sunlight into clean and cost-effective electrical power. Solar energy contributes significantly to reducing emissions, enhancing energy sustainability, and diversifying the energy mix in residential and commercial settings, making it a rapidly growing and essential segment in the renewable energy sector.
Market Share Analysis- Electricity Generation held a significant market share in 2023
The Global Renewable Energy Sources Market is analyzed across various applications including Electricity Generation, Water Heating and Cooling, Transportation, and others. Of these, Electricity Generation held a significant market share in 2023. Electricity generation is at the core of the Renewable Energy Sources Market, where solar, wind, hydro, geothermal, and biomass resources are converted into electrical power using various technologies. This clean and sustainable approach to power generation addresses environmental concerns, reduces emissions, and supports the shift away from fossil fuels, making it a central focus within the renewable energy sector.
Renewable Energy Sources Market Segmentation
By Type
- Solar Energy
- Wind Energy
- Hydroelectric Energy
- Tidal Energy
- Others
By Application
- Electricity Generation
- Water Heating and Cooling
- Transportation
- Others
By End User
- Residential
- Commercial
- Industrial
- Others
By Region
- North America (United States, Canada, Mexico)
- Europe (Germany, France, United Kingdom, Spain, Italy, Others)
- Asia Pacific (China, India, Japan, South Korea, Australia, Others)
- Latin America (Brazil, Argentina, Others)
- Middle East and Africa (Saudi Arabia, UAE, Kuwait, Other Middle East, South Africa, Nigeria, Other Africa)
Renewable Energy Sources Market Companies
- Brookfield Renewable Corp (Canada)
- Suzlon (India)
- Canadian Solar Inc (Canada)
- ReNew Power Ventures (India)
- Tata Power Solar Systems Ltd. (India)
- Algonquin Power & Utilities Corp (Canada)
- Hindustan Power (India)
- Plug Power Inc. (New York)
- Adani Renewables (India)
- Daqo New Energy Corp. (China)
*List not exhaustive
Renewable Energy Sources Market Outlook 2023
1 Market Overview
1.1 Introduction to the Renewable Energy Sources Market
1.2 Scope of the Study
1.3 Research Objective
1.3.1 Key Market Scope and Segments
1.3.2 Players Covered
1.3.3 Years Considered
2 Executive Summary
2.1 2023 Renewable Energy Sources Industry- Market Statistics
3 Market Dynamics
3.1 Market Drivers
3.2 Market Challenges
3.3 Market Opportunities
3.4 Market Trends
4 Market Factor Analysis
4.1 Porter’s Five Forces
4.2 Market Entropy
4.2.1 Global Renewable Energy Sources Market Companies with Area Served
4.2.2 Products Offerings Global Renewable Energy Sources Market
5 COVID-19 Impact Analysis and Outlook Scenarios
5.1.1 Covid-19 Impact Analysis
5.1.2 Post-COVID-19 Scenario- Low Growth Case
5.1.3 Post-COVID-19 Scenario- Reference Growth Case
5.1.4 Post-COVID-19 Scenario- Low Growth Case
6 Global Renewable Energy Sources Market Trends
6.1 Global Renewable Energy Sources Revenue (USD Million) and CAGR (%) by Type (2018-2030)
6.2 Global Renewable Energy Sources Revenue (USD Million) and CAGR (%) by Applications (2018-2030)
6.3 Global Renewable Energy Sources Revenue (USD Million) and CAGR (%) by Regions (2018-2030)
7 Global Renewable Energy Sources Market Revenue (USD Million) by Type, and Applications (2018-2022)
7.1 Global Renewable Energy Sources Revenue (USD Million) by Type (2018-2022)
7.1.1 Global Renewable Energy Sources Revenue (USD Million), Market Share (%) by Type (2018-2022)
7.2 Global Renewable Energy Sources Revenue (USD Million) by Applications (2018-2022)
7.2.1 Global Renewable Energy Sources Revenue (USD Million), Market Share (%) by Applications (2018-2022)
8 Global Renewable Energy Sources Development Regional Status and Outlook
8.1 Global Renewable Energy Sources Revenue (USD Million) By Regions (2018-2022)
8.2 North America Renewable Energy Sources Revenue (USD Million) by Type, and Application (2018-2022)
8.2.1 North America Renewable Energy Sources Revenue (USD Million) by Country (2018-2022)
8.2.2 North America Renewable Energy Sources Revenue (USD Million) by Type (2018-2022)
8.2.3 North America Renewable Energy Sources Revenue (USD Million) by Applications (2018-2022)
8.3 Europe Renewable Energy Sources Revenue (USD Million), by Type, and Applications (USD Million) (2018-2022)
8.3.1 Europe Renewable Energy Sources Revenue (USD Million), by Country (2018-2022)
8.3.2 Europe Renewable Energy Sources Revenue (USD Million) by Type (2018-2022)
8.3.3 Europe Renewable Energy Sources Revenue (USD Million) by Applications (2018-2022)
8.4 Asia Pacific Renewable Energy Sources Revenue (USD Million), and Revenue (USD Million) by Type, and Applications (2018-2022)
8.4.1 Asia Pacific Renewable Energy Sources Revenue (USD Million) by Country (2018-2022)
8.4.2 Asia Pacific Renewable Energy Sources Revenue (USD Million) by Type (2018-2022)
8.4.3 Asia Pacific Renewable Energy Sources Revenue (USD Million) by Applications (2018-2022)
8.5 South America Renewable Energy Sources Revenue (USD Million), by Type, and Applications (2018-2022)
8.5.1 South America Renewable Energy Sources Revenue (USD Million), by Country (2018-2022)
8.5.2 South America Renewable Energy Sources Revenue (USD Million) by Type (2018-2022)
8.5.3 South America Renewable Energy Sources Revenue (USD Million) by Applications (2018-2022)
8.6 Middle East and Africa Renewable Energy Sources Revenue (USD Million), by Type, Technology, Application, Thickness (2018-2022)
8.6.1 Middle East and Africa Renewable Energy Sources Revenue (USD Million) by Country (2018-2022)
8.6.2 Middle East and Africa Renewable Energy Sources Revenue (USD Million) by Type (2018-2022)
8.6.3 Middle East and Africa Renewable Energy Sources Revenue (USD Million) by Applications (2018-2022)
9 Company Profiles
10 Global Renewable Energy Sources Market Revenue (USD Million), by Type, and Applications (2023-2030)
10.1 Global Renewable Energy Sources Revenue (USD Million) and Market Share (%) by Type (2023-2030)
10.1.1 Global Renewable Energy Sources Revenue (USD Million), and Market Share (%) by Type (2023-2030)
10.2 Global Renewable Energy Sources Revenue (USD Million) and Market Share (%) by Applications (2023-2030)
10.2.1 Global Renewable Energy Sources Revenue (USD Million), and Market Share (%) by Applications (2023-2030)
11 Global Renewable Energy Sources Development Regional Status and Outlook Forecast
11.1 Global Renewable Energy Sources Revenue (USD Million) By Regions (2023-2030)
11.2 North America Renewable Energy Sources Revenue (USD Million) by Type, and Applications (2023-2030)
11.2.1 North America Renewable Energy Sources Revenue (USD) Million by Country (2023-2030)
11.2.2 North America Renewable Energy Sources Revenue (USD Million), by Type (2023-2030)
11.2.3 North America Renewable Energy Sources Revenue (USD Million), Market Share (%) by Applications (2023-2030)
11.3 Europe Renewable Energy Sources Revenue (USD Million), by Type, and Applications (2023-2030)
11.3.1 Europe Renewable Energy Sources Revenue (USD Million), by Country (2023-2030)
11.3.2 Europe Renewable Energy Sources Revenue (USD Million), by Type (2023-2030)
11.3.3 Europe Renewable Energy Sources Revenue (USD Million), by Applications (2023-2030)
11.4 Asia Pacific Renewable Energy Sources Revenue (USD Million) by Type, and Applications (2023-2030)
11.4.1 Asia Pacific Renewable Energy Sources Revenue (USD Million), by Country (2023-2030)
11.4.2 Asia Pacific Renewable Energy Sources Revenue (USD Million), by Type (2023-2030)
11.4.3 Asia Pacific Renewable Energy Sources Revenue (USD Million), by Applications (2023-2030)
11.5 South America Renewable Energy Sources Revenue (USD Million), by Type, and Applications (2023-2030)
11.5.1 South America Renewable Energy Sources Revenue (USD Million), by Country (2023-2030)
11.5.2 South America Renewable Energy Sources Revenue (USD Million), by Type (2023-2030)
11.5.3 South America Renewable Energy Sources Revenue (USD Million), by Applications (2023-2030)
11.6 Middle East and Africa Renewable Energy Sources Revenue (USD Million), by Type, and Applications (2023-2030)
11.6.1 Middle East and Africa Renewable Energy Sources Revenue (USD Million), by Region (2023-2030)
11.6.2 Middle East and Africa Renewable Energy Sources Revenue (USD Million), by Type (2023-2030)
11.6.3 Middle East and Africa Renewable Energy Sources Revenue (USD Million), by Applications (2023-2030)
12 Methodology and Data Sources
12.1 Methodology/Research Approach
12.1.1 Research Programs/Design
12.1.2 Market Size Estimation
12.1.3 Market Breakdown and Data Triangulation
12.2 Data Sources
12.2.1 Secondary Sources
12.2.2 Primary Sources
12.3 Disclaimer
List of Tables
Table 1 Market Segmentation Analysis
Table 2 Global Renewable Energy Sources Market Companies with Areas Served
Table 3 Products Offerings Global Renewable Energy Sources Market
Table 4 Low Growth Scenario Forecasts
Table 5 Reference Case Growth Scenario
Table 6 High Growth Case Scenario
Table 7 Global Renewable Energy Sources Revenue (USD Million) And CAGR (%) By Type (2018-2030)
Table 8 Global Renewable Energy Sources Revenue (USD Million) And CAGR (%) By Applications (2018-2030)
Table 9 Global Renewable Energy Sources Revenue (USD Million) And CAGR (%) By Regions (2018-2030)
Table 10 Global Renewable Energy Sources Revenue (USD Million) By Type (2018-2022)
Table 11 Global Renewable Energy Sources Revenue Market Share (%) By Type (2018-2022)
Table 12 Global Renewable Energy Sources Revenue (USD Million) By Applications (2018-2022)
Table 13 Global Renewable Energy Sources Revenue Market Share (%) By Applications (2018-2022)
Table 14 Global Renewable Energy Sources Market Revenue (USD Million) By Regions (2018-2022)
Table 15 Global Renewable Energy Sources Market Share (%) By Regions (2018-2022)
Table 16 North America Renewable Energy Sources Revenue (USD Million) By Country (2018-2022)
Table 17 North America Renewable Energy Sources Revenue (USD Million) By Type (2018-2022)
Table 18 North America Renewable Energy Sources Revenue (USD Million) By Applications (2018-2022)
Table 19 Europe Renewable Energy Sources Revenue (USD Million) By Country (2018-2022)
Table 20 Europe Renewable Energy Sources Revenue (USD Million) By Type (2018-2022)
Table 21 Europe Renewable Energy Sources Revenue (USD Million) By Applications (2018-2022)
Table 22 Asia Pacific Renewable Energy Sources Revenue (USD Million) By Country (2018-2022)
Table 23 Asia Pacific Renewable Energy Sources Revenue (USD Million) By Type (2018-2022)
Table 24 Asia Pacific Renewable Energy Sources Revenue (USD Million) By Applications (2018-2022)
Table 25 South America Renewable Energy Sources Revenue (USD Million) By Country (2018-2022)
Table 26 South America Renewable Energy Sources Revenue (USD Million) By Type (2018-2022)
Table 27 South America Renewable Energy Sources Revenue (USD Million) By Applications (2018-2022)
Table 28 Middle East and Africa Renewable Energy Sources Revenue (USD Million) By Region (2018-2022)
Table 29 Middle East and Africa Renewable Energy Sources Revenue (USD Million) By Type (2018-2022)
Table 30 Middle East and Africa Renewable Energy Sources Revenue (USD Million) By Applications (2018-2022)
Table 31 Financial Analysis
Table 32 Global Renewable Energy Sources Revenue (USD Million) By Type (2023-2030)
Table 33 Global Renewable Energy Sources Revenue Market Share (%) By Type (2023-2030)
Table 34 Global Renewable Energy Sources Revenue (USD Million) By Applications (2023-2030)
Table 35 Global Renewable Energy Sources Revenue Market Share (%) By Applications (2023-2030)
Table 36 Global Renewable Energy Sources Market Revenue (USD Million), And Revenue (USD Million) By Regions (2023-2030)
Table 37 North America Renewable Energy Sources Revenue (USD)By Country (2023-2030)
Table 38 North America Renewable Energy Sources Revenue (USD Million) By Type (2023-2030)
Table 39 North America Renewable Energy Sources Revenue (USD Million) By Applications (2023-2030)
Table 40 Europe Renewable Energy Sources Revenue (USD Million) By Country (2023-2030)
Table 41 Europe Renewable Energy Sources Revenue (USD Million) By Type (2023-2030)
Table 42 Europe Renewable Energy Sources Revenue (USD Million) By Applications (2023-2030)
Table 43 Asia Pacific Renewable Energy Sources Revenue (USD Million) By Country (2023-2030)
Table 44 Asia Pacific Renewable Energy Sources Revenue (USD Million) By Type (2023-2030)
Table 45 Asia Pacific Renewable Energy Sources Revenue (USD Million) By Applications (2023-2030)
Table 46 South America Renewable Energy Sources Revenue (USD Million) By Country (2023-2030)
Table 47 South America Renewable Energy Sources Revenue (USD Million) By Type (2023-2030)
Table 48 South America Renewable Energy Sources Revenue (USD Million) By Applications (2023-2030)
Table 49 Middle East and Africa Renewable Energy Sources Revenue (USD Million) By Region (2023-2030)
Table 50 Middle East and Africa Renewable Energy Sources Revenue (USD Million) By Region (2023-2030)
Table 51 Middle East and Africa Renewable Energy Sources Revenue (USD Million) By Type (2023-2030)
Table 52 Middle East and Africa Renewable Energy Sources Revenue (USD Million) By Applications (2023-2030)
Table 53 Research Programs/Design for This Report
Table 54 Key Data Information from Secondary Sources
Table 55 Key Data Information from Primary Sources
List of Figures
Figure 1 Market Scope
Figure 2 Porter’s Five Forces
Figure 3 Global Renewable Energy Sources Revenue (USD Million) By Type (2018-2022)
Figure 4 Global Renewable Energy Sources Revenue Market Share (%) By Type (2022)
Figure 5 Global Renewable Energy Sources Revenue (USD Million) By Applications (2018-2022)
Figure 6 Global Renewable Energy Sources Revenue Market Share (%) By Applications (2022)
Figure 7 Global Renewable Energy Sources Market Revenue (USD Million) By Regions (2018-2022)
Figure 8 Global Renewable Energy Sources Market Share (%) By Regions (2022)
Figure 9 North America Renewable Energy Sources Revenue (USD Million) By Country (2018-2022)
Figure 10 North America Renewable Energy Sources Revenue (USD Million) By Type (2018-2022)
Figure 11 North America Renewable Energy Sources Revenue (USD Million) By Applications (2018-2022)
Figure 12 Europe Renewable Energy Sources Revenue (USD Million) By Country (2018-2022)
Figure 13 Europe Renewable Energy Sources Revenue (USD Million) By Type (2018-2022)
Figure 14 Europe Renewable Energy Sources Revenue (USD Million) By Applications (2018-2022)
Figure 15 Asia Pacific Renewable Energy Sources Revenue (USD Million) By Country (2018-2022)
Figure 16 Asia Pacific Renewable Energy Sources Revenue (USD Million) By Type (2018-2022)
Figure 17 Asia Pacific Renewable Energy Sources Revenue (USD Million) By Applications (2018-2022)
Figure 18 South America Renewable Energy Sources Revenue (USD Million) By Country (2018-2022)
Figure 19 South America Renewable Energy Sources Revenue (USD Million) By Type (2018-2022)
Figure 20 South America Renewable Energy Sources Revenue (USD Million) By Applications (2018-2022)
Figure 21 Middle East and Africa Renewable Energy Sources Revenue (USD Million) By Region (2018-2022)
Figure 22 Middle East and Africa Renewable Energy Sources Revenue (USD Million) By Type (2018-2022)
Figure 23 Middle East and Africa Renewable Energy Sources Revenue (USD Million) By Applications (2018-2022)
Figure 24 Global Renewable Energy Sources Revenue (USD Million) By Type (2023-2030)
Figure 25 Global Renewable Energy Sources Revenue Market Share (%) By Type (2030)
Figure 26 Global Renewable Energy Sources Revenue (USD Million) By Applications (2023-2030)
Figure 27 Global Renewable Energy Sources Revenue Market Share (%) By Applications (2030)
Figure 28 Global Renewable Energy Sources Market Revenue (USD Million) By Regions (2023-2030)
Figure 29 North America Renewable Energy Sources Revenue (USD Million) By Country (2023-2030)
Figure 30 North America Renewable Energy Sources Revenue (USD Million) By Type (2023-2030)
Figure 31 North America Renewable Energy Sources Revenue (USD Million) By Applications (2023-2030)
Figure 32 Europe Renewable Energy Sources Revenue (USD Million) By Country (2023-2030)
Figure 33 Europe Renewable Energy Sources Revenue (USD Million) By Type (2023-2030)
Figure 34 Europe Renewable Energy Sources Revenue (USD Million) By Applications (2023-2030)
Figure 35 Asia Pacific Renewable Energy Sources Revenue (USD Million) By Country (2023-2030)
Figure 36 Asia Pacific Renewable Energy Sources Revenue (USD Million) By Type (2023-2030)
Figure 37 Asia Pacific Renewable Energy Sources Revenue (USD Million) By Applications (2023-2030)
Figure 38 South America Renewable Energy Sources Revenue (USD Million) By Country (2023-2030)
Figure 39 South America Renewable Energy Sources Revenue (USD Million) By Type (2023-2030)
Figure 40 South America Renewable Energy Sources Revenue (USD Million) By Applications (2023-2030)
Figure 41 Middle East and Africa Renewable Energy Sources Revenue (USD Million) By Region (2023-2030)
Figure 42 Middle East and Africa Renewable Energy Sources Revenue (USD Million) By Region (2023-2030)
Figure 43 Middle East and Africa Renewable Energy Sources Revenue (USD Million) By Type (2023-2030)
Figure 44 Middle East and Africa Renewable Energy Sources Revenue (USD Million) By Applications (2023-2030)
Figure 45 Bottom-Up and Top-Down Approaches For This Report
Figure 46 Data Triangulation
