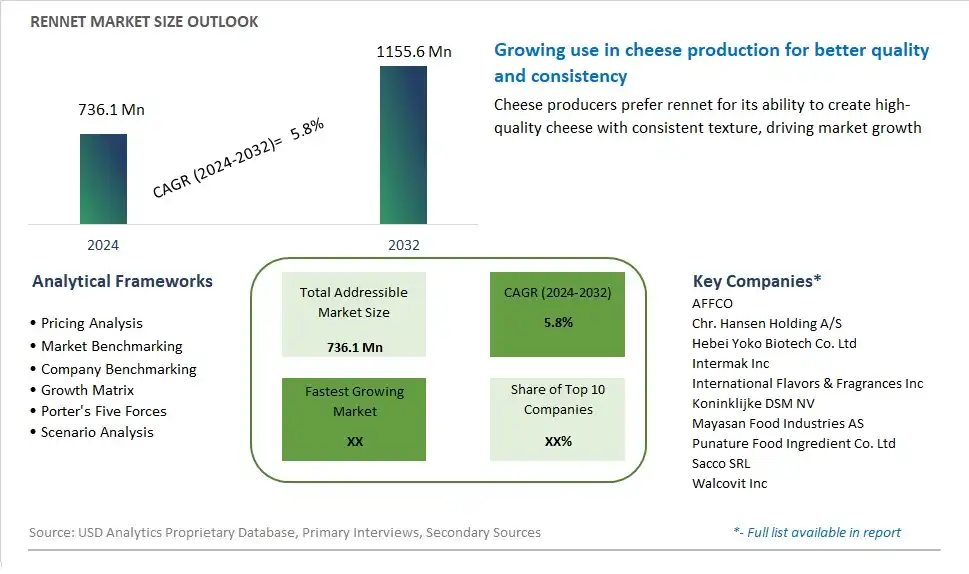
Global Rennet Market Size is valued at $736.1 Million in 2024 and is forecast to register a growth rate (CAGR) of 5.8% to reach $1155.6 Million by 2032.
The global Rennet Market Comprehensive Study analyzes and forecasts the market size across 6 regions and 24 countries for diverse segments -By Type (Animal-Derived Rennet, Microbial Rennet, FPC-Fermentation Produced Chymosin Rennet, Vegetable Rennet), By Form (Liquid, Powder, Paste)
An Introduction to Rennet Market
In 2024, the rennet market is expanding due to its crucial role in cheese production. Rennet, an enzyme complex traditionally derived from the stomachs of ruminant animals, is essential for coagulating milk and forming curds. The market includes both animal-derived and microbial rennet, catering to different dietary and ethical preferences. The demand for specialty and artisanal cheeses is driving the need for high-quality rennet. Innovations in biotechnology are leading to the development of more efficient and consistent microbial rennet alternatives. Additionally, the growth of the dairy industry and the rising popularity of gourmet and functional cheeses are significantly contributing to market expansion.
Rennet Competitive Landscape
The market report analyses the leading companies in the industry including AFFCO, Chr. Hansen Holding A/S, Hebei Yoko Biotech Co. Ltd, Intermak Inc, International Flavors & Fragrances Inc, Koninklijke DSM NV, Mayasan Food Industries AS, Punature Food Ingredient Co. Ltd, Sacco SRL, Walcovit Inc, and Others.
Rennet Market Dynamics
Rennet Market Trend: Growing Demand for Plant-Based and Alternative Rennet Sources
A prominent market trend in the rennet segment is the increasing demand for plant-based and alternative rennet sources. As consumers become more conscious of their dietary choices and ethical considerations, there is a growing preference for rennet alternatives derived from non-animal sources. Plant-based rennet, obtained from sources such as microbial enzymes, vegetable coagulants, and fermentation processes, is gaining traction among vegetarians, vegans, and individuals with dietary restrictions. This trend is driven by concerns about animal welfare, sustainability, and the desire for more ethical and environmentally friendly alternatives in the food industry.
Market Driver: Shift Towards Vegetarian and Vegan Diets
The market driver for rennet is the shift towards vegetarian and vegan diets among consumers. With the rising popularity of plant-based lifestyles driven by health, ethical, and environmental considerations, there is a growing demand for rennet alternatives that align with vegetarian and vegan dietary preferences. Traditional animal-derived rennet, sourced from the stomach lining of calves, is incompatible with vegetarian and vegan diets, leading to increased interest in plant-based options. This driver is reinforced by the expanding market for plant-based foods and beverages, as well as the growing awareness of the environmental impact of animal agriculture, driving the adoption of rennet alternatives derived from non-animal sources.
Market Opportunity: Innovation in Rennet Substitutes and Sustainable Production Methods
One potential opportunity for the rennet market lies in innovation in rennet substitutes and sustainable production methods. With the growing demand for plant-based and alternative rennet sources, there is an opportunity for companies to develop innovative solutions that replicate the functionality and flavor profiles of traditional rennet while addressing the needs of vegetarian, vegan, and environmentally conscious consumers. Additionally, investing in sustainable production methods such as fermentation technology, biotechnology, and enzyme engineering can enhance the sustainability credentials of rennet substitutes and reduce reliance on animal-derived rennet. By embracing innovation and sustainability, companies can capitalize on the shifting consumer preferences and drive growth in the rennet market.
Rennet Market Share Analysis: Animal-Derived Rennet held the dominant market share in 2024
In the Rennet market segmented by type, the Animal-Derived Rennet segment is the largest, driven by its historical use, widespread availability, and traditional methods of cheese production. Animal-derived rennet, sourced primarily from the stomach lining of young calves, has been a staple ingredient in cheese making for centuries. Its enzymatic properties play a crucial role in the coagulation of milk proteins, essential for the formation and texture of various cheese varieties. While alternative rennet sources have gained traction due to ethical and dietary considerations, animal-derived rennet remains the preferred choice for many cheese producers, particularly those adhering to traditional methods and seeking to replicate classic cheese flavors and textures. Further, the familiarity and established supply chain of animal-derived rennet contribute to its dominance in the market, ensuring consistent availability and quality for cheese manufacturers worldwide. Additionally, stringent regulations and quality standards further support the continued use of animal-derived rennet in cheese production. Overall, the combination of tradition, effectiveness, and widespread usage positions the Animal-Derived Rennet segment as the largest in the Rennet market.
Rennet Market Share Analysis: Liquid market is poised to register the fastest growth rae over the forecast period to 2032
In the Rennet market segmented by form, the Liquid segment is the fastest-growing, propelled by its convenience, versatility, and ease of use in cheese making processes. Liquid rennet offers cheese manufacturers greater flexibility and precision in dosage, ensuring consistent coagulation of milk proteins and desired cheese textures. Its fluid form allows for easy integration into cheese vats, facilitating uniform distribution throughout the milk, resulting in smoother curd formation and higher cheese yield. Additionally, liquid rennet typically boasts longer shelf life and stability compared to other forms, minimizing waste and optimizing production efficiency for cheese manufacturers. Further, the growing demand for artisanal and specialty cheeses, which often require precise and small-scale cheese making operations, further drives the adoption of liquid rennet. Furthermore, advancements in production technologies and packaging methods enhance the accessibility and availability of liquid rennet to cheese producers worldwide, contributing to its rapid growth in the market. Overall, the combination of practicality, performance, and suitability for diverse cheese making applications positions the Liquid segment as the fastest-growing in the Rennet market.
Rennet Market Segmentation
By Type
Animal-Derived Rennet
Microbial Rennet
FPC-Fermentation Produced Chymosin Rennet
Vegetable Rennet
By Form
Liquid
Powder
Paste
Countries Analyzed
North America (US, Canada, Mexico)
Europe (Germany, UK, France, Spain, Italy, Russia, Rest of Europe)
Asia Pacific (China, India, Japan, South Korea, Australia, South East Asia, Rest of Asia)
South America (Brazil, Argentina, Rest of South America)
Middle East and Africa (Saudi Arabia, UAE, Rest of Middle East, South Africa, Egypt, Rest of Africa)
Rennet Companies Profiled in the Study
AFFCO
Chr. Hansen Holding A/S
Hebei Yoko Biotech Co. Ltd
Intermak Inc
International Flavors & Fragrances Inc
Koninklijke DSM NV
Mayasan Food Industries AS
Punature Food Ingredient Co. Ltd
Sacco SRL
Walcovit Inc
*- List Not Exhaustive
Chapter 1. TABLE OF CONTENTS
Chapter 2. Introduction to Rennet Market
2.1. Market Overview
2.2. Key Statistics and Report Highlights
2.3. Scope of the Comprehensive Study
2.3.1. Market Definition
2.3.2 Countries and Regions Covered
2.3.3 Research Objective
2.3.4 Units, Currency, and Conversions
2.3.5 Industry Value Chain
2.4. Key Market Segments
2.5. Key Companies
2.6. Study Period
Chapter 3. Strategic Analysis Review
3.1. Rennet Pricing Analysis and Forecast
3.2. Porter’s Five Forces
3.3. Market Ecosystem
3.4. SWOT Analysis
3.5. Regulatory Scenario
3.3. Effects of Inflation, Russia-Ukraine War, moderating economic growth, and other macroeconomic factors
Chapter 4. Competitive Landscape
4.1. Market Share Analysis
4.1.1. Global Rennet Market Share by Company, 2023
4.1.2. Product Offerings of Leading Rennet Companies
4.2. Market Entropy
4.2.1. New Product Launches in the Industry
4.2.2. Mergers, Acquisitions, Joint ventures, and Partnerships
4.3. Key Strategies and Best Practices
Chapter 5. Global Market Projections: Best, Reference, and Low Case Scenarios
5.1. Growth Analysis- Case Scenario Definitions
5.2. Low Growth Case Scenario Forecasts
5.3. Reference Growth Case Scenario Forecasts
5.4. High Growth Case Scenario Forecasts
Chapter 6. Market Dynamics
6.1. Rennet Market Drivers
6.2. Rennet Market Challenges
6.6. Rennet Market Opportunities
6.4. Rennet Market Trends
Chapter 7. Global Rennet Market Outlook Trends
7.1. Global Rennet Revenue (USD Million) and CAGR (%) by Type (2021-2032)
7.2. Global Rennet Revenue (USD Million) and CAGR (%) by Application (2021-2032)
7.3. Global Rennet Revenue (USD Million) and CAGR (%) by Product (2021-2032)
By Type
Animal-Derived Rennet
Microbial Rennet
FPC-Fermentation Produced Chymosin Rennet
Vegetable Rennet
By Form
Liquid
Powder
Paste
Chapter 8. Global Rennet Regional Analysis and Outlook
8.1. Global Rennet Revenue (USD Million) By Regions (2021- 2032)
8.2. North America Rennet Revenue (USD Million) by Country (2021-2032)
8.2.1. United States Rennet Regional Analysis and Outlook
8.2.2. Canada Rennet Regional Analysis and Outlook
8.2.3. Mexico Rennet Regional Analysis and Outlook
8.3. Europe Rennet Revenue (USD Million), by Country (2021-2032)
8.3.1. Germany Rennet Regional Analysis and Outlook
8.3.2. France Rennet Regional Analysis and Outlook
8.3.3. United Kingdom Rennet Regional Analysis and Outlook
8.3.4. Spain Rennet Regional Analysis and Outlook
8.3.5. Italy Rennet Regional Analysis and Outlook
8.3.6. Russia Rennet Regional Analysis and Outlook
8.3.7. Rest of Europe Rennet Regional Analysis and Outlook
8.4. Asia Pacific Rennet Revenue (USD Million) by Country (2021-2032)
8.4.1. China Rennet Regional Analysis and Outlook
8.4.2. Japan Rennet Regional Analysis and Outlook
8.4.3. India Rennet Regional Analysis and Outlook
8.4.4. South Korea Rennet Regional Analysis and Outlook
8.4.5. Australia Rennet Regional Analysis and Outlook
8.4.6. South East Asia Rennet Regional Analysis and Outlook
8.4.7. Rest of Asia Pacific Rennet Regional Analysis and Outlook
8.5. South America Rennet Revenue (USD Million), by Country (2021-2032)
8.5.1. Brazil Rennet Regional Analysis and Outlook
8.5.2. Argentina Rennet Regional Analysis and Outlook
8.5.3. Rest of South America Rennet Regional Analysis and Outlook
8.6. Middle East and Africa Rennet Revenue (USD Million) by Country (2021-2032)
8.6.1. Middle East Rennet Regional Analysis and Outlook
8.6.2. Africa Rennet Regional Analysis and Outlook
Chapter 9. North America Rennet Analysis and Outlook
9.1. North America Rennet Revenue (USD Million) by Segments (2021-2032)
9.1.1. North America Rennet Revenue (USD Million) by Type (2021-2032)
9.1.2. North America Rennet Revenue (USD Million) by Application (2021-2032)
9.1.3. North America Rennet Revenue (USD Million) by Product (2021-2032)
By Type
Animal-Derived Rennet
Microbial Rennet
FPC-Fermentation Produced Chymosin Rennet
Vegetable Rennet
By Form
Liquid
Powder
Paste
Chapter 10. Europe Rennet Analysis and Outlook
10.1. Europe Rennet Revenue (USD Million), by Segments (USD Million) (2021-2032)
10.1.1. Europe Rennet Revenue (USD Million) by Type (2021-2032)
10.1.2. Europe Rennet Revenue (USD Million) by Application (2021-2032)
10.1.3. Europe Rennet Revenue (USD Million) by Product (2021-2032)
By Type
Animal-Derived Rennet
Microbial Rennet
FPC-Fermentation Produced Chymosin Rennet
Vegetable Rennet
By Form
Liquid
Powder
Paste
Chapter 11. Asia Pacific Rennet Analysis and Outlook
11.1. Asia Pacific Rennet Revenue (USD Million), and Revenue (USD Million) by Segments (2021-2032)
11.1.1. Asia Pacific Rennet Revenue (USD Million) by Type (2021-2032)
11.1.2. Asia Pacific Rennet Revenue (USD Million) by Application (2021-2032)
11.1.3. Asia Pacific Rennet Revenue (USD Million) by Product (2021-2032)
By Type
Animal-Derived Rennet
Microbial Rennet
FPC-Fermentation Produced Chymosin Rennet
Vegetable Rennet
By Form
Liquid
Powder
Paste
Chapter 12. South America Rennet Analysis and Outlook
12.1. South America Rennet Revenue (USD Million), by Segments (2021-2032)
12.1.1. South America Rennet Revenue (USD Million) by Type (2021-2032)
12.1.2. South America Rennet Revenue (USD Million) by Application (2021-2032)
12.1.3. South America Rennet Revenue (USD Million) by Product (2021-2032)
By Type
Animal-Derived Rennet
Microbial Rennet
FPC-Fermentation Produced Chymosin Rennet
Vegetable Rennet
By Form
Liquid
Powder
Paste
Chapter 13. Middle East and Africa Rennet Analysis and Outlook
13.1. Middle East and Africa Rennet Revenue (USD Million), by Segments (2021-2032)
13.1.1. Middle East and Africa Rennet Revenue (USD Million) by Type (2021-2032)
13.1.2. Middle East and Africa Rennet Revenue (USD Million) by Application (2021-2032)
13.1.3. Middle East and Africa Rennet Revenue (USD Million) by Product (2021-2032)
By Type
Animal-Derived Rennet
Microbial Rennet
FPC-Fermentation Produced Chymosin Rennet
Vegetable Rennet
By Form
Liquid
Powder
Paste
Chapter 14. Rennet Company Profiles
14.1 Business Overview
14.2 Product Profiles
14.3 SWOT Profiles
14.5 Recent Developments
14.6 Financial Profile
List of Companies
AFFCO
Chr. Hansen Holding A/S
Hebei Yoko Biotech Co. Ltd
Intermak Inc
International Flavors & Fragrances Inc
Koninklijke DSM NV
Mayasan Food Industries AS
Punature Food Ingredient Co. Ltd
Sacco SRL
Walcovit Inc
15. Methodology and Data Sources
15.1 Customization Offerings
15.2 Subscription Services
15.3 Related Reports
15.4 Publisher Expertise
LIST OF TABLES
Table 1 Market Segmentation Analysis
Table 2 Global Rennet Market Share of Leading Companies, 2023
Table 3 Product Offerings of Leading Companies
Table 4 Low Growth Scenario Forecasts
Table 5 Reference Case Growth Scenario
Table 6 High Growth Case Scenario
Table 7 Global Rennet Revenue (USD Million) And CAGR (%) By Type (2021-2032)
Table 8 Global Rennet Revenue (USD Million) And CAGR (%) By Application (2021-2032)
Table 9 Global Rennet Revenue (USD Million) And CAGR (%) By Product (2021-2032)
Table 10 Global Rennet Market Revenue (USD Million) By Regions (2021-2032)
Table 11 Global Rennet Market Share (%) By Regions (2021-2032)
Table 12 North America Rennet Revenue (USD Million) By Country (2021-2032)
Table 13 Europe Rennet Revenue (USD Million) By Country (2021-2032)
Table 14 Asia Pacific Rennet Revenue (USD Million) By Country (2021-2032)
Table 15 South America Rennet Revenue (USD Million) By Country (2021-2032)
Table 16 Middle East and Africa Rennet Revenue (USD Million) By Region (2021-2032)
Table 17 North America Rennet Revenue (USD Million) By Type (2021-2032)
Table 18 North America Rennet Revenue (USD Million) By Application (2021-2032)
Table 19 North America Rennet Revenue (USD Million) By Product (2021-2032)
Table 20 Europe Rennet Revenue (USD Million) By Type (2021-2032)
Table 21 Europe Rennet Revenue (USD Million) By Application (2021-2032)
Table 22 Europe Rennet Revenue (USD Million) By Product (2021-2032)
Table 23 Asia Pacific Rennet Revenue (USD Million) By Type (2021-2032)
Table 24 Asia Pacific Rennet Revenue (USD Million) By Application (2021-2032)
Table 25 Asia Pacific Rennet Revenue (USD Million) By Product (2021-2032)
Table 26 South America Rennet Revenue (USD Million) By Type (2021-2032)
Table 27 South America Rennet Revenue (USD Million) By Application (2021-2032)
Table 28 South America Rennet Revenue (USD Million) By Product (2021-2032)
Table 29 Middle East and Africa Rennet Revenue (USD Million) By Type (2021-2032)
Table 30 Middle East and Africa Rennet Revenue (USD Million) By Application (2021-2032)
Table 31 Middle East and Africa Rennet Revenue (USD Million) By Product (2021-2032)
LIST OF FIGURES
Figure 1. Market Scope
Figure 2. Pricing Forecasts Per Unit, 2023- 2032
Figure 3. Porter’s Five Forces
Figure 4. Global Rennet Market Revenue (USD Million) By Regions (2021-2032)
Figure 5. Global Rennet Market Share (%) By Regions (2023)
Figure 6. North America Rennet Revenue (USD Million) By Country (2021-2032)
Figure 7. United States Rennet Revenue (USD Million) By Country (2021-2032)
Figure 8. Canada Rennet Revenue (USD Million) By Country (2021-2032)
Figure 9. Mexico Rennet Revenue (USD Million) By Country (2021-2032)
Figure 10. Europe Rennet Revenue (USD Million) By Country (2021-2032)
Figure 11. Germany Rennet Revenue (USD Million) By Country (2021-2032)
Figure 12. France Rennet Revenue (USD Million) By Country (2021-2032)
Figure 13. United Kingdom Rennet Revenue (USD Million) By Country (2021-2032)
Figure 14. Spain Rennet Revenue (USD Million) By Country (2021-2032)
Figure 15. Italy Rennet Revenue (USD Million) By Country (2021-2032)
Figure 16. Russia Rennet Revenue (USD Million) By Country (2021-2032)
Figure 17. Rest of Europe Rennet Revenue (USD Million) By Country (2021-2032)
Figure 11. Asia Pacific Rennet Revenue (USD Million) By Country (2021-2032)
Figure 12. China Rennet Revenue (USD Million) By Country (2021-2032)
Figure 13. Japan Rennet Revenue (USD Million) By Country (2021-2032)
Figure 14. India Rennet Revenue (USD Million) By Country (2021-2032)
Figure 15. South Korea Rennet Revenue (USD Million) By Country (2021-2032)
Figure 16. Australia Rennet Revenue (USD Million) By Country (2021-2032)
Figure 17. South East Asia Rennet Revenue (USD Million) By Country (2021-2032)
Figure 18. South America Rennet Revenue (USD Million) By Country (2021-2032)
Figure 19. Brazil Rennet Revenue (USD Million) By Country (2021-2032)
Figure 20. Argentina Rennet Revenue (USD Million) By Country (2021-2032)
Figure 21. Rest of Asia Pacific Rennet Revenue (USD Million) By Country (2021-2032)
Figure 22. Middle East and Africa Rennet Revenue (USD Million) By Region (2021-2032)
Figure 23. Saudi Arabia Rennet Revenue (USD Million) By Region (2021-2032)
Figure 24. The UAE Rennet Revenue (USD Million) By Region (2021-2032)
Figure 25. Rest of Middle East Rennet Revenue (USD Million) By Region (2021-2032)
Figure 26. South Africa Rennet Revenue (USD Million) By Region (2021-2032)
Figure 27. Africa Rennet Revenue (USD Million) By Region (2021-2032)
Figure 28. North America Rennet Revenue (USD Million) By Type (2021-2032)
Figure 29. North America Rennet Revenue (USD Million) By Application (2021-2032)
Figure 30. North America Rennet Revenue (USD Million) By Product (2021-2032)
Figure 31. Europe Rennet Revenue (USD Million) By Type (2021-2032)
Figure 32. Europe Rennet Revenue (USD Million) By Application (2021-2032)
Figure 33. Europe Rennet Revenue (USD Million) By Product (2021-2032)
Figure 34. Asia Pacific Rennet Revenue (USD Million) By Type (2021-2032)
Figure 35. Asia Pacific Rennet Revenue (USD Million) By Application (2021-2032)
Figure 36. Asia Pacific Rennet Revenue (USD Million) By Product (2021-2032)
Figure 37. South America Rennet Revenue (USD Million) By Type (2021-2032)
Figure 38. South America Rennet Revenue (USD Million) By Application (2021-2032)
Figure 39. South America Rennet Revenue (USD Million) By Product (2021-2032)
Figure 40. Middle East and Africa Rennet Revenue (USD Million) By Type (2021-2032)
Figure 41. Middle East and Africa Rennet Revenue (USD Million) By Application (2021-2032)
Figure 42. Middle East and Africa Rennet Revenue (USD Million) By Product (2021-2032)
By Type
Animal-Derived Rennet
Microbial Rennet
FPC-Fermentation Produced Chymosin Rennet
Vegetable Rennet
By Form
Liquid
Powder
Paste
Countries Analyzed
North America (US, Canada, Mexico)
Europe (Germany, UK, France, Spain, Italy, Russia, Rest of Europe)
Asia Pacific (China, India, Japan, South Korea, Australia, South East Asia, Rest of Asia)
South America (Brazil, Argentina, Rest of South America)
Middle East and Africa (Saudi Arabia, UAE, Rest of Middle East, South Africa, Egypt, Rest of Africa)
