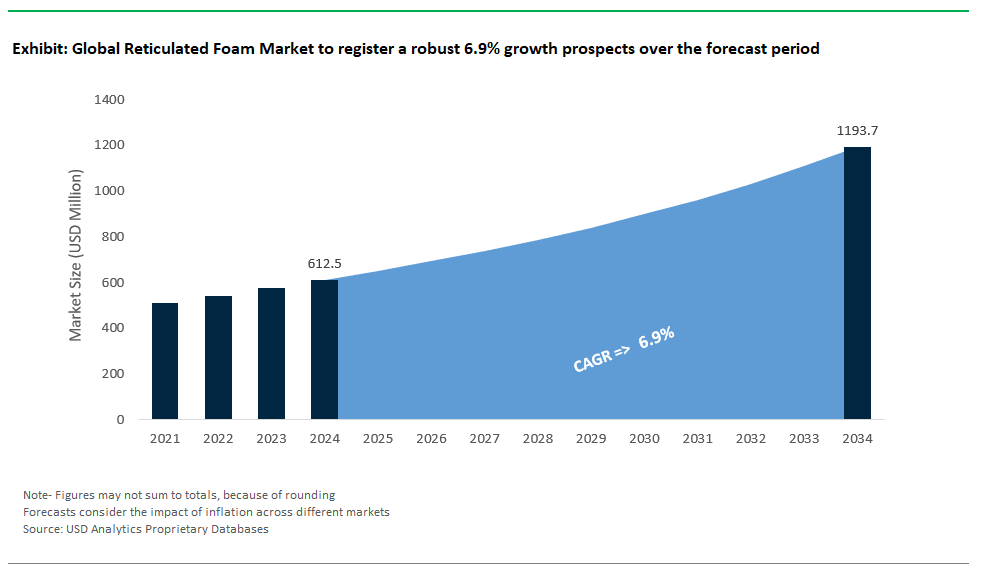
The Global Reticulated Foam Market Size is valued at $612.5 Million in 2024 and is forecast to register a growth rate (CAGR) of 6.9% to reach $1193.7 Million by 2034.
The market growth is driven by an increasing with increasing concerns about air and water pollution, there is a growing demand for high-performance filtration solutions in industries such as automotive, healthcare, and environmental engineering. Reticulated foam, with its high porosity and customizable pore size, is gaining popularity as a filtration media for applications ranging from automotive air filters to water purification systems. The ability of reticulated foam to efficiently capture particulate matter while maintaining low airflow resistance makes it a preferred choice for manufacturers seeking effective filtration solutions. Leading Companies focusing on Expansion in Healthcare Applications, Emerging Opportunities in 3D Printing, and others to boost market shares in the industry.
Reticulated Foam Market Overview
The reticulated foam market is characterized by its open-cell structure, offering high porosity and airflow, making it suitable for diverse applications across industries. It finds extensive use in filtration, acoustic insulation, automotive, healthcare, and industrial sectors. Market growth is propelled by increasing demand, driven by population growth, urbanization, and regulatory compliance. Manufacturers focus on innovation and customization to meet evolving customer needs, while sustainability initiatives address environmental concerns. Geographically, regions like Asia Pacific show significant potential due to rapid industrialization and growing demand from key sectors. Overall, the reticulated foam market presents promising opportunities for growth and innovation driven by its versatile properties and wide-ranging applications.
Reticulated Foam Market Competitive Landscape
The market report analyses the leading companies in the industry including Carpenter Co, FXI, Neveon, Polymer Technologies Inc, Rogers Foam Corp, Sheela Foam, WinFun Foam, Woodbridge Foam Corp, and Others.
Reticulated Foam Market Dynamics
Reticulated Foam Market Trends- Driven by the desire for increased comfort and noise reduction, the reticulated foam market is experiencing a surge in demand.
The surge in demand for reticulated foam is driven by consumers' desire for improved comfort and noise reduction. This trend is particularly evident in automotive seating, furniture, and bedding sectors, where reticulated foam's soft cushioning properties are highly sought after. Additionally, in applications such as acoustic panels, soundproofing materials, and speaker components, reticulated foam's sound-absorbing capabilities are meeting the increasing demand for quieter environments in residential, commercial, and industrial settings. Consequently, manufacturers are scaling up production to fulfill the growing need for reticulated foam products across diverse industries.
Reticulated Foam Market Driver- Driven by Sustainability Needs, Reticulated Foam Market Poised for Significant Growth.
With sustainability as a driving force, the reticulated foam market is on the brink of substantial expansion, spurred by industries' increasing emphasis on environmentally friendly materials and practices. Reticulated foam stands out with its distinctive open-cell structure and adaptability, offering solutions that meet sustainability targets across diverse sectors. Whether in automotive air filtration, acoustic insulation, or fluid management, reticulated foam delivers efficient performance while minimizing environmental footprint. Manufacturers are actively investing in research and development endeavors to bolster the sustainability credentials of reticulated foam, integrating recycled materials, curbing energy consumption in production, and exploring bio-based alternatives. Moreover, stringent regulations and consumer preferences for eco-conscious products are propelling the uptake of reticulated foam across filtration, sound absorption, fluid management, solar, and other applications. As the demand for sustainable solutions continues to escalate, the reticulated foam market is primed for further growth, fostering avenues for innovation and asserting its role in spearheading the green economy.
Reticulated Foam Market Opportunity- The reticulated foam market is poised for significant growth, driven by advancements in material science and manufacturing technologies.
The reticulated foam market is on the brink of substantial expansion, fueled by progress in material science and manufacturing methodologies. Breakthroughs in material science facilitate the creation of reticulated foam endowed with heightened filtration efficiency, greater durability, and enhanced sound absorption capabilities. Furthermore, advancements in manufacturing technologies, such as computer-controlled cutting and molding processes, are simplifying production procedures and cutting costs, thus broadening the accessibility of reticulated foam across diverse industries. These advancements are driving a surge in demand for reticulated foam across a spectrum of applications, spanning automotive, healthcare, filtration, acoustic insulation, and industrial sectors. Consequently, the reticulated foam market is witnessing robust growth, with ample prospects for further expansion as technology continues to evolve and market demand escalates.
Reticulated Foam Market Share Analysis- Reticulated Polyether Foam is poised to register the fastest growth rate (CAGR) over the forecast period from 2025 to 2034.
The Global Reticulated Foam Market is analyzed across Reticulated Polyester Foam, Reticulated Polyether Foam, and others. Reticulated Polyether Foam is poised to register the fastest growth. Reticulated polyether foam, characterized by its open-cell structure, offers high porosity and airflow, making it suitable for diverse applications across industries such as automotive, healthcare, filtration, acoustic insulation, and industrial sectors. It is commonly used in automotive seating, healthcare products like wound dressings and surgical sponges, filtration systems, and soundproofing materials due to its cushioning properties, biocompatibility, and sound absorption capabilities. With advancements in material science and manufacturing technologies, reticulated polyether foam is poised for significant growth in the foam market in the foreseeable future.
Reticulated Foam Market Share Analysis- Filtration held a significant market share in 2024
The Global Reticulated Foam Market is analyzed across various applications including Filtration, Sound Absorption, Fluid Management, Solar, and others. Of these, Filtration held a significant market share in 2024. Reticulated foam plays a crucial role in filtration applications across industries due to its high porosity and customizable pore sizes. It is widely utilized in automotive air filters, HVAC systems, and industrial filtration, effectively capturing particulate matter while maintaining low airflow resistance. This versatile material ensures improved indoor air quality, enhances engine performance, and supports various industrial processes by removing contaminants from air and liquids. With increasing concerns about environmental pollution, the demand for reticulated foam in filtration is expected to grow, driven by its superior efficiency and sustainability compared to traditional filtration materials.
Reticulated Foam Market Report Scope
|
Parameter
|
Details
|
|
Market Size (2024)
|
$612.5 Million
|
|
Market Size (2034)
|
$1193.7 Million
|
|
Market Growth Rate
|
6.9%
|
|
Segments
|
By Type (Reticulated Polyester Foam, Reticulated Polyether Foam), By Porosity ( Highly Porous (>75 PPI), Moderately Porous (50-75 PPI), Less Porous (<50 PPI)), By Application( Filtration, Sound Absorption, Fluid Management, Solar, Others)
|
|
Study Period
|
2019- 2024 and 2025-2034
|
|
Units
|
Revenue (USD)
|
|
Qualitative Analysis
|
Porter’s Five Forces, SWOT Profile, Market Share, Scenario Forecasts, Market Ecosystem, Company Ranking, Market Dynamics, Industry Benchmarking
|
|
Companies
|
Carpenter Co, FXI, Neveon, Polymer Technologies Inc, Rogers Foam Corp, Sheela Foam, WinFun Foam, Woodbridge Foam Corp, and Others.
|
|
Countries
|
US, Canada, Mexico, Germany, France, Spain, Italy, UK, Russia, China, India, Japan, South Korea, Australia, South East Asia, Brazil, Argentina, Middle East, Africa
|
Reticulated Foam Market Segmentation
By Type
- Reticulated Polyester Foam
- Reticulated Polyether Foam
By porosity
- Highly Porous (>75 PPI)
- Moderately Porous (50-75 PPI)
- Less Porous (<50 PPI)
By Application
- Filtration
- Sound Absorption
- Fluid Management
- Solar
- Others
By Region
- North America (United States, Canada, Mexico)
- Europe (Germany, France, United Kingdom, Spain, Italy, Others)
- Asia Pacific (China, India, Japan, South Korea, Australia, Others)
- Latin America (Brazil, Argentina, Others)
- Middle East and Africa (Saudi Arabia, UAE, Kuwait, Other Middle East, South Africa, Nigeria, Other Africa)
Reticulated Foam Companies Profiled in the Study
- Sheela Foam
- Woodbridge Foam Corp
- Neveon (Austria)
- Polymer Technologies Inc
- FXI (UnitedStates)
- Carpenter Co
- WinFun Foam
- Rogers Foam Corp
*List not exhaustive
Reticulated Foam Market Outlook 2024
1 Market Overview
1.1 Introduction to the Reticulated Foam Market
1.2 Scope of the Study
1.3 Research Objective
1.3.1 Key Market Scope and Segments
1.3.2 Players Covered
1.3.3 Years Considered
2 Executive Summary
2.1 2024 Reticulated Foam Industry- Market Statistics
3 Market Dynamics
3.1 Market Drivers
3.2 Market Challenges
3.3 Market Opportunities
3.4 Market Trends
4 Market Factor Analysis
4.1 Porter’s Five Forces
4.2 Market Entropy
4.2.1 Global Reticulated Foam Market Companies with Area Served
4.2.2 Products Offerings Global Reticulated Foam Market
5 Recession Impact Analysis and Outlook Scenarios
5.1.1 Recission Impact Analysis
5.1.2 Market Growth Scenario- Base Case
5.1.3 Market Growth Scenario- Reference Case
5.1.4 Market Growth Scenario- High Case
6 Global Reticulated Foam Market Trends
6.1 Global Reticulated Foam Revenue (USD Million) and CAGR (%) by Type (2018-2032)
6.2 Global Reticulated Foam Revenue (USD Million) and CAGR (%) by Applications (2018-2032)
6.3 Global Reticulated Foam Revenue (USD Million) and CAGR (%) by Regions (2018-2032)
7 Global Reticulated Foam Market Revenue (USD Million) by Type, and Applications (2018-2023)
7.1 Global Reticulated Foam Revenue (USD Million) by Type (2018-2023)
7.1.1 Global Reticulated Foam Revenue (USD Million), Market Share (%) by Type (2018-2023)
7.2 Global Reticulated Foam Revenue (USD Million) by Applications (2018-2023)
7.2.1 Global Reticulated Foam Revenue (USD Million), Market Share (%) by Applications (2018-2023)
8 Global Reticulated Foam Development Regional Status and Outlook
8.1 Global Reticulated Foam Revenue (USD Million) By Regions (2018-2023)
8.2 North America Reticulated Foam Revenue (USD Million) by Type, and Application (2018-2023)
8.2.1 North America Reticulated Foam Revenue (USD Million) by Country (2018-2023)
8.2.2 North America Reticulated Foam Revenue (USD Million) by Type (2018-2023)
8.2.3 North America Reticulated Foam Revenue (USD Million) by Applications (2018-2023)
8.3 Europe Reticulated Foam Revenue (USD Million), by Type, and Applications (USD Million) (2018-2023)
8.3.1 Europe Reticulated Foam Revenue (USD Million), by Country (2018-2023)
8.3.2 Europe Reticulated Foam Revenue (USD Million) by Type (2018-2023)
8.3.3 Europe Reticulated Foam Revenue (USD Million) by Applications (2018-2023)
8.4 Asia Pacific Reticulated Foam Revenue (USD Million), and Revenue (USD Million) by Type, and Applications (2018-2023)
8.4.1 Asia Pacific Reticulated Foam Revenue (USD Million) by Country (2018-2023)
8.4.2 Asia Pacific Reticulated Foam Revenue (USD Million) by Type (2018-2023)
8.4.3 Asia Pacific Reticulated Foam Revenue (USD Million) by Applications (2018-2023)
8.5 South America Reticulated Foam Revenue (USD Million), by Type, and Applications (2018-2023)
8.5.1 South America Reticulated Foam Revenue (USD Million), by Country (2018-2023)
8.5.2 South America Reticulated Foam Revenue (USD Million) by Type (2018-2023)
8.5.3 South America Reticulated Foam Revenue (USD Million) by Applications (2018-2023)
8.6 Middle East and Africa Reticulated Foam Revenue (USD Million), by Type, Technology, Application, Thickness (2018-2023)
8.6.1 Middle East and Africa Reticulated Foam Revenue (USD Million) by Country (2018-2023)
8.6.2 Middle East and Africa Reticulated Foam Revenue (USD Million) by Type (2018-2023)
8.6.3 Middle East and Africa Reticulated Foam Revenue (USD Million) by Applications (2018-2023)
9 Company Profiles
10 Global Reticulated Foam Market Revenue (USD Million), by Type, and Applications (2024-2032)
10.1 Global Reticulated Foam Revenue (USD Million) and Market Share (%) by Type (2024-2032)
10.1.1 Global Reticulated Foam Revenue (USD Million), and Market Share (%) by Type (2024-2032)
10.2 Global Reticulated Foam Revenue (USD Million) and Market Share (%) by Applications (2024-2032)
10.2.1 Global Reticulated Foam Revenue (USD Million), and Market Share (%) by Applications (2024-2032)
11 Global Reticulated Foam Development Regional Status and Outlook Forecast
11.1 Global Reticulated Foam Revenue (USD Million) By Regions (2024-2032)
11.2 North America Reticulated Foam Revenue (USD Million) by Type, and Applications (2024-2032)
11.2.1 North America Reticulated Foam Revenue (USD) Million by Country (2024-2032)
11.2.2 North America Reticulated Foam Revenue (USD Million), by Type (2024-2032)
11.2.3 North America Reticulated Foam Revenue (USD Million), Market Share (%) by Applications (2024-2032)
11.3 Europe Reticulated Foam Revenue (USD Million), by Type, and Applications (2024-2032)
11.3.1 Europe Reticulated Foam Revenue (USD Million), by Country (2024-2032)
11.3.2 Europe Reticulated Foam Revenue (USD Million), by Type (2024-2032)
11.3.3 Europe Reticulated Foam Revenue (USD Million), by Applications (2024-2032)
11.4 Asia Pacific Reticulated Foam Revenue (USD Million) by Type, and Applications (2024-2032)
11.4.1 Asia Pacific Reticulated Foam Revenue (USD Million), by Country (2024-2032)
11.4.2 Asia Pacific Reticulated Foam Revenue (USD Million), by Type (2024-2032)
11.4.3 Asia Pacific Reticulated Foam Revenue (USD Million), by Applications (2024-2032)
11.5 South America Reticulated Foam Revenue (USD Million), by Type, and Applications (2024-2032)
11.5.1 South America Reticulated Foam Revenue (USD Million), by Country (2024-2032)
11.5.2 South America Reticulated Foam Revenue (USD Million), by Type (2024-2032)
11.5.3 South America Reticulated Foam Revenue (USD Million), by Applications (2024-2032)
11.6 Middle East and Africa Reticulated Foam Revenue (USD Million), by Type, and Applications (2024-2032)
11.6.1 Middle East and Africa Reticulated Foam Revenue (USD Million), by region (2024-2032)
11.6.2 Middle East and Africa Reticulated Foam Revenue (USD Million), by Type (2024-2032)
11.6.3 Middle East and Africa Reticulated Foam Revenue (USD Million), by Applications (2024-2032)
12 Methodology and Data Sources
12.1 Methodology/Research Approach
12.1.1 Research Programs/Design
12.1.2 Market Size Estimation
12.1.3 Market Breakdown and Data Triangulation
12.2 Data Sources
12.2.1 Secondary Sources
12.2.2 Primary Sources
12.3 Disclaimer
List of Tables
Table 1 Market Segmentation Analysis
Table 2 Global Reticulated Foam Market Companies with Areas Served
Table 3 Products Offerings Global Reticulated Foam Market
Table 4 Low Growth Scenario Forecasts
Table 5 Reference Case Growth Scenario
Table 6 High Growth Case Scenario
Table 7 Global Reticulated Foam Revenue (USD Million) And CAGR (%) By Type (2018-2032)
Table 8 Global Reticulated Foam Revenue (USD Million) And CAGR (%) By Applications (2018-2032)
Table 9 Global Reticulated Foam Revenue (USD Million) And CAGR (%) By Regions (2018-2032)
Table 10 Global Reticulated Foam Revenue (USD Million) By Type (2018-2023)
Table 11 Global Reticulated Foam Revenue Market Share (%) By Type (2018-2023)
Table 12 Global Reticulated Foam Revenue (USD Million) By Applications (2018-2023)
Table 13 Global Reticulated Foam Revenue Market Share (%) By Applications (2018-2023)
Table 14 Global Reticulated Foam Market Revenue (USD Million) By Regions (2018-2023)
Table 15 Global Reticulated Foam Market Share (%) By Regions (2018-2023)
Table 16 North America Reticulated Foam Revenue (USD Million) By Country (2018-2023)
Table 17 North America Reticulated Foam Revenue (USD Million) By Type (2018-2023)
Table 18 North America Reticulated Foam Revenue (USD Million) By Applications (2018-2023)
Table 19 Europe Reticulated Foam Revenue (USD Million) By Country (2018-2023)
Table 20 Europe Reticulated Foam Revenue (USD Million) By Type (2018-2023)
Table 21 Europe Reticulated Foam Revenue (USD Million) By Applications (2018-2023)
Table 22 Asia Pacific Reticulated Foam Revenue (USD Million) By Country (2018-2023)
Table 23 Asia Pacific Reticulated Foam Revenue (USD Million) By Type (2018-2023)
Table 24 Asia Pacific Reticulated Foam Revenue (USD Million) By Applications (2018-2023)
Table 25 South America Reticulated Foam Revenue (USD Million) By Country (2018-2023)
Table 26 South America Reticulated Foam Revenue (USD Million) By Type (2018-2023)
Table 27 South America Reticulated Foam Revenue (USD Million) By Applications (2018-2023)
Table 28 Middle East and Africa Reticulated Foam Revenue (USD Million) By Region (2018-2023)
Table 29 Middle East and Africa Reticulated Foam Revenue (USD Million) By Type (2018-2023)
Table 30 Middle East and Africa Reticulated Foam Revenue (USD Million) By Applications (2018-2023)
Table 31 Financial Analysis
Table 32 Global Reticulated Foam Revenue (USD Million) By Type (2024-2032)
Table 33 Global Reticulated Foam Revenue Market Share (%) By Type (2024-2032)
Table 34 Global Reticulated Foam Revenue (USD Million) By Applications (2024-2032)
Table 35 Global Reticulated Foam Revenue Market Share (%) By Applications (2024-2032)
Table 36 Global Reticulated Foam Market Revenue (USD Million), And Revenue (USD Million) By Regions (2024-2032)
Table 37 North America Reticulated Foam Revenue (USD)By Country (2024-2032)
Table 38 North America Reticulated Foam Revenue (USD Million) By Type (2024-2032)
Table 39 North America Reticulated Foam Revenue (USD Million) By Applications (2024-2032)
Table 40 Europe Reticulated Foam Revenue (USD Million) By Country (2024-2032)
Table 41 Europe Reticulated Foam Revenue (USD Million) By Type (2024-2032)
Table 42 Europe Reticulated Foam Revenue (USD Million) By Applications (2024-2032)
Table 43 Asia Pacific Reticulated Foam Revenue (USD Million) By Country (2024-2032)
Table 44 Asia Pacific Reticulated Foam Revenue (USD Million) By Type (2024-2032)
Table 45 Asia Pacific Reticulated Foam Revenue (USD Million) By Applications (2024-2032)
Table 46 South America Reticulated Foam Revenue (USD Million) By Country (2024-2032)
Table 47 South America Reticulated Foam Revenue (USD Million) By Type (2024-2032)
Table 48 South America Reticulated Foam Revenue (USD Million) By Applications (2024-2032)
Table 49 Middle East and Africa Reticulated Foam Revenue (USD Million) By Region (2024-2032)
Table 50 Middle East and Africa Reticulated Foam Revenue (USD Million) By Region (2024-2032)
Table 51 Middle East and Africa Reticulated Foam Revenue (USD Million) By Type (2024-2032)
Table 52 Middle East and Africa Reticulated Foam Revenue (USD Million) By Applications (2024-2032)
Table 53 Research Programs/Design for This Report
Table 54 Key Data Information from Secondary Sources
Table 55 Key Data Information from Primary Sources
List of Figures
Figure 1 Market Scope
Figure 2 Porter’s Five Forces
Figure 3 Global Reticulated Foam Revenue (USD Million) By Type (2018-2023)
Figure 4 Global Reticulated Foam Revenue Market Share (%) By Type (2023)
Figure 5 Global Reticulated Foam Revenue (USD Million) By Applications (2018-2023)
Figure 6 Global Reticulated Foam Revenue Market Share (%) By Applications (2023)
Figure 7 Global Reticulated Foam Market Revenue (USD Million) By Regions (2018-2023)
Figure 8 Global Reticulated Foam Market Share (%) By Regions (2023)
Figure 9 North America Reticulated Foam Revenue (USD Million) By Country (2018-2023)
Figure 10 North America Reticulated Foam Revenue (USD Million) By Type (2018-2023)
Figure 11 North America Reticulated Foam Revenue (USD Million) By Applications (2018-2023)
Figure 12 Europe Reticulated Foam Revenue (USD Million) By Country (2018-2023)
Figure 13 Europe Reticulated Foam Revenue (USD Million) By Type (2018-2023)
Figure 14 Europe Reticulated Foam Revenue (USD Million) By Applications (2018-2023)
Figure 15 Asia Pacific Reticulated Foam Revenue (USD Million) By Country (2018-2023)
Figure 16 Asia Pacific Reticulated Foam Revenue (USD Million) By Type (2018-2023)
Figure 17 Asia Pacific Reticulated Foam Revenue (USD Million) By Applications (2018-2023)
Figure 18 South America Reticulated Foam Revenue (USD Million) By Country (2018-2023)
Figure 19 South America Reticulated Foam Revenue (USD Million) By Type (2018-2023)
Figure 20 South America Reticulated Foam Revenue (USD Million) By Applications (2018-2023)
Figure 21 Middle East and Africa Reticulated Foam Revenue (USD Million) By Region (2018-2023)
Figure 22 Middle East and Africa Reticulated Foam Revenue (USD Million) By Type (2018-2023)
Figure 23 Middle East and Africa Reticulated Foam Revenue (USD Million) By Applications (2018-2023)
Figure 24 Global Reticulated Foam Revenue (USD Million) By Type (2024-2032)
Figure 25 Global Reticulated Foam Revenue Market Share (%) By Type (2030)
Figure 26 Global Reticulated Foam Revenue (USD Million) By Applications (2024-2032)
Figure 27 Global Reticulated Foam Revenue Market Share (%) By Applications (2030)
Figure 28 Global Reticulated Foam Market Revenue (USD Million) By Regions (2024-2032)
Figure 29 North America Reticulated Foam Revenue (USD Million) By Country (2024-2032)
Figure 30 North America Reticulated Foam Revenue (USD Million) By Type (2024-2032)
Figure 31 North America Reticulated Foam Revenue (USD Million) By Applications (2024-2032)
Figure 32 Europe Reticulated Foam Revenue (USD Million) By Country (2024-2032)
Figure 33 Europe Reticulated Foam Revenue (USD Million) By Type (2024-2032)
Figure 34 Europe Reticulated Foam Revenue (USD Million) By Applications (2024-2032)
Figure 35 Asia Pacific Reticulated Foam Revenue (USD Million) By Country (2024-2032)
Figure 36 Asia Pacific Reticulated Foam Revenue (USD Million) By Type (2024-2032)
Figure 37 Asia Pacific Reticulated Foam Revenue (USD Million) By Applications (2024-2032)
Figure 38 South America Reticulated Foam Revenue (USD Million) By Country (2024-2032)
Figure 39 South America Reticulated Foam Revenue (USD Million) By Type (2024-2032)
Figure 40 South America Reticulated Foam Revenue (USD Million) By Applications (2024-2032)
Figure 41 Middle East and Africa Reticulated Foam Revenue (USD Million) By Region (2024-2032)
Figure 42 Middle East and Africa Reticulated Foam Revenue (USD Million) By Region (2024-2032)
Figure 43 Middle East and Africa Reticulated Foam Revenue (USD Million) By Type (2024-2032)
Figure 44 Middle East and Africa Reticulated Foam Revenue (USD Million) By Applications (2024-2032)
Figure 45 Bottom-Up and Top-Down Approaches for This Report
Figure 46 Data Triangulation
