
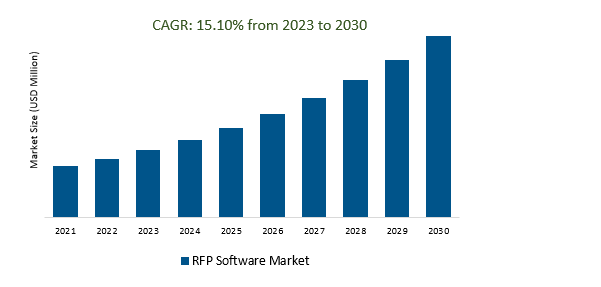
The Global RFP Software Market Size is estimated to register 15.1% growth over the forecast period from 2023 to 2030.
The market growth is driven by the increasing RFP software that integrates seamlessly with other procurement and vendor management tools and is in high demand to create a cohesive procurement ecosystem. Leading companies that are focused on Increased Adoption, Enhanced Integration, Customization and Personalization, Mobile and Remote Work, Environmental, Social, and Governance (ESG) Considerations, Artificial Intelligence-Driven Insights, and others to boost market shares in the industry.
The Request for Proposal (RFP) Software market was characterized by steady growth and transformation. Key trends included the rise of cloud-based solutions, integration with AI and automation, mobile accessibility, and a focus on advanced analytics and collaboration features. Organizations adopted RFP software to reduce costs, enhance compliance and risk management, and address the challenges of globalization and remote work. The market featured various players, such as RFPIO, Loopio, Qvidian (now part of Upland Software), and RFP360, catering to diverse industries and business needs.
AI and automation are fundamentally transforming the RFP Software market. These technologies are revolutionizing the RFP process by automating repetitive tasks, improving data analysis, and enhancing response recommendations. By reducing manual efforts and increasing efficiency, AI and automation are streamlining vendor selection and procurement operations. RFP software providers are increasingly integrating AI-driven features into their solutions to meet the growing demand for intelligent, data-driven decision-making in procurement.
Data security is a critical demand in the Request for Proposal (RFP) Software market. Organizations increasingly prioritize RFP software solutions that offer robust data security features to protect sensitive procurement information. This demand stems from the growing recognition of the importance of safeguarding confidential supplier and procurement data, especially in industries with stringent compliance requirements, such as healthcare and finance. RFP software providers are responding by implementing advanced encryption, access controls, user authentication, and audit trails to ensure data privacy and regulatory compliance, thereby addressing the pressing need for data security in the RFP Software market.
Globalization is reshaping the RFP Software market landscape. As businesses expand their operations across borders, the demand for RFP software solutions is growing to facilitate standardized procurement processes and effective vendor management on a global scale. RFP software is now crucial for organizations seeking to streamline their procurement operations, ensuring consistency and efficiency in vendor selection and negotiations regardless of geographic location. This trend is driving the development of RFP software with international capabilities, making it a key player in the global procurement ecosystem.
The Global RFP Software Market is analyzed across Cloud, On-Premise, and others. Cloud is poised to register the fastest growth. Cloud technology is a central driver in the RFP Software market, as organizations increasingly adopt cloud-based solutions for their scalability, accessibility, cost-efficiency, and streamlined procurement processes, making it a pivotal factor in market growth and modernization.
The Global RFP Software Market is analyzed across various Enterprise sizes including Large Enterprises, SMEs, and others. Of these, SMEs held a significant market share in 2023. SMEs are increasingly adopting RFP software to streamline procurement processes, improve vendor selection, and compete effectively. The market is responding with tailored, cost-effective solutions designed to meet the specific needs of SMEs, making this segment a dynamic and promising part of the RFP Software market.
By Deployment
By Enterprise Size
By End-User
By Region
*List not exhaustive
RFP Software Market Outlook 2023
1 Market Overview
1.1 Introduction to the RFP Software Market
1.2 Scope of the Study
1.3 Research Objective
1.3.1 Key Market Scope and Segments
1.3.2 Players Covered
1.3.3 Years Considered
2 Executive Summary
2.1 2023 RFP Software Industry- Market Statistics
3 Market Dynamics
3.1 Market Drivers
3.2 Market Challenges
3.3 Market Opportunities
3.4 Market Trends
4 Market Factor Analysis
4.1 Porter’s Five Forces
4.2 Market Entropy
4.2.1 Global RFP Software Market Companies with Area Served
4.2.2 Products Offerings Global RFP Software Market
5 COVID-19 Impact Analysis and Outlook Scenarios
5.1.1 Covid-19 Impact Analysis
5.1.2 Post-COVID-19 Scenario- Low Growth Case
5.1.3 Post-COVID-19 Scenario- Reference Growth Case
5.1.4 Post-COVID-19 Scenario- Low Growth Case
6 Global RFP Software Market Trends
6.1 Global RFP Software Revenue (USD Million) and CAGR (%) by Type (2018-2030)
6.2 Global RFP Software Revenue (USD Million) and CAGR (%) by Applications (2018-2030)
6.3 Global RFP Software Revenue (USD Million) and CAGR (%) by Regions (2018-2030)
7 Global RFP Software Market Revenue (USD Million) by Type, and Applications (2018-2022)
7.1 Global RFP Software Revenue (USD Million) by Type (2018-2022)
7.1.1 Global RFP Software Revenue (USD Million), Market Share (%) by Type (2018-2022)
7.2 Global RFP Software Revenue (USD Million) by Applications (2018-2022)
7.2.1 Global RFP Software Revenue (USD Million), Market Share (%) by Applications (2018-2022)
8 Global RFP Software Development Regional Status and Outlook
8.1 Global RFP Software Revenue (USD Million) By Regions (2018-2022)
8.2 North America RFP Software Revenue (USD Million) by Type, and Application (2018-2022)
8.2.1 North America RFP Software Revenue (USD Million) by Country (2018-2022)
8.2.2 North America RFP Software Revenue (USD Million) by Type (2018-2022)
8.2.3 North America RFP Software Revenue (USD Million) by Applications (2018-2022)
8.3 Europe RFP Software Revenue (USD Million), by Type, and Applications (USD Million) (2018-2022)
8.3.1 Europe RFP Software Revenue (USD Million), by Country (2018-2022)
8.3.2 Europe RFP Software Revenue (USD Million) by Type (2018-2022)
8.3.3 Europe RFP Software Revenue (USD Million) by Applications (2018-2022)
8.4 Asia Pacific RFP Software Revenue (USD Million), and Revenue (USD Million) by Type, and Applications (2018-2022)
8.4.1 Asia Pacific RFP Software Revenue (USD Million) by Country (2018-2022)
8.4.2 Asia Pacific RFP Software Revenue (USD Million) by Type (2018-2022)
8.4.3 Asia Pacific RFP Software Revenue (USD Million) by Applications (2018-2022)
8.5 South America RFP Software Revenue (USD Million), by Type, and Applications (2018-2022)
8.5.1 South America RFP Software Revenue (USD Million), by Country (2018-2022)
8.5.2 South America RFP Software Revenue (USD Million) by Type (2018-2022)
8.5.3 South America RFP Software Revenue (USD Million) by Applications (2018-2022)
8.6 Middle East and Africa RFP Software Revenue (USD Million), by Type, Technology, Application, Thickness (2018-2022)
8.6.1 Middle East and Africa RFP Software Revenue (USD Million) by Country (2018-2022)
8.6.2 Middle East and Africa RFP Software Revenue (USD Million) by Type (2018-2022)
8.6.3 Middle East and Africa RFP Software Revenue (USD Million) by Applications (2018-2022)
9 Company Profiles
10 Global RFP Software Market Revenue (USD Million), by Type, and Applications (2023-2030)
10.1 Global RFP Software Revenue (USD Million) and Market Share (%) by Type (2023-2030)
10.1.1 Global RFP Software Revenue (USD Million), and Market Share (%) by Type (2023-2030)
10.2 Global RFP Software Revenue (USD Million) and Market Share (%) by Applications (2023-2030)
10.2.1 Global RFP Software Revenue (USD Million), and Market Share (%) by Applications (2023-2030)
11 Global RFP Software Development Regional Status and Outlook Forecast
11.1 Global RFP Software Revenue (USD Million) By Regions (2023-2030)
11.2 North America RFP Software Revenue (USD Million) by Type, and Applications (2023-2030)
11.2.1 North America RFP Software Revenue (USD) Million by Country (2023-2030)
11.2.2 North America RFP Software Revenue (USD Million), by Type (2023-2030)
11.2.3 North America RFP Software Revenue (USD Million), Market Share (%) by Applications (2023-2030)
11.3 Europe RFP Software Revenue (USD Million), by Type, and Applications (2023-2030)
11.3.1 Europe RFP Software Revenue (USD Million), by Country (2023-2030)
11.3.2 Europe RFP Software Revenue (USD Million), by Type (2023-2030)
11.3.3 Europe RFP Software Revenue (USD Million), by Applications (2023-2030)
11.4 Asia Pacific RFP Software Revenue (USD Million) by Type, and Applications (2023-2030)
11.4.1 Asia Pacific RFP Software Revenue (USD Million), by Country (2023-2030)
11.4.2 Asia Pacific RFP Software Revenue (USD Million), by Type (2023-2030)
11.4.3 Asia Pacific RFP Software Revenue (USD Million), by Applications (2023-2030)
11.5 South America RFP Software Revenue (USD Million), by Type, and Applications (2023-2030)
11.5.1 South America RFP Software Revenue (USD Million), by Country (2023-2030)
11.5.2 South America RFP Software Revenue (USD Million), by Type (2023-2030)
11.5.3 South America RFP Software Revenue (USD Million), by Applications (2023-2030)
11.6 Middle East and Africa RFP Software Revenue (USD Million), by Type, and Applications (2023-2030)
11.6.1 Middle East and Africa RFP Software Revenue (USD Million), by Region (2023-2030)
11.6.2 Middle East and Africa RFP Software Revenue (USD Million), by Type (2023-2030)
11.6.3 Middle East and Africa RFP Software Revenue (USD Million), by Applications (2023-2030)
12 Methodology and Data Sources
12.1 Methodology/Research Approach
12.1.1 Research Programs/Design
12.1.2 Market Size Estimation
12.1.3 Market Breakdown and Data Triangulation
12.2 Data Sources
12.2.1 Secondary Sources
12.2.2 Primary Sources
12.3 Disclaimer
List of Tables
Table 1 Market Segmentation Analysis
Table 2 Global RFP Software Market Companies with Areas Served
Table 3 Products Offerings Global RFP Software Market
Table 4 Low Growth Scenario Forecasts
Table 5 Reference Case Growth Scenario
Table 6 High Growth Case Scenario
Table 7 Global RFP Software Revenue (USD Million) And CAGR (%) By Type (2018-2030)
Table 8 Global RFP Software Revenue (USD Million) And CAGR (%) By Applications (2018-2030)
Table 9 Global RFP Software Revenue (USD Million) And CAGR (%) By Regions (2018-2030)
Table 10 Global RFP Software Revenue (USD Million) By Type (2018-2022)
Table 11 Global RFP Software Revenue Market Share (%) By Type (2018-2022)
Table 12 Global RFP Software Revenue (USD Million) By Applications (2018-2022)
Table 13 Global RFP Software Revenue Market Share (%) By Applications (2018-2022)
Table 14 Global RFP Software Market Revenue (USD Million) By Regions (2018-2022)
Table 15 Global RFP Software Market Share (%) By Regions (2018-2022)
Table 16 North America RFP Software Revenue (USD Million) By Country (2018-2022)
Table 17 North America RFP Software Revenue (USD Million) By Type (2018-2022)
Table 18 North America RFP Software Revenue (USD Million) By Applications (2018-2022)
Table 19 Europe RFP Software Revenue (USD Million) By Country (2018-2022)
Table 20 Europe RFP Software Revenue (USD Million) By Type (2018-2022)
Table 21 Europe RFP Software Revenue (USD Million) By Applications (2018-2022)
Table 22 Asia Pacific RFP Software Revenue (USD Million) By Country (2018-2022)
Table 23 Asia Pacific RFP Software Revenue (USD Million) By Type (2018-2022)
Table 24 Asia Pacific RFP Software Revenue (USD Million) By Applications (2018-2022)
Table 25 South America RFP Software Revenue (USD Million) By Country (2018-2022)
Table 26 South America RFP Software Revenue (USD Million) By Type (2018-2022)
Table 27 South America RFP Software Revenue (USD Million) By Applications (2018-2022)
Table 28 Middle East and Africa RFP Software Revenue (USD Million) By Region (2018-2022)
Table 29 Middle East and Africa RFP Software Revenue (USD Million) By Type (2018-2022)
Table 30 Middle East and Africa RFP Software Revenue (USD Million) By Applications (2018-2022)
Table 31 Financial Analysis
Table 32 Global RFP Software Revenue (USD Million) By Type (2023-2030)
Table 33 Global RFP Software Revenue Market Share (%) By Type (2023-2030)
Table 34 Global RFP Software Revenue (USD Million) By Applications (2023-2030)
Table 35 Global RFP Software Revenue Market Share (%) By Applications (2023-2030)
Table 36 Global RFP Software Market Revenue (USD Million), And Revenue (USD Million) By Regions (2023-2030)
Table 37 North America RFP Software Revenue (USD)By Country (2023-2030)
Table 38 North America RFP Software Revenue (USD Million) By Type (2023-2030)
Table 39 North America RFP Software Revenue (USD Million) By Applications (2023-2030)
Table 40 Europe RFP Software Revenue (USD Million) By Country (2023-2030)
Table 41 Europe RFP Software Revenue (USD Million) By Type (2023-2030)
Table 42 Europe RFP Software Revenue (USD Million) By Applications (2023-2030)
Table 43 Asia Pacific RFP Software Revenue (USD Million) By Country (2023-2030)
Table 44 Asia Pacific RFP Software Revenue (USD Million) By Type (2023-2030)
Table 45 Asia Pacific RFP Software Revenue (USD Million) By Applications (2023-2030)
Table 46 South America RFP Software Revenue (USD Million) By Country (2023-2030)
Table 47 South America RFP Software Revenue (USD Million) By Type (2023-2030)
Table 48 South America RFP Software Revenue (USD Million) By Applications (2023-2030)
Table 49 Middle East and Africa RFP Software Revenue (USD Million) By Region (2023-2030)
Table 50 Middle East and Africa RFP Software Revenue (USD Million) By Region (2023-2030)
Table 51 Middle East and Africa RFP Software Revenue (USD Million) By Type (2023-2030)
Table 52 Middle East and Africa RFP Software Revenue (USD Million) By Applications (2023-2030)
Table 53 Research Programs/Design for This Report
Table 54 Key Data Information from Secondary Sources
Table 55 Key Data Information from Primary Sources
List of Figures
Figure 1 Market Scope
Figure 2 Porter’s Five Forces
Figure 3 Global RFP Software Revenue (USD Million) By Type (2018-2022)
Figure 4 Global RFP Software Revenue Market Share (%) By Type (2022)
Figure 5 Global RFP Software Revenue (USD Million) By Applications (2018-2022)
Figure 6 Global RFP Software Revenue Market Share (%) By Applications (2022)
Figure 7 Global RFP Software Market Revenue (USD Million) By Regions (2018-2022)
Figure 8 Global RFP Software Market Share (%) By Regions (2022)
Figure 9 North America RFP Software Revenue (USD Million) By Country (2018-2022)
Figure 10 North America RFP Software Revenue (USD Million) By Type (2018-2022)
Figure 11 North America RFP Software Revenue (USD Million) By Applications (2018-2022)
Figure 12 Europe RFP Software Revenue (USD Million) By Country (2018-2022)
Figure 13 Europe RFP Software Revenue (USD Million) By Type (2018-2022)
Figure 14 Europe RFP Software Revenue (USD Million) By Applications (2018-2022)
Figure 15 Asia Pacific RFP Software Revenue (USD Million) By Country (2018-2022)
Figure 16 Asia Pacific RFP Software Revenue (USD Million) By Type (2018-2022)
Figure 17 Asia Pacific RFP Software Revenue (USD Million) By Applications (2018-2022)
Figure 18 South America RFP Software Revenue (USD Million) By Country (2018-2022)
Figure 19 South America RFP Software Revenue (USD Million) By Type (2018-2022)
Figure 20 South America RFP Software Revenue (USD Million) By Applications (2018-2022)
Figure 21 Middle East and Africa RFP Software Revenue (USD Million) By Region (2018-2022)
Figure 22 Middle East and Africa RFP Software Revenue (USD Million) By Type (2018-2022)
Figure 23 Middle East and Africa RFP Software Revenue (USD Million) By Applications (2018-2022)
Figure 24 Global RFP Software Revenue (USD Million) By Type (2023-2030)
Figure 25 Global RFP Software Revenue Market Share (%) By Type (2030)
Figure 26 Global RFP Software Revenue (USD Million) By Applications (2023-2030)
Figure 27 Global RFP Software Revenue Market Share (%) By Applications (2030)
Figure 28 Global RFP Software Market Revenue (USD Million) By Regions (2023-2030)
Figure 29 North America RFP Software Revenue (USD Million) By Country (2023-2030)
Figure 30 North America RFP Software Revenue (USD Million) By Type (2023-2030)
Figure 31 North America RFP Software Revenue (USD Million) By Applications (2023-2030)
Figure 32 Europe RFP Software Revenue (USD Million) By Country (2023-2030)
Figure 33 Europe RFP Software Revenue (USD Million) By Type (2023-2030)
Figure 34 Europe RFP Software Revenue (USD Million) By Applications (2023-2030)
Figure 35 Asia Pacific RFP Software Revenue (USD Million) By Country (2023-2030)
Figure 36 Asia Pacific RFP Software Revenue (USD Million) By Type (2023-2030)
Figure 37 Asia Pacific RFP Software Revenue (USD Million) By Applications (2023-2030)
Figure 38 South America RFP Software Revenue (USD Million) By Country (2023-2030)
Figure 39 South America RFP Software Revenue (USD Million) By Type (2023-2030)
Figure 40 South America RFP Software Revenue (USD Million) By Applications (2023-2030)
Figure 41 Middle East and Africa RFP Software Revenue (USD Million) By Region (2023-2030)
Figure 42 Middle East and Africa RFP Software Revenue (USD Million) By Region (2023-2030)
Figure 43 Middle East and Africa RFP Software Revenue (USD Million) By Type (2023-2030)
Figure 44 Middle East and Africa RFP Software Revenue (USD Million) By Applications (2023-2030)
Figure 45 Bottom-Up and Top-Down Approaches For This Report
Figure 46 Data Triangulation
By Deployment
By Enterprise Size
By End-User
By Region