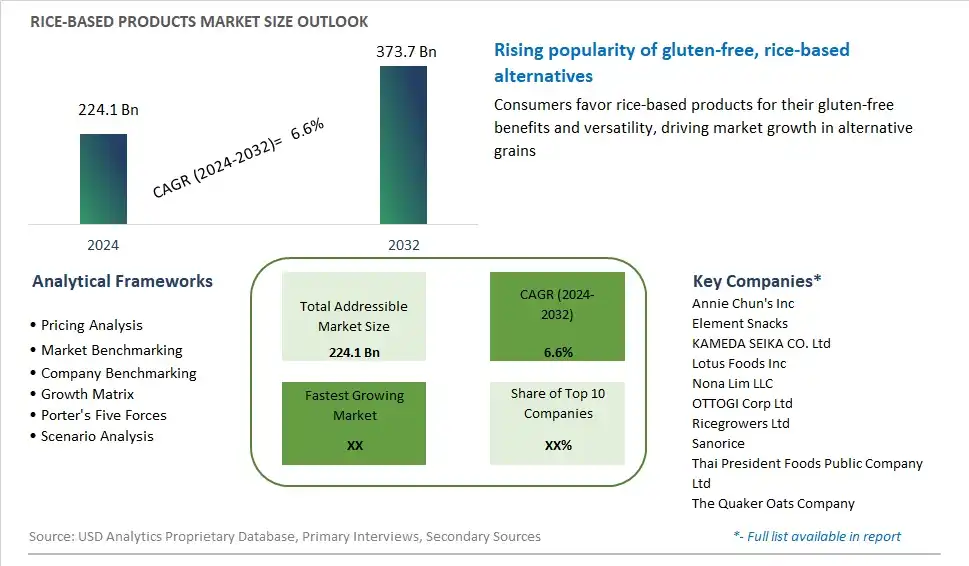
Global Rice-based Products Market Size is valued at $224.1 Billion in 2024 and is forecast to register a growth rate (CAGR) of 6.6% to reach $373.7 Billion by 2032.
The global Rice-based Products Market Comprehensive Study analyzes and forecasts the market size across 6 regions and 24 countries for diverse segments -By Product (Rice Snacks, Rice Noodles, Rice Puddings, Rice Cakes, Rice Balls, Others), By Distribution Channel (Supermarkets/Hypermarkets, Online, Others), By Type (Conventional, Organic)
An Introduction to Rice-based Products Market
The rice-based products market continues to flourish in 2024, driven by the versatile nature of rice and its widespread consumption across various cultures. From rice flour and rice cakes to rice-based snacks and ready-to-eat meals, manufacturers are capitalizing on the inherent nutritional benefits and culinary appeal of rice. With an increasing focus on gluten-free and allergen-friendly alternatives, rice-based products are gaining traction as convenient and versatile options for consumers seeking healthier and more diverse food choices. As sustainability concerns shape consumer preferences, the market is witnessing a rise in organic and ethically sourced rice-based offerings that resonate with environmentally conscious consumers.
Rice based Products Competitive Landscape
The market report analyses the leading companies in the industry including Annie Chun's Inc, Element Snacks, KAMEDA SEIKA CO. Ltd, Lotus Foods Inc, Nona Lim LLC, OTTOGI Corp Ltd, Ricegrowers Ltd, Sanorice, Thai President Foods Public Company Ltd, The Quaker Oats Company, and Others.
Rice based Products Market Dynamics
Market Trend: Growing Popularity of Gluten-Free Diets
The most prominent trend in the Rice-Based Products Market is the growing popularity of gluten-free diets. As more consumers seek gluten-free alternatives due to celiac disease, gluten sensitivity, or a general preference for gluten-free foods, rice-based products are gaining traction. This trend is driven by the increasing awareness of the health benefits of gluten-free diets and the rising demand for gluten-free options in various food categories. Rice-based products, such as rice flour, rice noodles, and rice snacks, are becoming staples in gluten-free households
Market Driver: Versatility and Nutritional Benefits
The versatility and nutritional benefits of rice are major drivers of the Rice-Based Products Market. Rice is a staple food in many cultures and can be used in a wide range of products, from flours and cereals to snacks and beverages. Its high nutritional value, including being a good source of energy, vitamins, and minerals, makes it an appealing choice for health-conscious consumers. The growing interest in diverse and nutritious food options is driving the demand for rice-based products
Market Opportunity: Innovation in Product Development
A significant opportunity in the Rice-Based Products Market lies in innovation in product development. As the demand for rice-based products grows, there is potential for companies to develop new and unique products that cater to changing consumer preferences. This includes exploring different rice varieties, such as brown rice and black rice, and incorporating them into innovative products like rice-based snacks, desserts, and beverages. By staying ahead of consumer trends and offering novel rice-based products, companies can capture a larger market share
Rice-based Products Market Share Analysis: Product (Rice Snacks, Rice Noodles, Rice Puddings, Rice Cakes, Rice Balls, Others)
Rice snacks are expected to be the fastest-growing segment in the Rice-based Products Market by product to 2032. The increasing demand for healthy and convenient snack options drives the growth of the rice snacks segment. Consumers are increasingly seeking low-calorie, gluten-free, and nutritious snacks that align with their health and wellness goals. Rice snacks, available in various flavors and forms, appeal to a wide range of consumers, including those with dietary restrictions and preferences. Additionally, the rise of on-the-go lifestyles and the growing trend of snacking between meals contribute to the segment's rapid growth. The expanding availability of rice snacks in mainstream retail channels further supports the segment's expansion.
Rice-based Products Market Share Analysis: Distribution Channel (Supermarkets/Hypermarkets, Online, Others)
The online distribution channel is anticipated to be the fastest-growing segment in the Rice-based Products Market by distribution channel to 2032. The convenience and accessibility of online shopping, combined with the growing consumer preference for e-commerce, drive the rapid growth of this segment. Online platforms offer a wide variety of rice-based products, detailed product descriptions, and customer reviews, making it easier for consumers to make informed purchasing decisions. The COVID-19 pandemic has further accelerated the shift towards online shopping, as consumers seek contactless and convenient ways to purchase their favorite products. Subscription services and direct-to-consumer models also contribute to the segment's expansion, providing consumers with regular deliveries of their preferred rice-based products.
Rice-based Products Market Share Analysis: Type (Conventional, Organic)
The organic segment is projected to be the fastest-growing in the Rice-based Products Market by type to 2032. The rising consumer awareness of health and wellness, coupled with the increasing demand for clean label and organic products, drives the growth of the organic segment. Consumers are becoming more conscious of the ingredients and sourcing practices of the products they consume, leading to a preference for organic rice-based products. Additionally, the perception of organic products as being healthier and more environmentally friendly contributes to the segment's rapid growth. The expanding availability of organic rice-based products in various retail channels, including specialty stores and online platforms, further supports the growth of this segment.
Rice based Products Market Segmentation
By Product
Rice Snacks
Rice Noodles
Rice Puddings
Rice Cakes
Rice Balls
Others
By Distribution Channel
Supermarkets/Hypermarkets
Online
Others
By Type
Conventional
Organic
Countries Analyzed
North America (US, Canada, Mexico)
Europe (Germany, UK, France, Spain, Italy, Russia, Rest of Europe)
Asia Pacific (China, India, Japan, South Korea, Australia, South East Asia, Rest of Asia)
South America (Brazil, Argentina, Rest of South America)
Middle East and Africa (Saudi Arabia, UAE, Rest of Middle East, South Africa, Egypt, Rest of Africa)
Rice based Products Companies Profiled in the Study
Annie Chun's Inc
Element Snacks
KAMEDA SEIKA CO. Ltd
Lotus Foods Inc
Nona Lim LLC
OTTOGI Corp Ltd
Ricegrowers Ltd
Sanorice
Thai President Foods Public Company Ltd
The Quaker Oats Company
*- List Not Exhaustive
Chapter 1. TABLE OF CONTENTS
Chapter 2. Introduction to Rice based Products Market
2.1. Market Overview
2.2. Key Statistics and Report Highlights
2.3. Scope of the Comprehensive Study
2.3.1. Market Definition
2.3.2 Countries and Regions Covered
2.3.3 Research Objective
2.3.4 Units, Currency, and Conversions
2.3.5 Industry Value Chain
2.4. Key Market Segments
2.5. Key Companies
2.6. Study Period
Chapter 3. Strategic Analysis Review
3.1. Rice based Products Pricing Analysis and Forecast
3.2. Porter’s Five Forces
3.3. Market Ecosystem
3.4. SWOT Analysis
3.5. Regulatory Scenario
3.3. Effects of Inflation, Russia-Ukraine War, moderating economic growth, and other macroeconomic factors
Chapter 4. Competitive Landscape
4.1. Market Share Analysis
4.1.1. Global Rice based Products Market Share by Company, 2023
4.1.2. Product Offerings of Leading Rice based Products Companies
4.2. Market Entropy
4.2.1. New Product Launches in the Industry
4.2.2. Mergers, Acquisitions, Joint ventures, and Partnerships
4.3. Key Strategies and Best Practices
Chapter 5. Global Market Projections: Best, Reference, and Low Case Scenarios
5.1. Growth Analysis- Case Scenario Definitions
5.2. Low Growth Case Scenario Forecasts
5.3. Reference Growth Case Scenario Forecasts
5.4. High Growth Case Scenario Forecasts
Chapter 6. Market Dynamics
6.1. Rice based Products Market Drivers
6.2. Rice based Products Market Challenges
6.6. Rice based Products Market Opportunities
6.4. Rice based Products Market Trends
Chapter 7. Global Rice based Products Market Outlook Trends
7.1. Global Rice based Products Revenue (USD Million) and CAGR (%) by Type (2021-2032)
7.2. Global Rice based Products Revenue (USD Million) and CAGR (%) by Application (2021-2032)
7.3. Global Rice based Products Revenue (USD Million) and CAGR (%) by Product (2021-2032)
By Product
Rice Snacks
Rice Noodles
Rice Puddings
Rice Cakes
Rice Balls
Others
By Distribution Channel
Supermarkets/Hypermarkets
Online
Others
By Type
Conventional
Organic
Chapter 8. Global Rice based Products Regional Analysis and Outlook
8.1. Global Rice based Products Revenue (USD Million) By Regions (2021- 2032)
8.2. North America Rice based Products Revenue (USD Million) by Country (2021-2032)
8.2.1. United States Rice based Products Regional Analysis and Outlook
8.2.2. Canada Rice based Products Regional Analysis and Outlook
8.2.3. Mexico Rice based Products Regional Analysis and Outlook
8.3. Europe Rice based Products Revenue (USD Million), by Country (2021-2032)
8.3.1. Germany Rice based Products Regional Analysis and Outlook
8.3.2. France Rice based Products Regional Analysis and Outlook
8.3.3. United Kingdom Rice based Products Regional Analysis and Outlook
8.3.4. Spain Rice based Products Regional Analysis and Outlook
8.3.5. Italy Rice based Products Regional Analysis and Outlook
8.3.6. Russia Rice based Products Regional Analysis and Outlook
8.3.7. Rest of Europe Rice based Products Regional Analysis and Outlook
8.4. Asia Pacific Rice based Products Revenue (USD Million) by Country (2021-2032)
8.4.1. China Rice based Products Regional Analysis and Outlook
8.4.2. Japan Rice based Products Regional Analysis and Outlook
8.4.3. India Rice based Products Regional Analysis and Outlook
8.4.4. South Korea Rice based Products Regional Analysis and Outlook
8.4.5. Australia Rice based Products Regional Analysis and Outlook
8.4.6. South East Asia Rice based Products Regional Analysis and Outlook
8.4.7. Rest of Asia Pacific Rice based Products Regional Analysis and Outlook
8.5. South America Rice based Products Revenue (USD Million), by Country (2021-2032)
8.5.1. Brazil Rice based Products Regional Analysis and Outlook
8.5.2. Argentina Rice based Products Regional Analysis and Outlook
8.5.3. Rest of South America Rice based Products Regional Analysis and Outlook
8.6. Middle East and Africa Rice based Products Revenue (USD Million) by Country (2021-2032)
8.6.1. Middle East Rice based Products Regional Analysis and Outlook
8.6.2. Africa Rice based Products Regional Analysis and Outlook
Chapter 9. North America Rice based Products Analysis and Outlook
9.1. North America Rice based Products Revenue (USD Million) by Segments (2021-2032)
9.1.1. North America Rice based Products Revenue (USD Million) by Type (2021-2032)
9.1.2. North America Rice based Products Revenue (USD Million) by Application (2021-2032)
9.1.3. North America Rice based Products Revenue (USD Million) by Product (2021-2032)
By Product
Rice Snacks
Rice Noodles
Rice Puddings
Rice Cakes
Rice Balls
Others
By Distribution Channel
Supermarkets/Hypermarkets
Online
Others
By Type
Conventional
Organic
Chapter 10. Europe Rice based Products Analysis and Outlook
10.1. Europe Rice based Products Revenue (USD Million), by Segments (USD Million) (2021-2032)
10.1.1. Europe Rice based Products Revenue (USD Million) by Type (2021-2032)
10.1.2. Europe Rice based Products Revenue (USD Million) by Application (2021-2032)
10.1.3. Europe Rice based Products Revenue (USD Million) by Product (2021-2032)
By Product
Rice Snacks
Rice Noodles
Rice Puddings
Rice Cakes
Rice Balls
Others
By Distribution Channel
Supermarkets/Hypermarkets
Online
Others
By Type
Conventional
Organic
Chapter 11. Asia Pacific Rice based Products Analysis and Outlook
11.1. Asia Pacific Rice based Products Revenue (USD Million), and Revenue (USD Million) by Segments (2021-2032)
11.1.1. Asia Pacific Rice based Products Revenue (USD Million) by Type (2021-2032)
11.1.2. Asia Pacific Rice based Products Revenue (USD Million) by Application (2021-2032)
11.1.3. Asia Pacific Rice based Products Revenue (USD Million) by Product (2021-2032)
By Product
Rice Snacks
Rice Noodles
Rice Puddings
Rice Cakes
Rice Balls
Others
By Distribution Channel
Supermarkets/Hypermarkets
Online
Others
By Type
Conventional
Organic
Chapter 12. South America Rice based Products Analysis and Outlook
12.1. South America Rice based Products Revenue (USD Million), by Segments (2021-2032)
12.1.1. South America Rice based Products Revenue (USD Million) by Type (2021-2032)
12.1.2. South America Rice based Products Revenue (USD Million) by Application (2021-2032)
12.1.3. South America Rice based Products Revenue (USD Million) by Product (2021-2032)
By Product
Rice Snacks
Rice Noodles
Rice Puddings
Rice Cakes
Rice Balls
Others
By Distribution Channel
Supermarkets/Hypermarkets
Online
Others
By Type
Conventional
Organic
Chapter 13. Middle East and Africa Rice based Products Analysis and Outlook
13.1. Middle East and Africa Rice based Products Revenue (USD Million), by Segments (2021-2032)
13.1.1. Middle East and Africa Rice based Products Revenue (USD Million) by Type (2021-2032)
13.1.2. Middle East and Africa Rice based Products Revenue (USD Million) by Application (2021-2032)
13.1.3. Middle East and Africa Rice based Products Revenue (USD Million) by Product (2021-2032)
By Product
Rice Snacks
Rice Noodles
Rice Puddings
Rice Cakes
Rice Balls
Others
By Distribution Channel
Supermarkets/Hypermarkets
Online
Others
By Type
Conventional
Organic
Chapter 14. Rice based Products Company Profiles
14.1 Business Overview
14.2 Product Profiles
14.3 SWOT Profiles
14.5 Recent Developments
14.6 Financial Profile
List of Companies
Annie Chun's Inc
Element Snacks
KAMEDA SEIKA CO. Ltd
Lotus Foods Inc
Nona Lim LLC
OTTOGI Corp Ltd
Ricegrowers Ltd
Sanorice
Thai President Foods Public Company Ltd
The Quaker Oats Company
15. Methodology and Data Sources
15.1 Customization Offerings
15.2 Subscription Services
15.3 Related Reports
15.4 Publisher Expertise
LIST OF TABLES
Table 1 Market Segmentation Analysis
Table 2 Global Rice based Products Market Share of Leading Companies, 2023
Table 3 Product Offerings of Leading Companies
Table 4 Low Growth Scenario Forecasts
Table 5 Reference Case Growth Scenario
Table 6 High Growth Case Scenario
Table 7 Global Rice based Products Revenue (USD Million) And CAGR (%) By Type (2021-2032)
Table 8 Global Rice based Products Revenue (USD Million) And CAGR (%) By Application (2021-2032)
Table 9 Global Rice based Products Revenue (USD Million) And CAGR (%) By Product (2021-2032)
Table 10 Global Rice based Products Market Revenue (USD Million) By Regions (2021-2032)
Table 11 Global Rice based Products Market Share (%) By Regions (2021-2032)
Table 12 North America Rice based Products Revenue (USD Million) By Country (2021-2032)
Table 13 Europe Rice based Products Revenue (USD Million) By Country (2021-2032)
Table 14 Asia Pacific Rice based Products Revenue (USD Million) By Country (2021-2032)
Table 15 South America Rice based Products Revenue (USD Million) By Country (2021-2032)
Table 16 Middle East and Africa Rice based Products Revenue (USD Million) By Region (2021-2032)
Table 17 North America Rice based Products Revenue (USD Million) By Type (2021-2032)
Table 18 North America Rice based Products Revenue (USD Million) By Application (2021-2032)
Table 19 North America Rice based Products Revenue (USD Million) By Product (2021-2032)
Table 20 Europe Rice based Products Revenue (USD Million) By Type (2021-2032)
Table 21 Europe Rice based Products Revenue (USD Million) By Application (2021-2032)
Table 22 Europe Rice based Products Revenue (USD Million) By Product (2021-2032)
Table 23 Asia Pacific Rice based Products Revenue (USD Million) By Type (2021-2032)
Table 24 Asia Pacific Rice based Products Revenue (USD Million) By Application (2021-2032)
Table 25 Asia Pacific Rice based Products Revenue (USD Million) By Product (2021-2032)
Table 26 South America Rice based Products Revenue (USD Million) By Type (2021-2032)
Table 27 South America Rice based Products Revenue (USD Million) By Application (2021-2032)
Table 28 South America Rice based Products Revenue (USD Million) By Product (2021-2032)
Table 29 Middle East and Africa Rice based Products Revenue (USD Million) By Type (2021-2032)
Table 30 Middle East and Africa Rice based Products Revenue (USD Million) By Application (2021-2032)
Table 31 Middle East and Africa Rice based Products Revenue (USD Million) By Product (2021-2032)
LIST OF FIGURES
Figure 1. Market Scope
Figure 2. Pricing Forecasts Per Unit, 2023- 2032
Figure 3. Porter’s Five Forces
Figure 4. Global Rice based Products Market Revenue (USD Million) By Regions (2021-2032)
Figure 5. Global Rice based Products Market Share (%) By Regions (2023)
Figure 6. North America Rice based Products Revenue (USD Million) By Country (2021-2032)
Figure 7. United States Rice based Products Revenue (USD Million) By Country (2021-2032)
Figure 8. Canada Rice based Products Revenue (USD Million) By Country (2021-2032)
Figure 9. Mexico Rice based Products Revenue (USD Million) By Country (2021-2032)
Figure 10. Europe Rice based Products Revenue (USD Million) By Country (2021-2032)
Figure 11. Germany Rice based Products Revenue (USD Million) By Country (2021-2032)
Figure 12. France Rice based Products Revenue (USD Million) By Country (2021-2032)
Figure 13. United Kingdom Rice based Products Revenue (USD Million) By Country (2021-2032)
Figure 14. Spain Rice based Products Revenue (USD Million) By Country (2021-2032)
Figure 15. Italy Rice based Products Revenue (USD Million) By Country (2021-2032)
Figure 16. Russia Rice based Products Revenue (USD Million) By Country (2021-2032)
Figure 17. Rest of Europe Rice based Products Revenue (USD Million) By Country (2021-2032)
Figure 11. Asia Pacific Rice based Products Revenue (USD Million) By Country (2021-2032)
Figure 12. China Rice based Products Revenue (USD Million) By Country (2021-2032)
Figure 13. Japan Rice based Products Revenue (USD Million) By Country (2021-2032)
Figure 14. India Rice based Products Revenue (USD Million) By Country (2021-2032)
Figure 15. South Korea Rice based Products Revenue (USD Million) By Country (2021-2032)
Figure 16. Australia Rice based Products Revenue (USD Million) By Country (2021-2032)
Figure 17. South East Asia Rice based Products Revenue (USD Million) By Country (2021-2032)
Figure 18. South America Rice based Products Revenue (USD Million) By Country (2021-2032)
Figure 19. Brazil Rice based Products Revenue (USD Million) By Country (2021-2032)
Figure 20. Argentina Rice based Products Revenue (USD Million) By Country (2021-2032)
Figure 21. Rest of Asia Pacific Rice based Products Revenue (USD Million) By Country (2021-2032)
Figure 22. Middle East and Africa Rice based Products Revenue (USD Million) By Region (2021-2032)
Figure 23. Saudi Arabia Rice based Products Revenue (USD Million) By Region (2021-2032)
Figure 24. The UAE Rice based Products Revenue (USD Million) By Region (2021-2032)
Figure 25. Rest of Middle East Rice based Products Revenue (USD Million) By Region (2021-2032)
Figure 26. South Africa Rice based Products Revenue (USD Million) By Region (2021-2032)
Figure 27. Africa Rice based Products Revenue (USD Million) By Region (2021-2032)
Figure 28. North America Rice based Products Revenue (USD Million) By Type (2021-2032)
Figure 29. North America Rice based Products Revenue (USD Million) By Application (2021-2032)
Figure 30. North America Rice based Products Revenue (USD Million) By Product (2021-2032)
Figure 31. Europe Rice based Products Revenue (USD Million) By Type (2021-2032)
Figure 32. Europe Rice based Products Revenue (USD Million) By Application (2021-2032)
Figure 33. Europe Rice based Products Revenue (USD Million) By Product (2021-2032)
Figure 34. Asia Pacific Rice based Products Revenue (USD Million) By Type (2021-2032)
Figure 35. Asia Pacific Rice based Products Revenue (USD Million) By Application (2021-2032)
Figure 36. Asia Pacific Rice based Products Revenue (USD Million) By Product (2021-2032)
Figure 37. South America Rice based Products Revenue (USD Million) By Type (2021-2032)
Figure 38. South America Rice based Products Revenue (USD Million) By Application (2021-2032)
Figure 39. South America Rice based Products Revenue (USD Million) By Product (2021-2032)
Figure 40. Middle East and Africa Rice based Products Revenue (USD Million) By Type (2021-2032)
Figure 41. Middle East and Africa Rice based Products Revenue (USD Million) By Application (2021-2032)
Figure 42. Middle East and Africa Rice based Products Revenue (USD Million) By Product (2021-2032)
By Product
Rice Snacks
Rice Noodles
Rice Puddings
Rice Cakes
Rice Balls
Others
By Distribution Channel
Supermarkets/Hypermarkets
Online
Others
By Type
Conventional
Organic
Countries Analyzed
North America (US, Canada, Mexico)
Europe (Germany, UK, France, Spain, Italy, Russia, Rest of Europe)
Asia Pacific (China, India, Japan, South Korea, Australia, South East Asia, Rest of Asia)
South America (Brazil, Argentina, Rest of South America)
Middle East and Africa (Saudi Arabia, UAE, Rest of Middle East, South Africa, Egypt, Rest of Africa)
