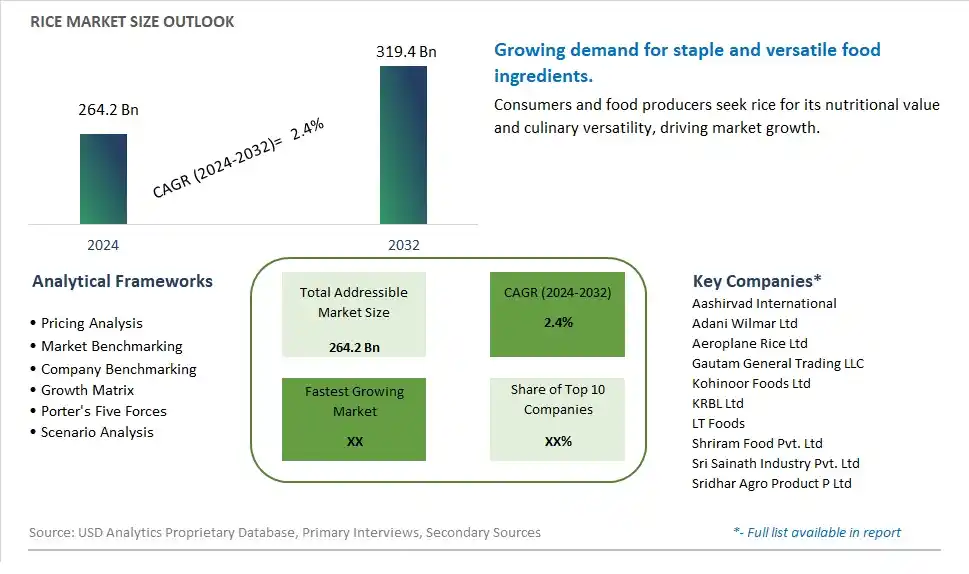
Global Rice Market Size is valued at $264.2 Billion in 2024 and is forecast to register a growth rate (CAGR) of 2.4% to reach $319.4 Billion by 2032.
The global Rice Market Comprehensive Study analyzes and forecasts the market size across 6 regions and 24 countries for diverse segments -By Product (Long-grain, Medium-grain, Short-grain), By Distribution Channel (Offline, Online)
An Introduction to Rice Market
The rice market in 2024 remains a cornerstone of global agriculture and food security, with rice being a staple food for a significant portion of the world's population. Despite facing challenges such as climate change, environmental sustainability, and fluctuating market dynamics, the rice market continues to thrive due to its indispensable role in global food systems. In response to shifting consumer preferences and dietary trends, rice producers and processors are focusing on innovation, diversification, and sustainability to meet evolving market demands. This includes the development of specialty rice varieties, adoption of precision agriculture techniques, and implementation of eco-friendly farming practices. Moreover, advancements in rice processing technologies and distribution channels are improving market efficiency and ensuring the availability of high-quality rice products to consumers worldwide. Additionally, initiatives to promote rice consumption through educational campaigns, culinary innovations, and nutritional awareness programs are driving market growth and fostering greater appreciation for rice as a versatile and nutritious food staple.
Rice Competitive Landscape
The market report analyses the leading companies in the industry including Aashirvad International, Adani Wilmar Ltd, Aeroplane Rice Ltd, Gautam General Trading LLC, Kohinoor Foods Ltd, KRBL Ltd, LT Foods, Shriram Food Pvt. Ltd, Sri Sainath Industry Pvt. Ltd, Sridhar Agro Product P Ltd, and Others.
Rice Market Dynamics
Rice Market Trend: Growing Demand for Specialty and Organic Varieties
A prominent trend in the rice market is the increasing consumer demand for specialty and organic rice varieties. As health and sustainability concerns gain prominence, consumers are seeking rice options that offer unique flavors, nutritional benefits, and environmental sustainability. Specialty rice varieties such as basmati, jasmine, and arborio are experiencing heightened demand due to their distinct taste profiles and culinary versatility. Additionally, organic rice, cultivated without synthetic pesticides or fertilizers, is gaining popularity among health-conscious consumers who prioritize organic and non-GMO products. This trend reflects a shift towards premiumization and sustainability in the rice market.
Market Driver: Rising Consumption in Emerging Economies
A key driver for the rice market is the rising consumption of rice in emerging economies, particularly in Asia. Rice is a staple food in many Asian countries, where it serves as a primary source of nutrition and energy for millions of people. Rapid population growth, urbanization, and increasing disposable incomes in countries such as China, India, and Indonesia are driving up rice consumption levels. Additionally, rice plays a significant cultural and culinary role in Asian cuisines, further fueling demand. The growing population and changing dietary preferences in these regions contribute to the overall expansion of the global rice market.
Market Opportunity: Diversification of Product Offerings and Value-Added Processing
An opportunity for the rice market lies in the diversification of product offerings and value-added processing. Manufacturers can capitalize on consumer demand for convenience, nutrition, and flavor by introducing innovative rice products such as pre-cooked rice, flavored rice blends, and fortified rice with added vitamins and minerals. Furthermore, value-added processing techniques such as parboiling, milling, and polishing can enhance the quality, shelf life, and nutritional value of rice products, appealing to discerning consumers. Additionally, targeting niche markets with specialty rice varieties and promoting the health benefits of rice consumption can open up new avenues for growth and differentiation in the market. By embracing product innovation and value-added processing, companies can position themselves competitively and tap into emerging consumer preferences in the dynamic rice market.
Rice Market Share Analysis: Long-grain held the dominant market share in 2024
In the segmented landscape of the Rice Market categorized by Product, Long-grain rice is the largest and most prevalent segment, driven by several key factors. Long-grain rice is favored by consumers worldwide for its distinct characteristics, including its slender shape, fluffy texture, and ability to remain separate when cooked. Its versatility makes it suitable for a wide range of culinary applications, from savory dishes like pilafs and stir-fries to side dishes and even desserts. Additionally, long-grain rice is often perceived as a staple food item in many cultures and cuisines, further contributing to its widespread consumption. Further, long-grain rice varieties are typically more readily available and affordable compared to medium-grain and short-grain varieties, making them accessible to a larger consumer base. As consumers continue to incorporate rice into their diets as a staple food item, the dominance of Long-grain rice in the Rice Market is expected to persist, driving overall market sales and growth.
Rice Market Share Analysis: Online market is poised to register the fastest growth rae over the forecast period to 2032
In the evolving landscape of the Rice Market segmented by Distribution Channel, the Online segment is the fastest-growing player, driven by several key factors. Online distribution channels offer consumers the convenience of purchasing rice from the comfort of their homes, eliminating the need for physical store visits. Further, the proliferation of e-commerce platforms and digital marketplaces has expanded the reach of rice products to a broader audience, including consumers in remote areas. Additionally, the COVID-19 pandemic has accelerated the adoption of online shopping habits, as consumers prioritize safety and convenience. As more individuals seek convenient and efficient ways to purchase staple food items like rice, the Online Distribution channel is poised to sustain its rapid growth trajectory in the Rice Market, reshaping the way consumers access and purchase this essential commodity.
Rice Market Segmentation
By Product
Long-grain
Medium-grain
Short-grain
By Distribution Channel
Offline
Online
Countries Analyzed
North America (US, Canada, Mexico)
Europe (Germany, UK, France, Spain, Italy, Russia, Rest of Europe)
Asia Pacific (China, India, Japan, South Korea, Australia, South East Asia, Rest of Asia)
South America (Brazil, Argentina, Rest of South America)
Middle East and Africa (Saudi Arabia, UAE, Rest of Middle East, South Africa, Egypt, Rest of Africa)
Rice Companies Profiled in the Study
Aashirvad International
Adani Wilmar Ltd
Aeroplane Rice Ltd
Gautam General Trading LLC
Kohinoor Foods Ltd
KRBL Ltd
LT Foods
Shriram Food Pvt. Ltd
Sri Sainath Industry Pvt. Ltd
Sridhar Agro Product P Ltd
*- List Not Exhaustive
Chapter 1. TABLE OF CONTENTS
Chapter 2. Introduction to Rice Market
2.1. Market Overview
2.2. Key Statistics and Report Highlights
2.3. Scope of the Comprehensive Study
2.3.1. Market Definition
2.3.2 Countries and Regions Covered
2.3.3 Research Objective
2.3.4 Units, Currency, and Conversions
2.3.5 Industry Value Chain
2.4. Key Market Segments
2.5. Key Companies
2.6. Study Period
Chapter 3. Strategic Analysis Review
3.1. Rice Pricing Analysis and Forecast
3.2. Porter’s Five Forces
3.3. Market Ecosystem
3.4. SWOT Analysis
3.5. Regulatory Scenario
3.3. Effects of Inflation, Russia-Ukraine War, moderating economic growth, and other macroeconomic factors
Chapter 4. Competitive Landscape
4.1. Market Share Analysis
4.1.1. Global Rice Market Share by Company, 2023
4.1.2. Product Offerings of Leading Rice Companies
4.2. Market Entropy
4.2.1. New Product Launches in the Industry
4.2.2. Mergers, Acquisitions, Joint ventures, and Partnerships
4.3. Key Strategies and Best Practices
Chapter 5. Global Market Projections: Best, Reference, and Low Case Scenarios
5.1. Growth Analysis- Case Scenario Definitions
5.2. Low Growth Case Scenario Forecasts
5.3. Reference Growth Case Scenario Forecasts
5.4. High Growth Case Scenario Forecasts
Chapter 6. Market Dynamics
6.1. Rice Market Drivers
6.2. Rice Market Challenges
6.6. Rice Market Opportunities
6.4. Rice Market Trends
Chapter 7. Global Rice Market Outlook Trends
7.1. Global Rice Revenue (USD Million) and CAGR (%) by Type (2021-2032)
7.2. Global Rice Revenue (USD Million) and CAGR (%) by Application (2021-2032)
7.3. Global Rice Revenue (USD Million) and CAGR (%) by Product (2021-2032)
By Product
Long-grain
Medium-grain
Short-grain
By Distribution Channel
Offline
Online
Chapter 8. Global Rice Regional Analysis and Outlook
8.1. Global Rice Revenue (USD Million) By Regions (2021- 2032)
8.2. North America Rice Revenue (USD Million) by Country (2021-2032)
8.2.1. United States Rice Regional Analysis and Outlook
8.2.2. Canada Rice Regional Analysis and Outlook
8.2.3. Mexico Rice Regional Analysis and Outlook
8.3. Europe Rice Revenue (USD Million), by Country (2021-2032)
8.3.1. Germany Rice Regional Analysis and Outlook
8.3.2. France Rice Regional Analysis and Outlook
8.3.3. United Kingdom Rice Regional Analysis and Outlook
8.3.4. Spain Rice Regional Analysis and Outlook
8.3.5. Italy Rice Regional Analysis and Outlook
8.3.6. Russia Rice Regional Analysis and Outlook
8.3.7. Rest of Europe Rice Regional Analysis and Outlook
8.4. Asia Pacific Rice Revenue (USD Million) by Country (2021-2032)
8.4.1. China Rice Regional Analysis and Outlook
8.4.2. Japan Rice Regional Analysis and Outlook
8.4.3. India Rice Regional Analysis and Outlook
8.4.4. South Korea Rice Regional Analysis and Outlook
8.4.5. Australia Rice Regional Analysis and Outlook
8.4.6. South East Asia Rice Regional Analysis and Outlook
8.4.7. Rest of Asia Pacific Rice Regional Analysis and Outlook
8.5. South America Rice Revenue (USD Million), by Country (2021-2032)
8.5.1. Brazil Rice Regional Analysis and Outlook
8.5.2. Argentina Rice Regional Analysis and Outlook
8.5.3. Rest of South America Rice Regional Analysis and Outlook
8.6. Middle East and Africa Rice Revenue (USD Million) by Country (2021-2032)
8.6.1. Middle East Rice Regional Analysis and Outlook
8.6.2. Africa Rice Regional Analysis and Outlook
Chapter 9. North America Rice Analysis and Outlook
9.1. North America Rice Revenue (USD Million) by Segments (2021-2032)
9.1.1. North America Rice Revenue (USD Million) by Type (2021-2032)
9.1.2. North America Rice Revenue (USD Million) by Application (2021-2032)
9.1.3. North America Rice Revenue (USD Million) by Product (2021-2032)
By Product
Long-grain
Medium-grain
Short-grain
By Distribution Channel
Offline
Online
Chapter 10. Europe Rice Analysis and Outlook
10.1. Europe Rice Revenue (USD Million), by Segments (USD Million) (2021-2032)
10.1.1. Europe Rice Revenue (USD Million) by Type (2021-2032)
10.1.2. Europe Rice Revenue (USD Million) by Application (2021-2032)
10.1.3. Europe Rice Revenue (USD Million) by Product (2021-2032)
By Product
Long-grain
Medium-grain
Short-grain
By Distribution Channel
Offline
Online
Chapter 11. Asia Pacific Rice Analysis and Outlook
11.1. Asia Pacific Rice Revenue (USD Million), and Revenue (USD Million) by Segments (2021-2032)
11.1.1. Asia Pacific Rice Revenue (USD Million) by Type (2021-2032)
11.1.2. Asia Pacific Rice Revenue (USD Million) by Application (2021-2032)
11.1.3. Asia Pacific Rice Revenue (USD Million) by Product (2021-2032)
By Product
Long-grain
Medium-grain
Short-grain
By Distribution Channel
Offline
Online
Chapter 12. South America Rice Analysis and Outlook
12.1. South America Rice Revenue (USD Million), by Segments (2021-2032)
12.1.1. South America Rice Revenue (USD Million) by Type (2021-2032)
12.1.2. South America Rice Revenue (USD Million) by Application (2021-2032)
12.1.3. South America Rice Revenue (USD Million) by Product (2021-2032)
By Product
Long-grain
Medium-grain
Short-grain
By Distribution Channel
Offline
Online
Chapter 13. Middle East and Africa Rice Analysis and Outlook
13.1. Middle East and Africa Rice Revenue (USD Million), by Segments (2021-2032)
13.1.1. Middle East and Africa Rice Revenue (USD Million) by Type (2021-2032)
13.1.2. Middle East and Africa Rice Revenue (USD Million) by Application (2021-2032)
13.1.3. Middle East and Africa Rice Revenue (USD Million) by Product (2021-2032)
By Product
Long-grain
Medium-grain
Short-grain
By Distribution Channel
Offline
Online
Chapter 14. Rice Company Profiles
14.1 Business Overview
14.2 Product Profiles
14.3 SWOT Profiles
14.5 Recent Developments
14.6 Financial Profile
List of Companies
Aashirvad International
Adani Wilmar Ltd
Aeroplane Rice Ltd
Gautam General Trading LLC
Kohinoor Foods Ltd
KRBL Ltd
LT Foods
Shriram Food Pvt. Ltd
Sri Sainath Industry Pvt. Ltd
Sridhar Agro Product P Ltd
15. Methodology and Data Sources
15.1 Customization Offerings
15.2 Subscription Services
15.3 Related Reports
15.4 Publisher Expertise
LIST OF TABLES
Table 1 Market Segmentation Analysis
Table 2 Global Rice Market Share of Leading Companies, 2023
Table 3 Product Offerings of Leading Companies
Table 4 Low Growth Scenario Forecasts
Table 5 Reference Case Growth Scenario
Table 6 High Growth Case Scenario
Table 7 Global Rice Revenue (USD Million) And CAGR (%) By Type (2021-2032)
Table 8 Global Rice Revenue (USD Million) And CAGR (%) By Application (2021-2032)
Table 9 Global Rice Revenue (USD Million) And CAGR (%) By Product (2021-2032)
Table 10 Global Rice Market Revenue (USD Million) By Regions (2021-2032)
Table 11 Global Rice Market Share (%) By Regions (2021-2032)
Table 12 North America Rice Revenue (USD Million) By Country (2021-2032)
Table 13 Europe Rice Revenue (USD Million) By Country (2021-2032)
Table 14 Asia Pacific Rice Revenue (USD Million) By Country (2021-2032)
Table 15 South America Rice Revenue (USD Million) By Country (2021-2032)
Table 16 Middle East and Africa Rice Revenue (USD Million) By Region (2021-2032)
Table 17 North America Rice Revenue (USD Million) By Type (2021-2032)
Table 18 North America Rice Revenue (USD Million) By Application (2021-2032)
Table 19 North America Rice Revenue (USD Million) By Product (2021-2032)
Table 20 Europe Rice Revenue (USD Million) By Type (2021-2032)
Table 21 Europe Rice Revenue (USD Million) By Application (2021-2032)
Table 22 Europe Rice Revenue (USD Million) By Product (2021-2032)
Table 23 Asia Pacific Rice Revenue (USD Million) By Type (2021-2032)
Table 24 Asia Pacific Rice Revenue (USD Million) By Application (2021-2032)
Table 25 Asia Pacific Rice Revenue (USD Million) By Product (2021-2032)
Table 26 South America Rice Revenue (USD Million) By Type (2021-2032)
Table 27 South America Rice Revenue (USD Million) By Application (2021-2032)
Table 28 South America Rice Revenue (USD Million) By Product (2021-2032)
Table 29 Middle East and Africa Rice Revenue (USD Million) By Type (2021-2032)
Table 30 Middle East and Africa Rice Revenue (USD Million) By Application (2021-2032)
Table 31 Middle East and Africa Rice Revenue (USD Million) By Product (2021-2032)
LIST OF FIGURES
Figure 1. Market Scope
Figure 2. Pricing Forecasts Per Unit, 2023- 2032
Figure 3. Porter’s Five Forces
Figure 4. Global Rice Market Revenue (USD Million) By Regions (2021-2032)
Figure 5. Global Rice Market Share (%) By Regions (2023)
Figure 6. North America Rice Revenue (USD Million) By Country (2021-2032)
Figure 7. United States Rice Revenue (USD Million) By Country (2021-2032)
Figure 8. Canada Rice Revenue (USD Million) By Country (2021-2032)
Figure 9. Mexico Rice Revenue (USD Million) By Country (2021-2032)
Figure 10. Europe Rice Revenue (USD Million) By Country (2021-2032)
Figure 11. Germany Rice Revenue (USD Million) By Country (2021-2032)
Figure 12. France Rice Revenue (USD Million) By Country (2021-2032)
Figure 13. United Kingdom Rice Revenue (USD Million) By Country (2021-2032)
Figure 14. Spain Rice Revenue (USD Million) By Country (2021-2032)
Figure 15. Italy Rice Revenue (USD Million) By Country (2021-2032)
Figure 16. Russia Rice Revenue (USD Million) By Country (2021-2032)
Figure 17. Rest of Europe Rice Revenue (USD Million) By Country (2021-2032)
Figure 11. Asia Pacific Rice Revenue (USD Million) By Country (2021-2032)
Figure 12. China Rice Revenue (USD Million) By Country (2021-2032)
Figure 13. Japan Rice Revenue (USD Million) By Country (2021-2032)
Figure 14. India Rice Revenue (USD Million) By Country (2021-2032)
Figure 15. South Korea Rice Revenue (USD Million) By Country (2021-2032)
Figure 16. Australia Rice Revenue (USD Million) By Country (2021-2032)
Figure 17. South East Asia Rice Revenue (USD Million) By Country (2021-2032)
Figure 18. South America Rice Revenue (USD Million) By Country (2021-2032)
Figure 19. Brazil Rice Revenue (USD Million) By Country (2021-2032)
Figure 20. Argentina Rice Revenue (USD Million) By Country (2021-2032)
Figure 21. Rest of Asia Pacific Rice Revenue (USD Million) By Country (2021-2032)
Figure 22. Middle East and Africa Rice Revenue (USD Million) By Region (2021-2032)
Figure 23. Saudi Arabia Rice Revenue (USD Million) By Region (2021-2032)
Figure 24. The UAE Rice Revenue (USD Million) By Region (2021-2032)
Figure 25. Rest of Middle East Rice Revenue (USD Million) By Region (2021-2032)
Figure 26. South Africa Rice Revenue (USD Million) By Region (2021-2032)
Figure 27. Africa Rice Revenue (USD Million) By Region (2021-2032)
Figure 28. North America Rice Revenue (USD Million) By Type (2021-2032)
Figure 29. North America Rice Revenue (USD Million) By Application (2021-2032)
Figure 30. North America Rice Revenue (USD Million) By Product (2021-2032)
Figure 31. Europe Rice Revenue (USD Million) By Type (2021-2032)
Figure 32. Europe Rice Revenue (USD Million) By Application (2021-2032)
Figure 33. Europe Rice Revenue (USD Million) By Product (2021-2032)
Figure 34. Asia Pacific Rice Revenue (USD Million) By Type (2021-2032)
Figure 35. Asia Pacific Rice Revenue (USD Million) By Application (2021-2032)
Figure 36. Asia Pacific Rice Revenue (USD Million) By Product (2021-2032)
Figure 37. South America Rice Revenue (USD Million) By Type (2021-2032)
Figure 38. South America Rice Revenue (USD Million) By Application (2021-2032)
Figure 39. South America Rice Revenue (USD Million) By Product (2021-2032)
Figure 40. Middle East and Africa Rice Revenue (USD Million) By Type (2021-2032)
Figure 41. Middle East and Africa Rice Revenue (USD Million) By Application (2021-2032)
Figure 42. Middle East and Africa Rice Revenue (USD Million) By Product (2021-2032)
By Product
Long-grain
Medium-grain
Short-grain
By Distribution Channel
Offline
Online
Countries Analyzed
North America (US, Canada, Mexico)
Europe (Germany, UK, France, Spain, Italy, Russia, Rest of Europe)
Asia Pacific (China, India, Japan, South Korea, Australia, South East Asia, Rest of Asia)
South America (Brazil, Argentina, Rest of South America)
Middle East and Africa (Saudi Arabia, UAE, Rest of Middle East, South Africa, Egypt, Rest of Africa)
