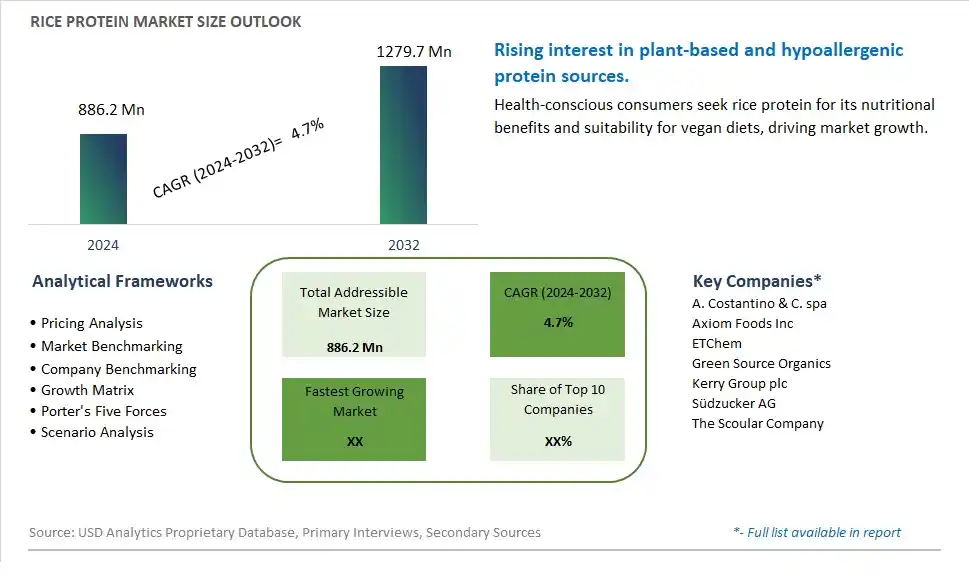
Global Rice Protein Market Size is valued at $886.2 Million in 2024 and is forecast to register a growth rate (CAGR) of 4.7% to reach $1279.7 Million by 2032.
The global Rice Protein Market Comprehensive Study analyzes and forecasts the market size across 6 regions and 24 countries for diverse segments -By Product (Rice Protein Isolates, Rice Protein Concentrates, Others), By Application (Food And Beverages, Pharmaceutical, Cosmetics, Animal Feed)
An Introduction to Rice Protein Market
The rice protein market is experiencing significant traction in 2024, fueled by the rising popularity of plant-based diets and the increasing demand for allergen-free protein sources. Rice protein, derived from brown or white rice, is gaining prominence as a sustainable alternative to animal-based proteins, catering to the growing vegan and vegetarian demographic. Its neutral taste, hypoallergenic nature, and high digestibility make it a preferred choice for consumers seeking protein supplements, sports nutrition products, and meat substitutes. Additionally, the food and beverage industry is incorporating rice protein into a wide array of products, including protein bars, shakes, cereals, and baked goods, to meet the evolving dietary preferences of health-conscious consumers.
Rice Protein Competitive Landscape
The market report analyses the leading companies in the industry including A. Costantino & C. spa, Axiom Foods Inc, ETChem, Green Source Organics, Kerry Group plc, Südzucker AG, The Scoular Company, and Others.
Rice Protein Market Dynamics
Rice Protein Market Trend: Rising Demand for Plant-Based Protein Alternatives
One prominent trend in the rice protein market is the rising demand for plant-based protein alternatives. With growing concerns about sustainability, animal welfare, and health, consumers are increasingly turning towards plant-based diets and seeking alternative protein sources. Rice protein, derived from brown rice, is gaining popularity as a vegan-friendly protein option that is free from common allergens such as soy and dairy. This trend is driving the incorporation of rice protein into a wide range of food and beverage products, including plant-based meat alternatives, protein bars, shakes, and dairy alternatives, as consumers seek nutritious and environmentally sustainable protein sources to support their dietary preferences and lifestyles.
Market Driver: Expansion of the Vegan and Vegetarian Food Markets
A key driver in the rice protein market is the expansion of the vegan and vegetarian food markets. With the growing adoption of plant-based diets for ethical, environmental, and health reasons, there's a rising demand for vegan and vegetarian food products that offer nutritionally balanced alternatives to animal-derived proteins. Rice protein, with its high protein content, amino acid profile, and digestibility, is well-positioned to meet the protein needs of individuals following plant-based diets. This driver fuels market growth as food manufacturers incorporate rice protein into innovative plant-based formulations to create meat analogs, dairy alternatives, baked goods, and functional foods that appeal to vegan, vegetarian, and flexitarian consumers seeking delicious and nutritious protein options.
Market Opportunity: Diversification into Functional Food and Sports Nutrition Segments
An emerging opportunity in the rice protein market is diversification into the functional food and sports nutrition segments. Beyond its use in traditional food and beverage applications, rice protein offers potential opportunities in the functional food and sports nutrition markets, where there's a growing demand for protein-rich products that offer additional health and performance benefits. Rice protein's neutral taste profile and versatile functionality make it suitable for incorporation into a wide range of functional foods such as energy bars, breakfast cereals, snacks, and meal replacements. Additionally, rice protein's fast-digesting properties and high branched-chain amino acid content make it an attractive option for sports nutrition products targeting muscle recovery, endurance, and strength gains. By leveraging its nutritional properties and functional benefits, rice protein manufacturers can explore new product formulations and market segments to expand their customer base and drive growth in the competitive landscape of functional foods and sports nutrition.
Rice Protein Market Share Analysis: Rice Protein Isolates held the dominant market share in 2024
In the Rice Protein market, the "Rice Protein Isolates" segment is the largest, commanding significant prominence for several compelling reasons. Rice protein isolates are highly refined and purified forms of rice protein, offering exceptional purity and concentration of protein per serving. This makes them a preferred choice among consumers and manufacturers seeking plant-based protein alternatives with high nutritional value. Further, rice protein isolates are allergen-free, gluten-free, and easily digestible, making them suitable for individuals with dietary restrictions or sensitivities. Additionally, rice protein isolates exhibit excellent functional properties, including emulsifying, foaming, and gelling capabilities, enhancing their versatility in food and beverage applications. With their superior nutritional profile, clean-label appeal, and diverse applications across various industries, the Rice Protein Isolates segment maintains its dominance in the Rice Protein market, shaping the trajectory of plant-based protein consumption and product innovation.
Rice Protein Market Share Analysis: Food and Beverages market is poised to register the fastest growth rae over the forecast period to 2032
Among the segments delineated in the Rice Protein market, the "Food and Beverages" segment is the fastest-growing, propelled by several key factors. Rice protein's versatility and nutritional benefits make it an increasingly popular choice among consumers seeking plant-based protein alternatives in food and beverage products. As the demand for plant-based diets and clean-label products rises, manufacturers are incorporating rice protein into a wide range of food and beverage formulations, including plant-based meat substitutes, dairy alternatives, snacks, and beverages. Further, rice protein's neutral taste and excellent solubility make it easy to incorporate into various applications without compromising flavor or texture. Additionally, the rising consumer awareness of the health benefits associated with rice protein, such as muscle recovery, weight management, and sustainable sourcing, further drives its adoption in the food and beverage industry. With its expanding applications and consumer appeal, the Food and Beverages segment is poised to sustain its rapid growth, reshaping the landscape of the Rice Protein market and driving innovation in plant-based protein products.
Rice Protein Market Segmentation
By Product
Rice Protein Isolates
Rice Protein Concentrates
Others
By Application
Food And Beverages
Pharmaceutical
Cosmetics
Animal Feed
Countries Analyzed
North America (US, Canada, Mexico)
Europe (Germany, UK, France, Spain, Italy, Russia, Rest of Europe)
Asia Pacific (China, India, Japan, South Korea, Australia, South East Asia, Rest of Asia)
South America (Brazil, Argentina, Rest of South America)
Middle East and Africa (Saudi Arabia, UAE, Rest of Middle East, South Africa, Egypt, Rest of Africa)
Rice Protein Companies Profiled in the Study
A. Costantino & C. spa
Axiom Foods Inc
ETChem
Green Source Organics
Kerry Group plc
Südzucker AG
The Scoular Company
*- List Not Exhaustive
Chapter 1. TABLE OF CONTENTS
Chapter 2. Introduction to Rice Protein Market
2.1. Market Overview
2.2. Key Statistics and Report Highlights
2.3. Scope of the Comprehensive Study
2.3.1. Market Definition
2.3.2 Countries and Regions Covered
2.3.3 Research Objective
2.3.4 Units, Currency, and Conversions
2.3.5 Industry Value Chain
2.4. Key Market Segments
2.5. Key Companies
2.6. Study Period
Chapter 3. Strategic Analysis Review
3.1. Rice Protein Pricing Analysis and Forecast
3.2. Porter’s Five Forces
3.3. Market Ecosystem
3.4. SWOT Analysis
3.5. Regulatory Scenario
3.3. Effects of Inflation, Russia-Ukraine War, moderating economic growth, and other macroeconomic factors
Chapter 4. Competitive Landscape
4.1. Market Share Analysis
4.1.1. Global Rice Protein Market Share by Company, 2023
4.1.2. Product Offerings of Leading Rice Protein Companies
4.2. Market Entropy
4.2.1. New Product Launches in the Industry
4.2.2. Mergers, Acquisitions, Joint ventures, and Partnerships
4.3. Key Strategies and Best Practices
Chapter 5. Global Market Projections: Best, Reference, and Low Case Scenarios
5.1. Growth Analysis- Case Scenario Definitions
5.2. Low Growth Case Scenario Forecasts
5.3. Reference Growth Case Scenario Forecasts
5.4. High Growth Case Scenario Forecasts
Chapter 6. Market Dynamics
6.1. Rice Protein Market Drivers
6.2. Rice Protein Market Challenges
6.6. Rice Protein Market Opportunities
6.4. Rice Protein Market Trends
Chapter 7. Global Rice Protein Market Outlook Trends
7.1. Global Rice Protein Revenue (USD Million) and CAGR (%) by Type (2021-2032)
7.2. Global Rice Protein Revenue (USD Million) and CAGR (%) by Application (2021-2032)
7.3. Global Rice Protein Revenue (USD Million) and CAGR (%) by Product (2021-2032)
By Product
Rice Protein Isolates
Rice Protein Concentrates
Others
By Application
Food And Beverages
Pharmaceutical
Cosmetics
Animal Feed
Chapter 8. Global Rice Protein Regional Analysis and Outlook
8.1. Global Rice Protein Revenue (USD Million) By Regions (2021- 2032)
8.2. North America Rice Protein Revenue (USD Million) by Country (2021-2032)
8.2.1. United States Rice Protein Regional Analysis and Outlook
8.2.2. Canada Rice Protein Regional Analysis and Outlook
8.2.3. Mexico Rice Protein Regional Analysis and Outlook
8.3. Europe Rice Protein Revenue (USD Million), by Country (2021-2032)
8.3.1. Germany Rice Protein Regional Analysis and Outlook
8.3.2. France Rice Protein Regional Analysis and Outlook
8.3.3. United Kingdom Rice Protein Regional Analysis and Outlook
8.3.4. Spain Rice Protein Regional Analysis and Outlook
8.3.5. Italy Rice Protein Regional Analysis and Outlook
8.3.6. Russia Rice Protein Regional Analysis and Outlook
8.3.7. Rest of Europe Rice Protein Regional Analysis and Outlook
8.4. Asia Pacific Rice Protein Revenue (USD Million) by Country (2021-2032)
8.4.1. China Rice Protein Regional Analysis and Outlook
8.4.2. Japan Rice Protein Regional Analysis and Outlook
8.4.3. India Rice Protein Regional Analysis and Outlook
8.4.4. South Korea Rice Protein Regional Analysis and Outlook
8.4.5. Australia Rice Protein Regional Analysis and Outlook
8.4.6. South East Asia Rice Protein Regional Analysis and Outlook
8.4.7. Rest of Asia Pacific Rice Protein Regional Analysis and Outlook
8.5. South America Rice Protein Revenue (USD Million), by Country (2021-2032)
8.5.1. Brazil Rice Protein Regional Analysis and Outlook
8.5.2. Argentina Rice Protein Regional Analysis and Outlook
8.5.3. Rest of South America Rice Protein Regional Analysis and Outlook
8.6. Middle East and Africa Rice Protein Revenue (USD Million) by Country (2021-2032)
8.6.1. Middle East Rice Protein Regional Analysis and Outlook
8.6.2. Africa Rice Protein Regional Analysis and Outlook
Chapter 9. North America Rice Protein Analysis and Outlook
9.1. North America Rice Protein Revenue (USD Million) by Segments (2021-2032)
9.1.1. North America Rice Protein Revenue (USD Million) by Type (2021-2032)
9.1.2. North America Rice Protein Revenue (USD Million) by Application (2021-2032)
9.1.3. North America Rice Protein Revenue (USD Million) by Product (2021-2032)
By Product
Rice Protein Isolates
Rice Protein Concentrates
Others
By Application
Food And Beverages
Pharmaceutical
Cosmetics
Animal Feed
Chapter 10. Europe Rice Protein Analysis and Outlook
10.1. Europe Rice Protein Revenue (USD Million), by Segments (USD Million) (2021-2032)
10.1.1. Europe Rice Protein Revenue (USD Million) by Type (2021-2032)
10.1.2. Europe Rice Protein Revenue (USD Million) by Application (2021-2032)
10.1.3. Europe Rice Protein Revenue (USD Million) by Product (2021-2032)
By Product
Rice Protein Isolates
Rice Protein Concentrates
Others
By Application
Food And Beverages
Pharmaceutical
Cosmetics
Animal Feed
Chapter 11. Asia Pacific Rice Protein Analysis and Outlook
11.1. Asia Pacific Rice Protein Revenue (USD Million), and Revenue (USD Million) by Segments (2021-2032)
11.1.1. Asia Pacific Rice Protein Revenue (USD Million) by Type (2021-2032)
11.1.2. Asia Pacific Rice Protein Revenue (USD Million) by Application (2021-2032)
11.1.3. Asia Pacific Rice Protein Revenue (USD Million) by Product (2021-2032)
By Product
Rice Protein Isolates
Rice Protein Concentrates
Others
By Application
Food And Beverages
Pharmaceutical
Cosmetics
Animal Feed
Chapter 12. South America Rice Protein Analysis and Outlook
12.1. South America Rice Protein Revenue (USD Million), by Segments (2021-2032)
12.1.1. South America Rice Protein Revenue (USD Million) by Type (2021-2032)
12.1.2. South America Rice Protein Revenue (USD Million) by Application (2021-2032)
12.1.3. South America Rice Protein Revenue (USD Million) by Product (2021-2032)
By Product
Rice Protein Isolates
Rice Protein Concentrates
Others
By Application
Food And Beverages
Pharmaceutical
Cosmetics
Animal Feed
Chapter 13. Middle East and Africa Rice Protein Analysis and Outlook
13.1. Middle East and Africa Rice Protein Revenue (USD Million), by Segments (2021-2032)
13.1.1. Middle East and Africa Rice Protein Revenue (USD Million) by Type (2021-2032)
13.1.2. Middle East and Africa Rice Protein Revenue (USD Million) by Application (2021-2032)
13.1.3. Middle East and Africa Rice Protein Revenue (USD Million) by Product (2021-2032)
By Product
Rice Protein Isolates
Rice Protein Concentrates
Others
By Application
Food And Beverages
Pharmaceutical
Cosmetics
Animal Feed
Chapter 14. Rice Protein Company Profiles
14.1 Business Overview
14.2 Product Profiles
14.3 SWOT Profiles
14.5 Recent Developments
14.6 Financial Profile
List of Companies
A. Costantino & C. spa
Axiom Foods Inc
ETChem
Green Source Organics
Kerry Group plc
Südzucker AG
The Scoular Company
15. Methodology and Data Sources
15.1 Customization Offerings
15.2 Subscription Services
15.3 Related Reports
15.4 Publisher Expertise
LIST OF TABLES
Table 1 Market Segmentation Analysis
Table 2 Global Rice Protein Market Share of Leading Companies, 2023
Table 3 Product Offerings of Leading Companies
Table 4 Low Growth Scenario Forecasts
Table 5 Reference Case Growth Scenario
Table 6 High Growth Case Scenario
Table 7 Global Rice Protein Revenue (USD Million) And CAGR (%) By Type (2021-2032)
Table 8 Global Rice Protein Revenue (USD Million) And CAGR (%) By Application (2021-2032)
Table 9 Global Rice Protein Revenue (USD Million) And CAGR (%) By Product (2021-2032)
Table 10 Global Rice Protein Market Revenue (USD Million) By Regions (2021-2032)
Table 11 Global Rice Protein Market Share (%) By Regions (2021-2032)
Table 12 North America Rice Protein Revenue (USD Million) By Country (2021-2032)
Table 13 Europe Rice Protein Revenue (USD Million) By Country (2021-2032)
Table 14 Asia Pacific Rice Protein Revenue (USD Million) By Country (2021-2032)
Table 15 South America Rice Protein Revenue (USD Million) By Country (2021-2032)
Table 16 Middle East and Africa Rice Protein Revenue (USD Million) By Region (2021-2032)
Table 17 North America Rice Protein Revenue (USD Million) By Type (2021-2032)
Table 18 North America Rice Protein Revenue (USD Million) By Application (2021-2032)
Table 19 North America Rice Protein Revenue (USD Million) By Product (2021-2032)
Table 20 Europe Rice Protein Revenue (USD Million) By Type (2021-2032)
Table 21 Europe Rice Protein Revenue (USD Million) By Application (2021-2032)
Table 22 Europe Rice Protein Revenue (USD Million) By Product (2021-2032)
Table 23 Asia Pacific Rice Protein Revenue (USD Million) By Type (2021-2032)
Table 24 Asia Pacific Rice Protein Revenue (USD Million) By Application (2021-2032)
Table 25 Asia Pacific Rice Protein Revenue (USD Million) By Product (2021-2032)
Table 26 South America Rice Protein Revenue (USD Million) By Type (2021-2032)
Table 27 South America Rice Protein Revenue (USD Million) By Application (2021-2032)
Table 28 South America Rice Protein Revenue (USD Million) By Product (2021-2032)
Table 29 Middle East and Africa Rice Protein Revenue (USD Million) By Type (2021-2032)
Table 30 Middle East and Africa Rice Protein Revenue (USD Million) By Application (2021-2032)
Table 31 Middle East and Africa Rice Protein Revenue (USD Million) By Product (2021-2032)
LIST OF FIGURES
Figure 1. Market Scope
Figure 2. Pricing Forecasts Per Unit, 2023- 2032
Figure 3. Porter’s Five Forces
Figure 4. Global Rice Protein Market Revenue (USD Million) By Regions (2021-2032)
Figure 5. Global Rice Protein Market Share (%) By Regions (2023)
Figure 6. North America Rice Protein Revenue (USD Million) By Country (2021-2032)
Figure 7. United States Rice Protein Revenue (USD Million) By Country (2021-2032)
Figure 8. Canada Rice Protein Revenue (USD Million) By Country (2021-2032)
Figure 9. Mexico Rice Protein Revenue (USD Million) By Country (2021-2032)
Figure 10. Europe Rice Protein Revenue (USD Million) By Country (2021-2032)
Figure 11. Germany Rice Protein Revenue (USD Million) By Country (2021-2032)
Figure 12. France Rice Protein Revenue (USD Million) By Country (2021-2032)
Figure 13. United Kingdom Rice Protein Revenue (USD Million) By Country (2021-2032)
Figure 14. Spain Rice Protein Revenue (USD Million) By Country (2021-2032)
Figure 15. Italy Rice Protein Revenue (USD Million) By Country (2021-2032)
Figure 16. Russia Rice Protein Revenue (USD Million) By Country (2021-2032)
Figure 17. Rest of Europe Rice Protein Revenue (USD Million) By Country (2021-2032)
Figure 11. Asia Pacific Rice Protein Revenue (USD Million) By Country (2021-2032)
Figure 12. China Rice Protein Revenue (USD Million) By Country (2021-2032)
Figure 13. Japan Rice Protein Revenue (USD Million) By Country (2021-2032)
Figure 14. India Rice Protein Revenue (USD Million) By Country (2021-2032)
Figure 15. South Korea Rice Protein Revenue (USD Million) By Country (2021-2032)
Figure 16. Australia Rice Protein Revenue (USD Million) By Country (2021-2032)
Figure 17. South East Asia Rice Protein Revenue (USD Million) By Country (2021-2032)
Figure 18. South America Rice Protein Revenue (USD Million) By Country (2021-2032)
Figure 19. Brazil Rice Protein Revenue (USD Million) By Country (2021-2032)
Figure 20. Argentina Rice Protein Revenue (USD Million) By Country (2021-2032)
Figure 21. Rest of Asia Pacific Rice Protein Revenue (USD Million) By Country (2021-2032)
Figure 22. Middle East and Africa Rice Protein Revenue (USD Million) By Region (2021-2032)
Figure 23. Saudi Arabia Rice Protein Revenue (USD Million) By Region (2021-2032)
Figure 24. The UAE Rice Protein Revenue (USD Million) By Region (2021-2032)
Figure 25. Rest of Middle East Rice Protein Revenue (USD Million) By Region (2021-2032)
Figure 26. South Africa Rice Protein Revenue (USD Million) By Region (2021-2032)
Figure 27. Africa Rice Protein Revenue (USD Million) By Region (2021-2032)
Figure 28. North America Rice Protein Revenue (USD Million) By Type (2021-2032)
Figure 29. North America Rice Protein Revenue (USD Million) By Application (2021-2032)
Figure 30. North America Rice Protein Revenue (USD Million) By Product (2021-2032)
Figure 31. Europe Rice Protein Revenue (USD Million) By Type (2021-2032)
Figure 32. Europe Rice Protein Revenue (USD Million) By Application (2021-2032)
Figure 33. Europe Rice Protein Revenue (USD Million) By Product (2021-2032)
Figure 34. Asia Pacific Rice Protein Revenue (USD Million) By Type (2021-2032)
Figure 35. Asia Pacific Rice Protein Revenue (USD Million) By Application (2021-2032)
Figure 36. Asia Pacific Rice Protein Revenue (USD Million) By Product (2021-2032)
Figure 37. South America Rice Protein Revenue (USD Million) By Type (2021-2032)
Figure 38. South America Rice Protein Revenue (USD Million) By Application (2021-2032)
Figure 39. South America Rice Protein Revenue (USD Million) By Product (2021-2032)
Figure 40. Middle East and Africa Rice Protein Revenue (USD Million) By Type (2021-2032)
Figure 41. Middle East and Africa Rice Protein Revenue (USD Million) By Application (2021-2032)
Figure 42. Middle East and Africa Rice Protein Revenue (USD Million) By Product (2021-2032)
By Product
Rice Protein Isolates
Rice Protein Concentrates
Others
By Application
Food And Beverages
Pharmaceutical
Cosmetics
Animal Feed
Countries Analyzed
North America (US, Canada, Mexico)
Europe (Germany, UK, France, Spain, Italy, Russia, Rest of Europe)
Asia Pacific (China, India, Japan, South Korea, Australia, South East Asia, Rest of Asia)
South America (Brazil, Argentina, Rest of South America)
Middle East and Africa (Saudi Arabia, UAE, Rest of Middle East, South Africa, Egypt, Rest of Africa)
