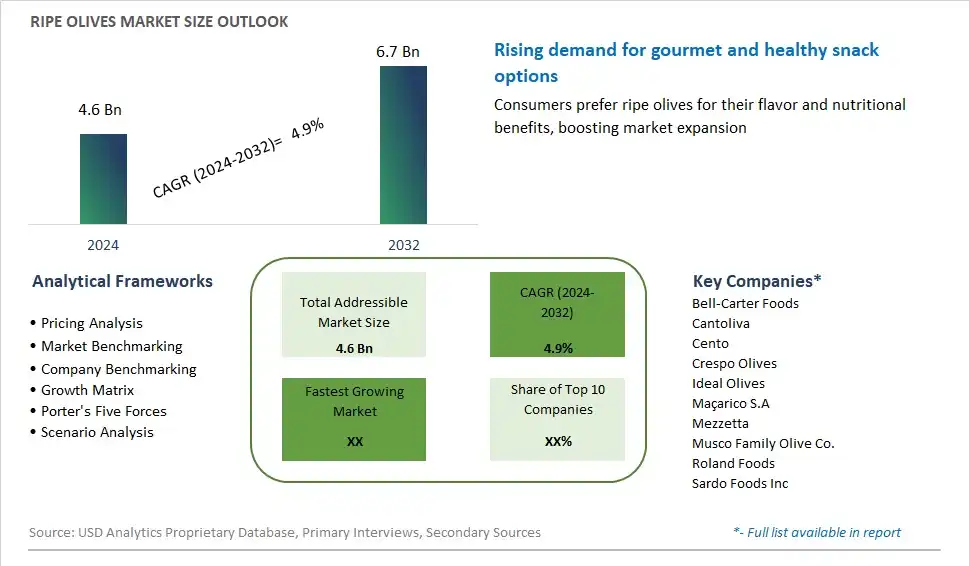
Global Ripe Olives Market Size is valued at $4.6 Billion in 2024 and is forecast to register a growth rate (CAGR) of 4.9% to reach $6.7 Billion by 2032.
The global Ripe Olives Market Comprehensive Study analyzes and forecasts the market size across 6 regions and 24 countries for diverse segments -By Product (Sliced Olives, Pitted Olives, Whole Olives), By Distribution Channel (Online, Offline)
An Introduction to Ripe Olives Market
In 2024, the ripe olives market is thriving, fueled by growing consumer appreciation for their distinct flavor, versatility, and nutritional benefits. Ripe olives, harvested at full maturity and cured to remove bitterness, are enjoyed in various culinary applications, including salads, sandwiches, pizzas, and appetizers. With increasing globalization and culinary diversity, ripe olives are becoming a staple ingredient in international cuisines, appealing to consumers seeking authentic and Mediterranean-inspired flavors. Moreover, the health benefits of olives, including their high monounsaturated fat content, antioxidants, and anti-inflammatory properties, contribute to their popularity as a wholesome and indulgent snack option. As consumers prioritize health-conscious eating habits and premium food experiences, the ripe olives market is poised for continued growth, supported by innovative product offerings, sustainable farming practices, and strategic marketing initiatives emphasizing olives' culinary and nutritional value.
Ripe Olives Competitive Landscape
The market report analyses the leading companies in the industry including Bell-Carter Foods, Cantoliva, Cento, Crespo Olives, Ideal Olives, Maçarico S.A, Mezzetta, Musco Family Olive Co., Roland Foods, Sardo Foods Inc, and Others.
Ripe Olives Market Dynamics
Ripe Olives Market Trend: Increasing Consumer Preference for Mediterranean Diet
Ripe Olives are experiencing a significant trend driven by the increasing consumer preference for the Mediterranean diet. As awareness of the health benefits associated with Mediterranean cuisine grows, there is a rising demand for olives, particularly ripe olives, known for their rich flavor and versatility in culinary applications. This trend is fueled by consumers' interest in incorporating more plant-based foods, such as olives, into their diets to promote heart health, weight management, and overall well-being. As a staple ingredient in Mediterranean dishes like salads, pasta, and tapenades, ripe olives are gaining popularity among health-conscious consumers seeking flavorful and nutritious food options.
Market Driver: Growth of Ethnic and Specialty Food Markets
The market for Ripe Olives is primarily driven by the growth of ethnic and specialty food markets, both domestically and internationally. Ripe olives are integral to Mediterranean and Middle Eastern cuisines, where they are prized for their distinctive taste and texture. With the increasing multiculturalism of society and the globalization of food preferences, there is a growing demand for ethnic and specialty foods, including ripe olives, in mainstream grocery stores, specialty food shops, and online platforms. This driver is reinforced by the expanding consumer base of adventurous eaters and food enthusiasts seeking authentic and diverse culinary experiences, driving the demand for ripe olives and other ethnic ingredients.
Market Opportunity: Diversification of Product Offerings and Flavors
The market for Ripe Olives presents a significant opportunity for companies to diversify their product offerings and flavors to meet diverse consumer preferences and market demands. Companies can innovate by introducing new varieties of ripe olives, such as Kalamata, Castelvetrano, and Gaeta, each offering unique flavor profiles and culinary applications. Additionally, there are opportunities to develop flavored and seasoned ripe olives infused with herbs, spices, and marinades to appeal to adventurous consumers seeking innovative taste experiences. By expanding their product portfolios and catering to evolving consumer tastes, companies can capture market share and drive growth in the competitive ripe olive market.
Ripe Olives Market Share Analysis: Whole Olives held the dominant market share in 2024
In the Ripe Olives market, the "Whole Olives" segment is the largest, commanding significant prominence for several compelling reasons. Whole olives represent the traditional and most versatile form of olive consumption, appealing to a wide range of consumers globally. Their intact form preserves the natural flavor, texture, and aroma of olives, making them suitable for various culinary applications, including salads, pizzas, and antipasto platters. Further, whole olives are preferred by consumers who value authenticity and enjoy the sensory experience of pitting olives themselves. Additionally, whole olives are favored by manufacturers for their ease of handling and processing, enabling efficient production and packaging. With their enduring popularity and widespread usage in culinary traditions worldwide, the Whole Olives segment maintains its dominance in the Ripe Olives market, shaping the landscape of olive consumption and product innovation.
Ripe Olives Market Share Analysis: Online market is poised to register the fastest growth rae over the forecast period to 2032
Among the segments delineated in the Ripe Olives market, the "Online" distribution channel is the fastest-growing, driven by several key factors. The proliferation of e-commerce platforms and the increasing trend towards online shopping have revolutionized the way consumers purchase food products, including ripe olives. Online channels offer unparalleled convenience, accessibility, and a wide selection of olive varieties, catering to diverse consumer preferences and culinary needs. Further, the COVID-19 pandemic has accelerated the shift towards online shopping as consumers prioritize safety and contactless purchasing options. Additionally, online platforms provide a platform for small-scale olive producers and specialty brands to reach a global audience, expanding market reach and driving sales growth. With continuous advancements in digital marketing strategies and logistics infrastructure, the Online distribution channel is poised to sustain its rapid growth trajectory, reshaping the landscape of the Ripe Olives market towards digitalization and consumer convenience.
Ripe Olives Market Segmentation
By Product
Sliced Olives
Pitted Olives
Whole Olives
By Distribution Channel
Online
Offline
Countries Analyzed
North America (US, Canada, Mexico)
Europe (Germany, UK, France, Spain, Italy, Russia, Rest of Europe)
Asia Pacific (China, India, Japan, South Korea, Australia, South East Asia, Rest of Asia)
South America (Brazil, Argentina, Rest of South America)
Middle East and Africa (Saudi Arabia, UAE, Rest of Middle East, South Africa, Egypt, Rest of Africa)
Ripe Olives Companies Profiled in the Study
Bell-Carter Foods
Cantoliva
Cento
Crespo Olives
Ideal Olives
Maçarico S.A
Mezzetta
Musco Family Olive Co.
Roland Foods
Sardo Foods Inc
*- List Not Exhaustive
Chapter 1. TABLE OF CONTENTS
Chapter 2. Introduction to Ripe Olives Market
2.1. Market Overview
2.2. Key Statistics and Report Highlights
2.3. Scope of the Comprehensive Study
2.3.1. Market Definition
2.3.2 Countries and Regions Covered
2.3.3 Research Objective
2.3.4 Units, Currency, and Conversions
2.3.5 Industry Value Chain
2.4. Key Market Segments
2.5. Key Companies
2.6. Study Period
Chapter 3. Strategic Analysis Review
3.1. Ripe Olives Pricing Analysis and Forecast
3.2. Porter’s Five Forces
3.3. Market Ecosystem
3.4. SWOT Analysis
3.5. Regulatory Scenario
3.3. Effects of Inflation, Russia-Ukraine War, moderating economic growth, and other macroeconomic factors
Chapter 4. Competitive Landscape
4.1. Market Share Analysis
4.1.1. Global Ripe Olives Market Share by Company, 2023
4.1.2. Product Offerings of Leading Ripe Olives Companies
4.2. Market Entropy
4.2.1. New Product Launches in the Industry
4.2.2. Mergers, Acquisitions, Joint ventures, and Partnerships
4.3. Key Strategies and Best Practices
Chapter 5. Global Market Projections: Best, Reference, and Low Case Scenarios
5.1. Growth Analysis- Case Scenario Definitions
5.2. Low Growth Case Scenario Forecasts
5.3. Reference Growth Case Scenario Forecasts
5.4. High Growth Case Scenario Forecasts
Chapter 6. Market Dynamics
6.1. Ripe Olives Market Drivers
6.2. Ripe Olives Market Challenges
6.6. Ripe Olives Market Opportunities
6.4. Ripe Olives Market Trends
Chapter 7. Global Ripe Olives Market Outlook Trends
7.1. Global Ripe Olives Revenue (USD Million) and CAGR (%) by Type (2021-2032)
7.2. Global Ripe Olives Revenue (USD Million) and CAGR (%) by Application (2021-2032)
7.3. Global Ripe Olives Revenue (USD Million) and CAGR (%) by Product (2021-2032)
By Product
Sliced Olives
Pitted Olives
Whole Olives
By Distribution Channel
Online
Offline
Chapter 8. Global Ripe Olives Regional Analysis and Outlook
8.1. Global Ripe Olives Revenue (USD Million) By Regions (2021- 2032)
8.2. North America Ripe Olives Revenue (USD Million) by Country (2021-2032)
8.2.1. United States Ripe Olives Regional Analysis and Outlook
8.2.2. Canada Ripe Olives Regional Analysis and Outlook
8.2.3. Mexico Ripe Olives Regional Analysis and Outlook
8.3. Europe Ripe Olives Revenue (USD Million), by Country (2021-2032)
8.3.1. Germany Ripe Olives Regional Analysis and Outlook
8.3.2. France Ripe Olives Regional Analysis and Outlook
8.3.3. United Kingdom Ripe Olives Regional Analysis and Outlook
8.3.4. Spain Ripe Olives Regional Analysis and Outlook
8.3.5. Italy Ripe Olives Regional Analysis and Outlook
8.3.6. Russia Ripe Olives Regional Analysis and Outlook
8.3.7. Rest of Europe Ripe Olives Regional Analysis and Outlook
8.4. Asia Pacific Ripe Olives Revenue (USD Million) by Country (2021-2032)
8.4.1. China Ripe Olives Regional Analysis and Outlook
8.4.2. Japan Ripe Olives Regional Analysis and Outlook
8.4.3. India Ripe Olives Regional Analysis and Outlook
8.4.4. South Korea Ripe Olives Regional Analysis and Outlook
8.4.5. Australia Ripe Olives Regional Analysis and Outlook
8.4.6. South East Asia Ripe Olives Regional Analysis and Outlook
8.4.7. Rest of Asia Pacific Ripe Olives Regional Analysis and Outlook
8.5. South America Ripe Olives Revenue (USD Million), by Country (2021-2032)
8.5.1. Brazil Ripe Olives Regional Analysis and Outlook
8.5.2. Argentina Ripe Olives Regional Analysis and Outlook
8.5.3. Rest of South America Ripe Olives Regional Analysis and Outlook
8.6. Middle East and Africa Ripe Olives Revenue (USD Million) by Country (2021-2032)
8.6.1. Middle East Ripe Olives Regional Analysis and Outlook
8.6.2. Africa Ripe Olives Regional Analysis and Outlook
Chapter 9. North America Ripe Olives Analysis and Outlook
9.1. North America Ripe Olives Revenue (USD Million) by Segments (2021-2032)
9.1.1. North America Ripe Olives Revenue (USD Million) by Type (2021-2032)
9.1.2. North America Ripe Olives Revenue (USD Million) by Application (2021-2032)
9.1.3. North America Ripe Olives Revenue (USD Million) by Product (2021-2032)
By Product
Sliced Olives
Pitted Olives
Whole Olives
By Distribution Channel
Online
Offline
Chapter 10. Europe Ripe Olives Analysis and Outlook
10.1. Europe Ripe Olives Revenue (USD Million), by Segments (USD Million) (2021-2032)
10.1.1. Europe Ripe Olives Revenue (USD Million) by Type (2021-2032)
10.1.2. Europe Ripe Olives Revenue (USD Million) by Application (2021-2032)
10.1.3. Europe Ripe Olives Revenue (USD Million) by Product (2021-2032)
By Product
Sliced Olives
Pitted Olives
Whole Olives
By Distribution Channel
Online
Offline
Chapter 11. Asia Pacific Ripe Olives Analysis and Outlook
11.1. Asia Pacific Ripe Olives Revenue (USD Million), and Revenue (USD Million) by Segments (2021-2032)
11.1.1. Asia Pacific Ripe Olives Revenue (USD Million) by Type (2021-2032)
11.1.2. Asia Pacific Ripe Olives Revenue (USD Million) by Application (2021-2032)
11.1.3. Asia Pacific Ripe Olives Revenue (USD Million) by Product (2021-2032)
By Product
Sliced Olives
Pitted Olives
Whole Olives
By Distribution Channel
Online
Offline
Chapter 12. South America Ripe Olives Analysis and Outlook
12.1. South America Ripe Olives Revenue (USD Million), by Segments (2021-2032)
12.1.1. South America Ripe Olives Revenue (USD Million) by Type (2021-2032)
12.1.2. South America Ripe Olives Revenue (USD Million) by Application (2021-2032)
12.1.3. South America Ripe Olives Revenue (USD Million) by Product (2021-2032)
By Product
Sliced Olives
Pitted Olives
Whole Olives
By Distribution Channel
Online
Offline
Chapter 13. Middle East and Africa Ripe Olives Analysis and Outlook
13.1. Middle East and Africa Ripe Olives Revenue (USD Million), by Segments (2021-2032)
13.1.1. Middle East and Africa Ripe Olives Revenue (USD Million) by Type (2021-2032)
13.1.2. Middle East and Africa Ripe Olives Revenue (USD Million) by Application (2021-2032)
13.1.3. Middle East and Africa Ripe Olives Revenue (USD Million) by Product (2021-2032)
By Product
Sliced Olives
Pitted Olives
Whole Olives
By Distribution Channel
Online
Offline
Chapter 14. Ripe Olives Company Profiles
14.1 Business Overview
14.2 Product Profiles
14.3 SWOT Profiles
14.5 Recent Developments
14.6 Financial Profile
List of Companies
Bell-Carter Foods
Cantoliva
Cento
Crespo Olives
Ideal Olives
Maçarico S.A
Mezzetta
Musco Family Olive Co.
Roland Foods
Sardo Foods Inc
15. Methodology and Data Sources
15.1 Customization Offerings
15.2 Subscription Services
15.3 Related Reports
15.4 Publisher Expertise
LIST OF TABLES
Table 1 Market Segmentation Analysis
Table 2 Global Ripe Olives Market Share of Leading Companies, 2023
Table 3 Product Offerings of Leading Companies
Table 4 Low Growth Scenario Forecasts
Table 5 Reference Case Growth Scenario
Table 6 High Growth Case Scenario
Table 7 Global Ripe Olives Revenue (USD Million) And CAGR (%) By Type (2021-2032)
Table 8 Global Ripe Olives Revenue (USD Million) And CAGR (%) By Application (2021-2032)
Table 9 Global Ripe Olives Revenue (USD Million) And CAGR (%) By Product (2021-2032)
Table 10 Global Ripe Olives Market Revenue (USD Million) By Regions (2021-2032)
Table 11 Global Ripe Olives Market Share (%) By Regions (2021-2032)
Table 12 North America Ripe Olives Revenue (USD Million) By Country (2021-2032)
Table 13 Europe Ripe Olives Revenue (USD Million) By Country (2021-2032)
Table 14 Asia Pacific Ripe Olives Revenue (USD Million) By Country (2021-2032)
Table 15 South America Ripe Olives Revenue (USD Million) By Country (2021-2032)
Table 16 Middle East and Africa Ripe Olives Revenue (USD Million) By Region (2021-2032)
Table 17 North America Ripe Olives Revenue (USD Million) By Type (2021-2032)
Table 18 North America Ripe Olives Revenue (USD Million) By Application (2021-2032)
Table 19 North America Ripe Olives Revenue (USD Million) By Product (2021-2032)
Table 20 Europe Ripe Olives Revenue (USD Million) By Type (2021-2032)
Table 21 Europe Ripe Olives Revenue (USD Million) By Application (2021-2032)
Table 22 Europe Ripe Olives Revenue (USD Million) By Product (2021-2032)
Table 23 Asia Pacific Ripe Olives Revenue (USD Million) By Type (2021-2032)
Table 24 Asia Pacific Ripe Olives Revenue (USD Million) By Application (2021-2032)
Table 25 Asia Pacific Ripe Olives Revenue (USD Million) By Product (2021-2032)
Table 26 South America Ripe Olives Revenue (USD Million) By Type (2021-2032)
Table 27 South America Ripe Olives Revenue (USD Million) By Application (2021-2032)
Table 28 South America Ripe Olives Revenue (USD Million) By Product (2021-2032)
Table 29 Middle East and Africa Ripe Olives Revenue (USD Million) By Type (2021-2032)
Table 30 Middle East and Africa Ripe Olives Revenue (USD Million) By Application (2021-2032)
Table 31 Middle East and Africa Ripe Olives Revenue (USD Million) By Product (2021-2032)
LIST OF FIGURES
Figure 1. Market Scope
Figure 2. Pricing Forecasts Per Unit, 2023- 2032
Figure 3. Porter’s Five Forces
Figure 4. Global Ripe Olives Market Revenue (USD Million) By Regions (2021-2032)
Figure 5. Global Ripe Olives Market Share (%) By Regions (2023)
Figure 6. North America Ripe Olives Revenue (USD Million) By Country (2021-2032)
Figure 7. United States Ripe Olives Revenue (USD Million) By Country (2021-2032)
Figure 8. Canada Ripe Olives Revenue (USD Million) By Country (2021-2032)
Figure 9. Mexico Ripe Olives Revenue (USD Million) By Country (2021-2032)
Figure 10. Europe Ripe Olives Revenue (USD Million) By Country (2021-2032)
Figure 11. Germany Ripe Olives Revenue (USD Million) By Country (2021-2032)
Figure 12. France Ripe Olives Revenue (USD Million) By Country (2021-2032)
Figure 13. United Kingdom Ripe Olives Revenue (USD Million) By Country (2021-2032)
Figure 14. Spain Ripe Olives Revenue (USD Million) By Country (2021-2032)
Figure 15. Italy Ripe Olives Revenue (USD Million) By Country (2021-2032)
Figure 16. Russia Ripe Olives Revenue (USD Million) By Country (2021-2032)
Figure 17. Rest of Europe Ripe Olives Revenue (USD Million) By Country (2021-2032)
Figure 11. Asia Pacific Ripe Olives Revenue (USD Million) By Country (2021-2032)
Figure 12. China Ripe Olives Revenue (USD Million) By Country (2021-2032)
Figure 13. Japan Ripe Olives Revenue (USD Million) By Country (2021-2032)
Figure 14. India Ripe Olives Revenue (USD Million) By Country (2021-2032)
Figure 15. South Korea Ripe Olives Revenue (USD Million) By Country (2021-2032)
Figure 16. Australia Ripe Olives Revenue (USD Million) By Country (2021-2032)
Figure 17. South East Asia Ripe Olives Revenue (USD Million) By Country (2021-2032)
Figure 18. South America Ripe Olives Revenue (USD Million) By Country (2021-2032)
Figure 19. Brazil Ripe Olives Revenue (USD Million) By Country (2021-2032)
Figure 20. Argentina Ripe Olives Revenue (USD Million) By Country (2021-2032)
Figure 21. Rest of Asia Pacific Ripe Olives Revenue (USD Million) By Country (2021-2032)
Figure 22. Middle East and Africa Ripe Olives Revenue (USD Million) By Region (2021-2032)
Figure 23. Saudi Arabia Ripe Olives Revenue (USD Million) By Region (2021-2032)
Figure 24. The UAE Ripe Olives Revenue (USD Million) By Region (2021-2032)
Figure 25. Rest of Middle East Ripe Olives Revenue (USD Million) By Region (2021-2032)
Figure 26. South Africa Ripe Olives Revenue (USD Million) By Region (2021-2032)
Figure 27. Africa Ripe Olives Revenue (USD Million) By Region (2021-2032)
Figure 28. North America Ripe Olives Revenue (USD Million) By Type (2021-2032)
Figure 29. North America Ripe Olives Revenue (USD Million) By Application (2021-2032)
Figure 30. North America Ripe Olives Revenue (USD Million) By Product (2021-2032)
Figure 31. Europe Ripe Olives Revenue (USD Million) By Type (2021-2032)
Figure 32. Europe Ripe Olives Revenue (USD Million) By Application (2021-2032)
Figure 33. Europe Ripe Olives Revenue (USD Million) By Product (2021-2032)
Figure 34. Asia Pacific Ripe Olives Revenue (USD Million) By Type (2021-2032)
Figure 35. Asia Pacific Ripe Olives Revenue (USD Million) By Application (2021-2032)
Figure 36. Asia Pacific Ripe Olives Revenue (USD Million) By Product (2021-2032)
Figure 37. South America Ripe Olives Revenue (USD Million) By Type (2021-2032)
Figure 38. South America Ripe Olives Revenue (USD Million) By Application (2021-2032)
Figure 39. South America Ripe Olives Revenue (USD Million) By Product (2021-2032)
Figure 40. Middle East and Africa Ripe Olives Revenue (USD Million) By Type (2021-2032)
Figure 41. Middle East and Africa Ripe Olives Revenue (USD Million) By Application (2021-2032)
Figure 42. Middle East and Africa Ripe Olives Revenue (USD Million) By Product (2021-2032)
By Product
Sliced Olives
Pitted Olives
Whole Olives
By Distribution Channel
Online
Offline
Countries Analyzed
North America (US, Canada, Mexico)
Europe (Germany, UK, France, Spain, Italy, Russia, Rest of Europe)
Asia Pacific (China, India, Japan, South Korea, Australia, South East Asia, Rest of Asia)
South America (Brazil, Argentina, Rest of South America)
Middle East and Africa (Saudi Arabia, UAE, Rest of Middle East, South Africa, Egypt, Rest of Africa)
