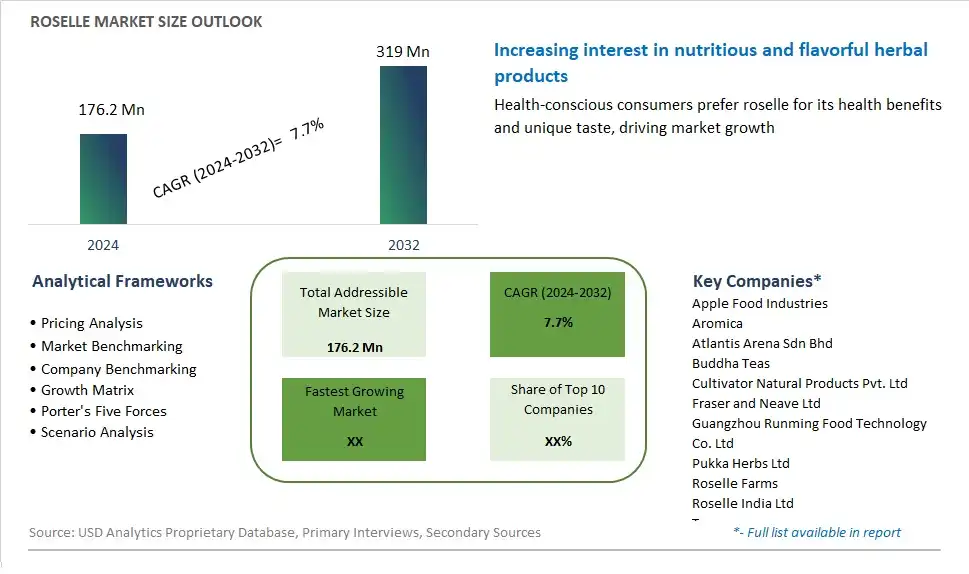
Global Roselle Market Size is valued at $176.2 Million in 2024 and is forecast to register a growth rate (CAGR) of 7.7% to reach $319 Million by 2032.
The global Roselle Market Comprehensive Study analyzes and forecasts the market size across 6 regions and 24 countries for diverse segments -By Form (Powder, Liquid), By End-User (Food & Beverages, Pharmaceuticals, Animal Feed, Cosmetics & Nutraceuticals), By Distribution Channel (Offline, Online)
An Introduction to Roselle Market
In 2024, the roselle market is experiencing significant growth, driven by rising consumer interest in natural and health-promoting products. Roselle, known for its vibrant red flowers and tangy flavor, is widely used in teas, beverages, jams, and herbal supplements. Its high content of antioxidants, vitamins, and minerals makes it a popular ingredient for boosting immune health and managing blood pressure. The market benefits from increased awareness of its medicinal properties and the growing trend towards organic and plant-based products. Key producing regions like Africa and Southeast Asia are focusing on sustainable cultivation practices to meet the rising global demand.
Roselle Competitive Landscape
The market report analyses the leading companies in the industry including Apple Food Industries, Aromica, Atlantis Arena Sdn Bhd, Buddha Teas, Cultivator Natural Products Pvt. Ltd, Fraser and Neave Ltd, Guangzhou Runming Food Technology Co. Ltd, Pukka Herbs Ltd, Roselle Farms, Roselle India Ltd, Teacurry, Thai Organic Life, The Tao of Tea , US Wellness LLC, and Others.
Roselle Market Dynamics
Roselle Market Trend: Increasing Consumer Interest in Functional and Herbal Beverages
A prominent market trend in the roselle segment is the increasing consumer interest in functional and herbal beverages. Roselle, also known as hibiscus sabdariffa, is gaining attention for its potential health benefits and versatility as an ingredient in beverages. With growing awareness of the importance of holistic wellness and natural remedies, consumers are seeking out beverages infused with roselle for its antioxidant properties, potential heart health benefits, and refreshing taste profile. This trend is driven by a desire for healthier beverage options that offer both hydration and functional benefits, aligning with the broader wellness movement and the demand for natural, plant-based ingredients in food and beverages.
Market Driver: Demand for Natural Ingredients and Botanical Flavors
The market driver for roselle is the demand for natural ingredients and botanical flavors in food and beverage products. As consumers become more health-conscious and discerning about the ingredients in their diets, there is a growing preference for products made with natural, plant-derived ingredients like roselle. The vibrant color, tart flavor, and floral aroma of roselle make it a desirable ingredient for beverages, sauces, jams, and other culinary applications. This driver is reinforced by the increasing popularity of herbal teas, botanical-infused drinks, and functional beverages that harness the nutritional and sensory properties of plants like roselle to enhance flavor, color, and health benefits.
Market Opportunity: Expansion into Functional Food and Beverage Categories
One potential opportunity for the roselle market lies in expansion into functional food and beverage categories beyond traditional herbal teas. While roselle tea remains a popular beverage choice, there is potential for growth by incorporating roselle into a wider range of functional food and beverage products such as juices, smoothies, energy drinks, snacks, and supplements. By leveraging the antioxidant and anti-inflammatory properties of roselle, manufacturers can develop innovative products that appeal to health-conscious consumers seeking convenient and enjoyable ways to support their well-being. Additionally, exploring partnerships with other health-focused brands, launching targeted marketing campaigns, and emphasizing the unique health benefits of roselle can help drive awareness and adoption of roselle-infused products in the functional food and beverage market.
Roselle Market Share Analysis: Cosmetics & Nutraceuticals market is poised to register the fastest growth rae over the forecast period to 2032
In the Roselle market segmented by end-user, the Cosmetics & Nutraceuticals segment is the fastest-growing, propelled by the increasing consumer awareness of the health and skincare benefits offered by roselle extract and its derivatives. Roselle, also known as Hibiscus sabdariffa, contains compounds rich in antioxidants, vitamins, and minerals, making it a valuable ingredient in cosmetic and nutraceutical formulations. This growth is driven by several factors, including the rising demand for natural and plant-based ingredients in skincare products, fueled by consumer preferences for clean and sustainable beauty solutions. Roselle extract is valued for its anti-aging, moisturizing, and skin-brightening properties, making it a sought-after ingredient in skincare serums, creams, and masks. Further, the nutritional benefits of roselle, such as its high vitamin C content and potential cholesterol-lowering effects, contribute to its popularity in the nutraceutical industry, where it is utilized in dietary supplements, herbal teas, and health drinks. Additionally, the versatility of roselle extract allows for its incorporation into a wide range of cosmetic and nutraceutical formulations, catering to diverse consumer needs and preferences. Furthermore, the growing trend of holistic wellness and the increasing adoption of natural and plant-based products drive the demand for roselle-based cosmetics and nutraceuticals, further propelling the growth of the Cosmetics & Nutraceuticals segment in the Roselle market. Overall, the combination of consumer demand for natural skincare solutions, the nutritional benefits of roselle extract, and its versatile applications in cosmetic and nutraceutical formulations position the Cosmetics & Nutraceuticals segment as the fastest-growing in the Roselle market.
Roselle Market Share Analysis: Offline held the dominant market share in 2024
In the Roselle market segmented by distribution channel, the Offline segment is the largest, driven by the established presence of brick-and-mortar retail outlets, including supermarkets, specialty stores, and pharmacies, which cater to a wide range of consumers. Offline channels offer customers the advantage of physically examining and purchasing roselle products, providing a tactile shopping experience that appeals to many buyers. Additionally, offline retailers often employ knowledgeable staff who can provide personalized recommendations and guidance on roselle-based products, enhancing the overall shopping experience. Further, offline distribution channels benefit from longstanding relationships with suppliers and manufacturers, ensuring a steady supply of roselle products to meet consumer demand. Furthermore, consumers may prefer offline channels for their immediacy and the assurance of product quality and authenticity. While online distribution channels are growing, the offline segment maintains its dominance due to its convenience, trustworthiness, and the familiarity of traditional shopping experiences. Overall, the combination of accessibility, personalized service, and consumer trust positions the Offline segment as the largest in the Roselle market.
Roselle Market Segmentation
By Form
Powder
Liquid
By End-User
Food & Beverages
Pharmaceuticals
Animal Feed
Cosmetics & Nutraceuticals
By Distribution Channel
Offline
Online
Countries Analyzed
North America (US, Canada, Mexico)
Europe (Germany, UK, France, Spain, Italy, Russia, Rest of Europe)
Asia Pacific (China, India, Japan, South Korea, Australia, South East Asia, Rest of Asia)
South America (Brazil, Argentina, Rest of South America)
Middle East and Africa (Saudi Arabia, UAE, Rest of Middle East, South Africa, Egypt, Rest of Africa)
Roselle Companies Profiled in the Study
Apple Food Industries
Aromica
Atlantis Arena Sdn Bhd
Buddha Teas
Cultivator Natural Products Pvt. Ltd
Fraser and Neave Ltd
Guangzhou Runming Food Technology Co. Ltd
Pukka Herbs Ltd
Roselle Farms
Roselle India Ltd
Teacurry
Thai Organic Life
The Tao of Tea
US Wellness LLC
*- List Not Exhaustive
Chapter 1. TABLE OF CONTENTS
Chapter 2. Introduction to Roselle Market
2.1. Market Overview
2.2. Key Statistics and Report Highlights
2.3. Scope of the Comprehensive Study
2.3.1. Market Definition
2.3.2 Countries and Regions Covered
2.3.3 Research Objective
2.3.4 Units, Currency, and Conversions
2.3.5 Industry Value Chain
2.4. Key Market Segments
2.5. Key Companies
2.6. Study Period
Chapter 3. Strategic Analysis Review
3.1. Roselle Pricing Analysis and Forecast
3.2. Porter’s Five Forces
3.3. Market Ecosystem
3.4. SWOT Analysis
3.5. Regulatory Scenario
3.3. Effects of Inflation, Russia-Ukraine War, moderating economic growth, and other macroeconomic factors
Chapter 4. Competitive Landscape
4.1. Market Share Analysis
4.1.1. Global Roselle Market Share by Company, 2023
4.1.2. Product Offerings of Leading Roselle Companies
4.2. Market Entropy
4.2.1. New Product Launches in the Industry
4.2.2. Mergers, Acquisitions, Joint ventures, and Partnerships
4.3. Key Strategies and Best Practices
Chapter 5. Global Market Projections: Best, Reference, and Low Case Scenarios
5.1. Growth Analysis- Case Scenario Definitions
5.2. Low Growth Case Scenario Forecasts
5.3. Reference Growth Case Scenario Forecasts
5.4. High Growth Case Scenario Forecasts
Chapter 6. Market Dynamics
6.1. Roselle Market Drivers
6.2. Roselle Market Challenges
6.6. Roselle Market Opportunities
6.4. Roselle Market Trends
Chapter 7. Global Roselle Market Outlook Trends
7.1. Global Roselle Revenue (USD Million) and CAGR (%) by Type (2021-2032)
7.2. Global Roselle Revenue (USD Million) and CAGR (%) by Application (2021-2032)
7.3. Global Roselle Revenue (USD Million) and CAGR (%) by Product (2021-2032)
By Form
Powder
Liquid
By End-User
Food & Beverages
Pharmaceuticals
Animal Feed
Cosmetics & Nutraceuticals
By Distribution Channel
Offline
Online
Chapter 8. Global Roselle Regional Analysis and Outlook
8.1. Global Roselle Revenue (USD Million) By Regions (2021- 2032)
8.2. North America Roselle Revenue (USD Million) by Country (2021-2032)
8.2.1. United States Roselle Regional Analysis and Outlook
8.2.2. Canada Roselle Regional Analysis and Outlook
8.2.3. Mexico Roselle Regional Analysis and Outlook
8.3. Europe Roselle Revenue (USD Million), by Country (2021-2032)
8.3.1. Germany Roselle Regional Analysis and Outlook
8.3.2. France Roselle Regional Analysis and Outlook
8.3.3. United Kingdom Roselle Regional Analysis and Outlook
8.3.4. Spain Roselle Regional Analysis and Outlook
8.3.5. Italy Roselle Regional Analysis and Outlook
8.3.6. Russia Roselle Regional Analysis and Outlook
8.3.7. Rest of Europe Roselle Regional Analysis and Outlook
8.4. Asia Pacific Roselle Revenue (USD Million) by Country (2021-2032)
8.4.1. China Roselle Regional Analysis and Outlook
8.4.2. Japan Roselle Regional Analysis and Outlook
8.4.3. India Roselle Regional Analysis and Outlook
8.4.4. South Korea Roselle Regional Analysis and Outlook
8.4.5. Australia Roselle Regional Analysis and Outlook
8.4.6. South East Asia Roselle Regional Analysis and Outlook
8.4.7. Rest of Asia Pacific Roselle Regional Analysis and Outlook
8.5. South America Roselle Revenue (USD Million), by Country (2021-2032)
8.5.1. Brazil Roselle Regional Analysis and Outlook
8.5.2. Argentina Roselle Regional Analysis and Outlook
8.5.3. Rest of South America Roselle Regional Analysis and Outlook
8.6. Middle East and Africa Roselle Revenue (USD Million) by Country (2021-2032)
8.6.1. Middle East Roselle Regional Analysis and Outlook
8.6.2. Africa Roselle Regional Analysis and Outlook
Chapter 9. North America Roselle Analysis and Outlook
9.1. North America Roselle Revenue (USD Million) by Segments (2021-2032)
9.1.1. North America Roselle Revenue (USD Million) by Type (2021-2032)
9.1.2. North America Roselle Revenue (USD Million) by Application (2021-2032)
9.1.3. North America Roselle Revenue (USD Million) by Product (2021-2032)
By Form
Powder
Liquid
By End-User
Food & Beverages
Pharmaceuticals
Animal Feed
Cosmetics & Nutraceuticals
By Distribution Channel
Offline
Online
Chapter 10. Europe Roselle Analysis and Outlook
10.1. Europe Roselle Revenue (USD Million), by Segments (USD Million) (2021-2032)
10.1.1. Europe Roselle Revenue (USD Million) by Type (2021-2032)
10.1.2. Europe Roselle Revenue (USD Million) by Application (2021-2032)
10.1.3. Europe Roselle Revenue (USD Million) by Product (2021-2032)
By Form
Powder
Liquid
By End-User
Food & Beverages
Pharmaceuticals
Animal Feed
Cosmetics & Nutraceuticals
By Distribution Channel
Offline
Online
Chapter 11. Asia Pacific Roselle Analysis and Outlook
11.1. Asia Pacific Roselle Revenue (USD Million), and Revenue (USD Million) by Segments (2021-2032)
11.1.1. Asia Pacific Roselle Revenue (USD Million) by Type (2021-2032)
11.1.2. Asia Pacific Roselle Revenue (USD Million) by Application (2021-2032)
11.1.3. Asia Pacific Roselle Revenue (USD Million) by Product (2021-2032)
By Form
Powder
Liquid
By End-User
Food & Beverages
Pharmaceuticals
Animal Feed
Cosmetics & Nutraceuticals
By Distribution Channel
Offline
Online
Chapter 12. South America Roselle Analysis and Outlook
12.1. South America Roselle Revenue (USD Million), by Segments (2021-2032)
12.1.1. South America Roselle Revenue (USD Million) by Type (2021-2032)
12.1.2. South America Roselle Revenue (USD Million) by Application (2021-2032)
12.1.3. South America Roselle Revenue (USD Million) by Product (2021-2032)
By Form
Powder
Liquid
By End-User
Food & Beverages
Pharmaceuticals
Animal Feed
Cosmetics & Nutraceuticals
By Distribution Channel
Offline
Online
Chapter 13. Middle East and Africa Roselle Analysis and Outlook
13.1. Middle East and Africa Roselle Revenue (USD Million), by Segments (2021-2032)
13.1.1. Middle East and Africa Roselle Revenue (USD Million) by Type (2021-2032)
13.1.2. Middle East and Africa Roselle Revenue (USD Million) by Application (2021-2032)
13.1.3. Middle East and Africa Roselle Revenue (USD Million) by Product (2021-2032)
By Form
Powder
Liquid
By End-User
Food & Beverages
Pharmaceuticals
Animal Feed
Cosmetics & Nutraceuticals
By Distribution Channel
Offline
Online
Chapter 14. Roselle Company Profiles
14.1 Business Overview
14.2 Product Profiles
14.3 SWOT Profiles
14.5 Recent Developments
14.6 Financial Profile
List of Companies
Apple Food Industries
Aromica
Atlantis Arena Sdn Bhd
Buddha Teas
Cultivator Natural Products Pvt. Ltd
Fraser and Neave Ltd
Guangzhou Runming Food Technology Co. Ltd
Pukka Herbs Ltd
Roselle Farms
Roselle India Ltd
Teacurry
Thai Organic Life
The Tao of Tea
US Wellness LLC
15. Methodology and Data Sources
15.1 Customization Offerings
15.2 Subscription Services
15.3 Related Reports
15.4 Publisher Expertise
LIST OF TABLES
Table 1 Market Segmentation Analysis
Table 2 Global Roselle Market Share of Leading Companies, 2023
Table 3 Product Offerings of Leading Companies
Table 4 Low Growth Scenario Forecasts
Table 5 Reference Case Growth Scenario
Table 6 High Growth Case Scenario
Table 7 Global Roselle Revenue (USD Million) And CAGR (%) By Type (2021-2032)
Table 8 Global Roselle Revenue (USD Million) And CAGR (%) By Application (2021-2032)
Table 9 Global Roselle Revenue (USD Million) And CAGR (%) By Product (2021-2032)
Table 10 Global Roselle Market Revenue (USD Million) By Regions (2021-2032)
Table 11 Global Roselle Market Share (%) By Regions (2021-2032)
Table 12 North America Roselle Revenue (USD Million) By Country (2021-2032)
Table 13 Europe Roselle Revenue (USD Million) By Country (2021-2032)
Table 14 Asia Pacific Roselle Revenue (USD Million) By Country (2021-2032)
Table 15 South America Roselle Revenue (USD Million) By Country (2021-2032)
Table 16 Middle East and Africa Roselle Revenue (USD Million) By Region (2021-2032)
Table 17 North America Roselle Revenue (USD Million) By Type (2021-2032)
Table 18 North America Roselle Revenue (USD Million) By Application (2021-2032)
Table 19 North America Roselle Revenue (USD Million) By Product (2021-2032)
Table 20 Europe Roselle Revenue (USD Million) By Type (2021-2032)
Table 21 Europe Roselle Revenue (USD Million) By Application (2021-2032)
Table 22 Europe Roselle Revenue (USD Million) By Product (2021-2032)
Table 23 Asia Pacific Roselle Revenue (USD Million) By Type (2021-2032)
Table 24 Asia Pacific Roselle Revenue (USD Million) By Application (2021-2032)
Table 25 Asia Pacific Roselle Revenue (USD Million) By Product (2021-2032)
Table 26 South America Roselle Revenue (USD Million) By Type (2021-2032)
Table 27 South America Roselle Revenue (USD Million) By Application (2021-2032)
Table 28 South America Roselle Revenue (USD Million) By Product (2021-2032)
Table 29 Middle East and Africa Roselle Revenue (USD Million) By Type (2021-2032)
Table 30 Middle East and Africa Roselle Revenue (USD Million) By Application (2021-2032)
Table 31 Middle East and Africa Roselle Revenue (USD Million) By Product (2021-2032)
LIST OF FIGURES
Figure 1. Market Scope
Figure 2. Pricing Forecasts Per Unit, 2023- 2032
Figure 3. Porter’s Five Forces
Figure 4. Global Roselle Market Revenue (USD Million) By Regions (2021-2032)
Figure 5. Global Roselle Market Share (%) By Regions (2023)
Figure 6. North America Roselle Revenue (USD Million) By Country (2021-2032)
Figure 7. United States Roselle Revenue (USD Million) By Country (2021-2032)
Figure 8. Canada Roselle Revenue (USD Million) By Country (2021-2032)
Figure 9. Mexico Roselle Revenue (USD Million) By Country (2021-2032)
Figure 10. Europe Roselle Revenue (USD Million) By Country (2021-2032)
Figure 11. Germany Roselle Revenue (USD Million) By Country (2021-2032)
Figure 12. France Roselle Revenue (USD Million) By Country (2021-2032)
Figure 13. United Kingdom Roselle Revenue (USD Million) By Country (2021-2032)
Figure 14. Spain Roselle Revenue (USD Million) By Country (2021-2032)
Figure 15. Italy Roselle Revenue (USD Million) By Country (2021-2032)
Figure 16. Russia Roselle Revenue (USD Million) By Country (2021-2032)
Figure 17. Rest of Europe Roselle Revenue (USD Million) By Country (2021-2032)
Figure 11. Asia Pacific Roselle Revenue (USD Million) By Country (2021-2032)
Figure 12. China Roselle Revenue (USD Million) By Country (2021-2032)
Figure 13. Japan Roselle Revenue (USD Million) By Country (2021-2032)
Figure 14. India Roselle Revenue (USD Million) By Country (2021-2032)
Figure 15. South Korea Roselle Revenue (USD Million) By Country (2021-2032)
Figure 16. Australia Roselle Revenue (USD Million) By Country (2021-2032)
Figure 17. South East Asia Roselle Revenue (USD Million) By Country (2021-2032)
Figure 18. South America Roselle Revenue (USD Million) By Country (2021-2032)
Figure 19. Brazil Roselle Revenue (USD Million) By Country (2021-2032)
Figure 20. Argentina Roselle Revenue (USD Million) By Country (2021-2032)
Figure 21. Rest of Asia Pacific Roselle Revenue (USD Million) By Country (2021-2032)
Figure 22. Middle East and Africa Roselle Revenue (USD Million) By Region (2021-2032)
Figure 23. Saudi Arabia Roselle Revenue (USD Million) By Region (2021-2032)
Figure 24. The UAE Roselle Revenue (USD Million) By Region (2021-2032)
Figure 25. Rest of Middle East Roselle Revenue (USD Million) By Region (2021-2032)
Figure 26. South Africa Roselle Revenue (USD Million) By Region (2021-2032)
Figure 27. Africa Roselle Revenue (USD Million) By Region (2021-2032)
Figure 28. North America Roselle Revenue (USD Million) By Type (2021-2032)
Figure 29. North America Roselle Revenue (USD Million) By Application (2021-2032)
Figure 30. North America Roselle Revenue (USD Million) By Product (2021-2032)
Figure 31. Europe Roselle Revenue (USD Million) By Type (2021-2032)
Figure 32. Europe Roselle Revenue (USD Million) By Application (2021-2032)
Figure 33. Europe Roselle Revenue (USD Million) By Product (2021-2032)
Figure 34. Asia Pacific Roselle Revenue (USD Million) By Type (2021-2032)
Figure 35. Asia Pacific Roselle Revenue (USD Million) By Application (2021-2032)
Figure 36. Asia Pacific Roselle Revenue (USD Million) By Product (2021-2032)
Figure 37. South America Roselle Revenue (USD Million) By Type (2021-2032)
Figure 38. South America Roselle Revenue (USD Million) By Application (2021-2032)
Figure 39. South America Roselle Revenue (USD Million) By Product (2021-2032)
Figure 40. Middle East and Africa Roselle Revenue (USD Million) By Type (2021-2032)
Figure 41. Middle East and Africa Roselle Revenue (USD Million) By Application (2021-2032)
Figure 42. Middle East and Africa Roselle Revenue (USD Million) By Product (2021-2032)
By Form
Powder
Liquid
By End-User
Food & Beverages
Pharmaceuticals
Animal Feed
Cosmetics & Nutraceuticals
By Distribution Channel
Offline
Online
Countries Analyzed
North America (US, Canada, Mexico)
Europe (Germany, UK, France, Spain, Italy, Russia, Rest of Europe)
Asia Pacific (China, India, Japan, South Korea, Australia, South East Asia, Rest of Asia)
South America (Brazil, Argentina, Rest of South America)
Middle East and Africa (Saudi Arabia, UAE, Rest of Middle East, South Africa, Egypt, Rest of Africa)
