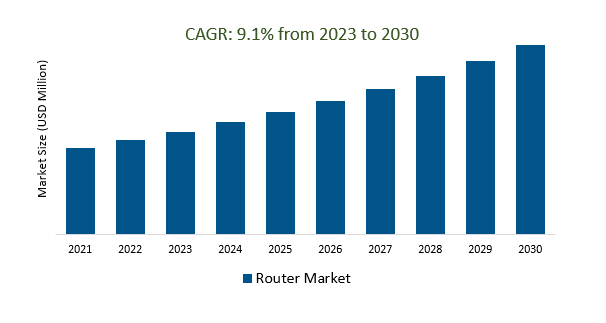
The Global Router Market Size is estimated to register 9.1% growth over the forecast period from 2023 to 2030.
The Router Market is influenced by various factors, including the increasing demand for high-speed internet, the adoption of Wi-Fi 6 and Wi-Fi 6E technologies, home networking and mesh Wi-Fi systems, 5G integration, IoT connectivity, remote work and VPN support, cybersecurity concerns, cloud-based management, sustainable and energy-efficient routers, and edge computing. High-speed internet connections are essential for bandwidth-intensive applications, while routers with better device management and security features are needed for IoT devices. Remote work and VPN support are also crucial for secure remote access to corporate networks and data. Cybersecurity features like intrusion detection, malware protection, and regular firmware updates are also essential. Cloud-based management allows remote monitoring and configuration of routers, while sustainable and energy-efficient routers focus on consuming less power and longer lifespans.
High-Speed Internet and the Need for Advanced Routers is boosting the market.
The demand for high-speed internet has skyrocketed in recent years, becoming an essential component of our digital lives. As a result, the routers market has experienced a significant surge in growth and innovation. Advanced routers are now a necessity, as they play a pivotal role in optimizing the internet experience. These sophisticated devices are designed to handle the increased data traffic and deliver seamless connectivity to support the growing array of smart devices, streaming services, and online applications. The competitive landscape of the routers market is continuously evolving, with manufacturers striving to develop cutting-edge technology to meet the escalating demands of consumers. In this era of connectivity, advanced routers have become a linchpin in our daily lives, connecting us to the world at high speeds and ensuring a seamless online experience.
Wi-Fi 6 and Wi-Fi 6E Adoption in Consumer and Business Networks is creating a demand in the market.
The rapid adoption of Wi-Fi 6 and Wi-Fi 6E in both consumer and business networks is reshaping the landscape of the routers market. These cutting-edge wireless standards offer higher speeds, increased capacity, and reduced interference, making them a compelling choice for users seeking improved network performance. In the consumer sector, the demand for seamless streaming, gaming, and smart home applications is driving the need for Wi-Fi 6-enabled routers. On the business front, the expansion of remote work and the proliferation of IoT devices necessitate robust, high-speed network solutions. As a result, the routers market is experiencing a surge in demand, with companies and individuals seeking routers that can harness the full potential of these advanced Wi-Fi standards. This trend has also spurred innovation in the industry, with manufacturers developing a wide range of feature-rich routers to cater to diverse needs, further fuelling the growth of the market. Overall, the adoption of Wi-Fi 6 and Wi-Fi 6E is ushering in a new era of connectivity, where faster and more reliable wireless networks are becoming the norm in homes and workplaces.
The Impact of 5G Integration on the Router Market is fuelling demand and attracting a wide customer base.
The integration of 5G technology into the router market has brought about a profound transformation, significantly impacting the industry. This fusion is driving a surge in demand for routers that are equipped to harness the power of 5G networks. As a result, the router market is experiencing a robust growth trajectory, with an expanding customer base that spans both consumer and business sectors. This trend can be attributed to the increasing need for faster and more reliable internet connections, as 5G promises to deliver lightning-fast speeds and reduced latency, making it a highly sought-after technology. The implications of 5G integration on the router market are clear, shaping the market landscape and influencing consumer choices as they seek to harness the benefits of this cutting-edge technology for various applications. This development reflects the ever-evolving nature of technology markets and the pivotal role 5G is set to play in our interconnected world.
Market Share Analysis:
Wireless routers have undeniably emerged as the dominant force in the ever-evolving world of networking technology.
This supremacy can be attributed to their unmatched convenience and versatility. Unlike their wired counterparts, wireless routers liberate users from the constraints of physical connections, allowing seamless internet access throughout homes and businesses. Their prevalence has grown rapidly, driven by the proliferation of mobile devices, smart appliances, and the demand for uninterrupted connectivity. With the ability to connect multiple devices simultaneously, these routers have become the linchpin of modern digital lifestyles, facilitating streaming, gaming, and remote work with remarkable ease. Their ubiquity in homes and offices underscores the pivotal role they play in the interconnected digital age.
IT and Telecom is the most dominant end-user segment in the routers market.
The Information Technology (IT) and Telecommunications sector stands as the prevailing force within the routers market, exerting significant influence and driving its growth. In an era where connectivity and data transmission are paramount, these industries heavily rely on routers as the backbone of their network infrastructure. Routers play a pivotal role in ensuring seamless communication, data transfer, and internet connectivity for both individuals and businesses. With the ever-increasing demand for high-speed, reliable networks, the IT and Telecom sector's dominance in the routers market is no surprise. Their consistent investment in cutting-edge technologies and network expansion continues to shape the router industry, making it a vital component of our digital age.
The Asia Pacific region stands as the unrivalled leader in the global routers market, showcasing remarkable dominance and influence.
With its burgeoning population and rapidly advancing technological landscape, this region has become a hotspot for networking and connectivity solutions. The demand for routers in the Asia Pacific is propelled by the increasing adoption of digital technologies, the rapid expansion of internet connectivity, and the proliferation of mobile devices. As businesses and individuals embrace digital transformation, the need for reliable and efficient routers has become paramount, solidifying the region's market supremacy. Furthermore, the robust presence of major tech companies and a dynamic entrepreneurial ecosystem continue to stimulate growth, making the Asia Pacific a pivotal player in the global routers market.
Router Market Segmentation
By Type
By End-User
- BFSI
- IT and Telecom
- Education
- Healthcare
- Others
By Region
- North America (United States, Canada, Mexico)
- Europe (Germany, France, United Kingdom, Spain, Italy, Others)
- Asia Pacific (China, India, Japan, South Korea, Australia, Others)
- Latin America (Brazil, Argentina, Others)
- Middle East and Africa (Saudi Arabia, UAE, Kuwait, Other Middle East, South Africa, Nigeria, Other Africa)
Router Market Companies
- Xiaomi
- TP link Technologies CO. Ltd
- Cisco systems Inc
- Synology Inc Eero LLC
- Huawei Technologies Co. Ltd
- ASUSTeK Computer Inc
- Belkin International Inc
- D-link Corp
- Netgear
*List not exhaustive
Router Market Outlook 2023
1 Market Overview
1.1 Introduction to the Router Market
1.2 Scope of the Study
1.3 Research Objective
1.3.1 Key Market Scope and Segments
1.3.2 Players Covered
1.3.3 Years Considered
2 Executive Summary
2.1 2023 Router Industry- Market Statistics
3 Market Dynamics
3.1 Market Drivers
3.2 Market Challenges
3.3 Market Opportunities
3.4 Market Trends
4 Market Factor Analysis
4.1 Porter’s Five Forces
4.2 Market Entropy
4.2.1 Global Router Market Companies with Area Served
4.2.2 Products Offerings Global Router Market
5 COVID-19 Impact Analysis and Outlook Scenarios
5.1.1 Covid-19 Impact Analysis
5.1.2 Post-COVID-19 Scenario- Low Growth Case
5.1.3 Post-COVID-19 Scenario- Reference Growth Case
5.1.4 Post-COVID-19 Scenario- Low Growth Case
6 Global Router Market Trends
6.1 Global Router Revenue (USD Million) and CAGR (%) by Type (2018-2030)
6.2 Global Router Revenue (USD Million) and CAGR (%) by Applications (2018-2030)
6.3 Global Router Revenue (USD Million) and CAGR (%) by Regions (2018-2030)
7 Global Router Market Revenue (USD Million) by Type, and Applications (2018-2022)
7.1 Global Router Revenue (USD Million) by Type (2018-2022)
7.1.1 Global Router Revenue (USD Million), Market Share (%) by Type (2018-2022)
7.2 Global Router Revenue (USD Million) by Applications (2018-2022)
7.2.1 Global Router Revenue (USD Million), Market Share (%) by Applications (2018-2022)
8 Global Router Development Regional Status and Outlook
8.1 Global Router Revenue (USD Million) By Regions (2018-2022)
8.2 North America Router Revenue (USD Million) by Type, and Application (2018-2022)
8.2.1 North America Router Revenue (USD Million) by Country (2018-2022)
8.2.2 North America Router Revenue (USD Million) by Type (2018-2022)
8.2.3 North America Router Revenue (USD Million) by Applications (2018-2022)
8.3 Europe Router Revenue (USD Million), by Type, and Applications (USD Million) (2018-2022)
8.3.1 Europe Router Revenue (USD Million), by Country (2018-2022)
8.3.2 Europe Router Revenue (USD Million) by Type (2018-2022)
8.3.3 Europe Router Revenue (USD Million) by Applications (2018-2022)
8.4 Asia Pacific Router Revenue (USD Million), and Revenue (USD Million) by Type, and Applications (2018-2022)
8.4.1 Asia Pacific Router Revenue (USD Million) by Country (2018-2022)
8.4.2 Asia Pacific Router Revenue (USD Million) by Type (2018-2022)
8.4.3 Asia Pacific Router Revenue (USD Million) by Applications (2018-2022)
8.5 South America Router Revenue (USD Million), by Type, and Applications (2018-2022)
8.5.1 South America Router Revenue (USD Million), by Country (2018-2022)
8.5.2 South America Router Revenue (USD Million) by Type (2018-2022)
8.5.3 South America Router Revenue (USD Million) by Applications (2018-2022)
8.6 Middle East and Africa Router Revenue (USD Million), by Type, Technology, Application, Thickness (2018-2022)
8.6.1 Middle East and Africa Router Revenue (USD Million) by Country (2018-2022)
8.6.2 Middle East and Africa Router Revenue (USD Million) by Type (2018-2022)
8.6.3 Middle East and Africa Router Revenue (USD Million) by Applications (2018-2022)
9 Company Profiles
10 Global Router Market Revenue (USD Million), by Type, and Applications (2023-2030)
10.1 Global Router Revenue (USD Million) and Market Share (%) by Type (2023-2030)
10.1.1 Global Router Revenue (USD Million), and Market Share (%) by Type (2023-2030)
10.2 Global Router Revenue (USD Million) and Market Share (%) by Applications (2023-2030)
10.2.1 Global Router Revenue (USD Million), and Market Share (%) by Applications (2023-2030)
11 Global Router Development Regional Status and Outlook Forecast
11.1 Global Router Revenue (USD Million) By Regions (2023-2030)
11.2 North America Router Revenue (USD Million) by Type, and Applications (2023-2030)
11.2.1 North America Router Revenue (USD) Million by Country (2023-2030)
11.2.2 North America Router Revenue (USD Million), by Type (2023-2030)
11.2.3 North America Router Revenue (USD Million), Market Share (%) by Applications (2023-2030)
11.3 Europe Router Revenue (USD Million), by Type, and Applications (2023-2030)
11.3.1 Europe Router Revenue (USD Million), by Country (2023-2030)
11.3.2 Europe Router Revenue (USD Million), by Type (2023-2030)
11.3.3 Europe Router Revenue (USD Million), by Applications (2023-2030)
11.4 Asia Pacific Router Revenue (USD Million) by Type, and Applications (2023-2030)
11.4.1 Asia Pacific Router Revenue (USD Million), by Country (2023-2030)
11.4.2 Asia Pacific Router Revenue (USD Million), by Type (2023-2030)
11.4.3 Asia Pacific Router Revenue (USD Million), by Applications (2023-2030)
11.5 South America Router Revenue (USD Million), by Type, and Applications (2023-2030)
11.5.1 South America Router Revenue (USD Million), by Country (2023-2030)
11.5.2 South America Router Revenue (USD Million), by Type (2023-2030)
11.5.3 South America Router Revenue (USD Million), by Applications (2023-2030)
11.6 Middle East and Africa Router Revenue (USD Million), by Type, and Applications (2023-2030)
11.6.1 Middle East and Africa Router Revenue (USD Million), by Region (2023-2030)
11.6.2 Middle East and Africa Router Revenue (USD Million), by Type (2023-2030)
11.6.3 Middle East and Africa Router Revenue (USD Million), by Applications (2023-2030)
12 Methodology and Data Sources
12.1 Methodology/Research Approach
12.1.1 Research Programs/Design
12.1.2 Market Size Estimation
12.1.3 Market Breakdown and Data Triangulation
12.2 Data Sources
12.2.1 Secondary Sources
12.2.2 Primary Sources
12.3 Disclaimer
List of Tables
Table 1 Market Segmentation Analysis
Table 2 Global Router Market Companies with Areas Served
Table 3 Products Offerings Global Router Market
Table 4 Low Growth Scenario Forecasts
Table 5 Reference Case Growth Scenario
Table 6 High Growth Case Scenario
Table 7 Global Router Revenue (USD Million) And CAGR (%) By Type (2018-2030)
Table 8 Global Router Revenue (USD Million) And CAGR (%) By Applications (2018-2030)
Table 9 Global Router Revenue (USD Million) And CAGR (%) By Regions (2018-2030)
Table 10 Global Router Revenue (USD Million) By Type (2018-2022)
Table 11 Global Router Revenue Market Share (%) By Type (2018-2022)
Table 12 Global Router Revenue (USD Million) By Applications (2018-2022)
Table 13 Global Router Revenue Market Share (%) By Applications (2018-2022)
Table 14 Global Router Market Revenue (USD Million) By Regions (2018-2022)
Table 15 Global Router Market Share (%) By Regions (2018-2022)
Table 16 North America Router Revenue (USD Million) By Country (2018-2022)
Table 17 North America Router Revenue (USD Million) By Type (2018-2022)
Table 18 North America Router Revenue (USD Million) By Applications (2018-2022)
Table 19 Europe Router Revenue (USD Million) By Country (2018-2022)
Table 20 Europe Router Revenue (USD Million) By Type (2018-2022)
Table 21 Europe Router Revenue (USD Million) By Applications (2018-2022)
Table 22 Asia Pacific Router Revenue (USD Million) By Country (2018-2022)
Table 23 Asia Pacific Router Revenue (USD Million) By Type (2018-2022)
Table 24 Asia Pacific Router Revenue (USD Million) By Applications (2018-2022)
Table 25 South America Router Revenue (USD Million) By Country (2018-2022)
Table 26 South America Router Revenue (USD Million) By Type (2018-2022)
Table 27 South America Router Revenue (USD Million) By Applications (2018-2022)
Table 28 Middle East and Africa Router Revenue (USD Million) By Region (2018-2022)
Table 29 Middle East and Africa Router Revenue (USD Million) By Type (2018-2022)
Table 30 Middle East and Africa Router Revenue (USD Million) By Applications (2018-2022)
Table 31 Financial Analysis
Table 32 Global Router Revenue (USD Million) By Type (2023-2030)
Table 33 Global Router Revenue Market Share (%) By Type (2023-2030)
Table 34 Global Router Revenue (USD Million) By Applications (2023-2030)
Table 35 Global Router Revenue Market Share (%) By Applications (2023-2030)
Table 36 Global Router Market Revenue (USD Million), And Revenue (USD Million) By Regions (2023-2030)
Table 37 North America Router Revenue (USD)By Country (2023-2030)
Table 38 North America Router Revenue (USD Million) By Type (2023-2030)
Table 39 North America Router Revenue (USD Million) By Applications (2023-2030)
Table 40 Europe Router Revenue (USD Million) By Country (2023-2030)
Table 41 Europe Router Revenue (USD Million) By Type (2023-2030)
Table 42 Europe Router Revenue (USD Million) By Applications (2023-2030)
Table 43 Asia Pacific Router Revenue (USD Million) By Country (2023-2030)
Table 44 Asia Pacific Router Revenue (USD Million) By Type (2023-2030)
Table 45 Asia Pacific Router Revenue (USD Million) By Applications (2023-2030)
Table 46 South America Router Revenue (USD Million) By Country (2023-2030)
Table 47 South America Router Revenue (USD Million) By Type (2023-2030)
Table 48 South America Router Revenue (USD Million) By Applications (2023-2030)
Table 49 Middle East and Africa Router Revenue (USD Million) By Region (2023-2030)
Table 50 Middle East and Africa Router Revenue (USD Million) By Region (2023-2030)
Table 51 Middle East and Africa Router Revenue (USD Million) By Type (2023-2030)
Table 52 Middle East and Africa Router Revenue (USD Million) By Applications (2023-2030)
Table 53 Research Programs/Design for This Report
Table 54 Key Data Information from Secondary Sources
Table 55 Key Data Information from Primary Sources
List of Figures
Figure 1 Market Scope
Figure 2 Porter’s Five Forces
Figure 3 Global Router Revenue (USD Million) By Type (2018-2022)
Figure 4 Global Router Revenue Market Share (%) By Type (2022)
Figure 5 Global Router Revenue (USD Million) By Applications (2018-2022)
Figure 6 Global Router Revenue Market Share (%) By Applications (2022)
Figure 7 Global Router Market Revenue (USD Million) By Regions (2018-2022)
Figure 8 Global Router Market Share (%) By Regions (2022)
Figure 9 North America Router Revenue (USD Million) By Country (2018-2022)
Figure 10 North America Router Revenue (USD Million) By Type (2018-2022)
Figure 11 North America Router Revenue (USD Million) By Applications (2018-2022)
Figure 12 Europe Router Revenue (USD Million) By Country (2018-2022)
Figure 13 Europe Router Revenue (USD Million) By Type (2018-2022)
Figure 14 Europe Router Revenue (USD Million) By Applications (2018-2022)
Figure 15 Asia Pacific Router Revenue (USD Million) By Country (2018-2022)
Figure 16 Asia Pacific Router Revenue (USD Million) By Type (2018-2022)
Figure 17 Asia Pacific Router Revenue (USD Million) By Applications (2018-2022)
Figure 18 South America Router Revenue (USD Million) By Country (2018-2022)
Figure 19 South America Router Revenue (USD Million) By Type (2018-2022)
Figure 20 South America Router Revenue (USD Million) By Applications (2018-2022)
Figure 21 Middle East and Africa Router Revenue (USD Million) By Region (2018-2022)
Figure 22 Middle East and Africa Router Revenue (USD Million) By Type (2018-2022)
Figure 23 Middle East and Africa Router Revenue (USD Million) By Applications (2018-2022)
Figure 24 Global Router Revenue (USD Million) By Type (2023-2030)
Figure 25 Global Router Revenue Market Share (%) By Type (2030)
Figure 26 Global Router Revenue (USD Million) By Applications (2023-2030)
Figure 27 Global Router Revenue Market Share (%) By Applications (2030)
Figure 28 Global Router Market Revenue (USD Million) By Regions (2023-2030)
Figure 29 North America Router Revenue (USD Million) By Country (2023-2030)
Figure 30 North America Router Revenue (USD Million) By Type (2023-2030)
Figure 31 North America Router Revenue (USD Million) By Applications (2023-2030)
Figure 32 Europe Router Revenue (USD Million) By Country (2023-2030)
Figure 33 Europe Router Revenue (USD Million) By Type (2023-2030)
Figure 34 Europe Router Revenue (USD Million) By Applications (2023-2030)
Figure 35 Asia Pacific Router Revenue (USD Million) By Country (2023-2030)
Figure 36 Asia Pacific Router Revenue (USD Million) By Type (2023-2030)
Figure 37 Asia Pacific Router Revenue (USD Million) By Applications (2023-2030)
Figure 38 South America Router Revenue (USD Million) By Country (2023-2030)
Figure 39 South America Router Revenue (USD Million) By Type (2023-2030)
Figure 40 South America Router Revenue (USD Million) By Applications (2023-2030)
Figure 41 Middle East and Africa Router Revenue (USD Million) By Region (2023-2030)
Figure 42 Middle East and Africa Router Revenue (USD Million) By Region (2023-2030)
Figure 43 Middle East and Africa Router Revenue (USD Million) By Type (2023-2030)
Figure 44 Middle East and Africa Router Revenue (USD Million) By Applications (2023-2030)
Figure 45 Bottom-Up and Top-Down Approaches For This Report
Figure 46 Data Triangulation
