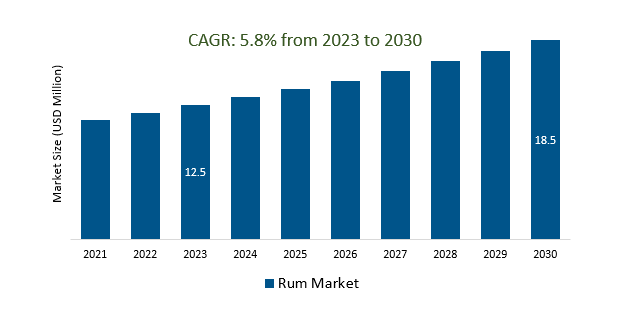
The Global Rum Market Size is estimated to be US 12.5 billion in 2023 and is poised to register 5.8% growth over the forecast period from 2023 to 2030 to reach US $ 18.5 billion in 2030.
The market growth is driven by the increasing Consumers who are willing to pay more for high-quality and premium rums. Craft and aged rums, in particular, have gained popularity as consumers seek unique and flavorful options. Leading Companies that are focusing on Premiumization and Craft Rums, Flavored and Innovative Varieties, Health and Wellness, Aging Population, Cultural and Seasonal Events, and others to boost market shares in the industry.
Market Overview
The global rum market was experiencing moderate growth, driven by premiumization, cocktail culture, and a rising interest in craft and flavored rums. Key segments included premium and aged rums, flavored varieties, and traditional mixing rums. Major trends encompassed craft distilleries, cocktail culture, sustainability, flavor innovation, and the growth of online sales. Major players included Bacardi, Diageo, and Pernod Ricard. Challenges included competition from other spirits and regulatory issues, while the future outlook highlighted premiumization, sustainability, and continued growth in cocktail culture as influential factors shaping the market's trajectory. For the latest information, consult up-to-date sources.
Market Dynamics
Market Trends - Rum is the quintessential spirit of cocktail culture, with its versatility and flavor profile making it ideal for a wide variety of drinks
Rum, with its rich history and diverse range of styles, is the quintessential spirit for cocktails. It originates from sugarcane, goes through fermentation and distillation, resulting in light, dark, and aged varieties, each with its own unique flavor profile. From the smooth light rums perfect for mixed drinks to the complex aged rums ideal for sipping, rum offers versatility that's unmatched in the world of spirits. Its connection to seafaring history and its role in tiki culture make it a symbol of celebration and relaxation, enjoyed in various cocktails globally, making it an essential and beloved spirit for any occasion.
Market Driver- Cultural influences from around the world are driving demand for rum, as consumers seek out authentic and flavorful experiences.
Cultural influences from around the world are fueling a growing demand for rum, as consumers seek authentic and flavorful experiences. This trend is driven by the historical significance of rum in regions like the Caribbean and South America, its prominent role in the global cocktail culture, the fusion of culinary traditions, the rise of craft distilleries emphasizing authenticity, globalization exposing consumers to new flavors, effective marketing using cultural storytelling, the diversity of rum styles, and a growing emphasis on sustainability and ethics in production practices.
Market Opportunity- Rum tourism is a growing trend, as consumers seek out immersive experiences that allow them to learn about and enjoy the world of rum.
Rum tourism is a burgeoning trend where travelers seek immersive experiences to learn about and enjoy rum. This trend is driven by the desire to explore the cultural and educational aspects of rum-making, including distillery tours and tastings. It also offers opportunities to sample diverse rum varieties and connect with the authenticity of local producers in picturesque settings. Sustainability, cocktail culture, and the quest for authentic, unique experiences contribute to the popularity of rum tourism, making it an increasingly sought-after travel option.
The Global Rum Market is analyzed across Dark Golden Rum, White Rum, Flavored and Spiced Rum, and others. Dark and Golden Rum is poised to register the fastest growth. Dark and golden rum segments are significant in the rum market, with dark rum offering rich, aged flavors and association with places like Jamaica, and golden rum providing a lighter alternative, typically aged for shorter periods and originating from regions like Puerto Rico. These variations cater to diverse consumer preferences and cocktail applications, contributing to the rum market's diversity and growth.
Market Share Analysis- On Trade held a significant market share in 2023
The Global Rum Market is analyzed across various Distribution channels including Off-Trade, On-Trade, and others. Of these, On Trade held a significant market share in 2023.
The on-trade segment in the rum market pertains to the distribution and consumption of rum in bars, restaurants, and other hospitality settings. It is crucial for sales, brand recognition, and cocktail creation, with factors like cocktail quality and consumer preferences playing a significant role in its growth and competitiveness.
Rum Market Segmentation
By Type
- Dark and Golden Rum
- White Rum
- Flavored and Spiced Rum
- Others
By Distribution Channel
By Category
By Region
- North America (United States, Canada, Mexico)
- Europe (Germany, France, United Kingdom, Spain, Italy, Others)
- Asia Pacific (China, India, Japan, South Korea, Australia, Others)
- Latin America (Brazil, Argentina, Others)
- Middle East and Africa (Saudi Arabia, UAE, Kuwait, Other Middle East, South Africa, Nigeria, Other Africa)
Rum Market Companies
·Davide Campari-Milano Spa
- Demerara Distillers Ltd
- Bacardi Ltd
- Diageo Plc
- LT Group Inc
- Nova Scotia Spirit Co
- Mohan Meakin Ltd
- Suntory Holdings Ltd
- William Grant & Sons Ltd
- Pernod Ricard SA
*List not exhaustive
Rum Market Outlook 2023
1 Market Overview
1.1 Introduction to the Rum Market
1.2 Scope of the Study
1.3 Research Objective
1.3.1 Key Market Scope and Segments
1.3.2 Players Covered
1.3.3 Years Considered
2 Executive Summary
2.1 2023 Rum Industry- Market Statistics
3 Market Dynamics
3.1 Market Drivers
3.2 Market Challenges
3.3 Market Opportunities
3.4 Market Trends
4 Market Factor Analysis
4.1 Porter’s Five Forces
4.2 Market Entropy
4.2.1 Global Rum Market Companies with Area Served
4.2.2 Products Offerings Global Rum Market
5 COVID-19 Impact Analysis and Outlook Scenarios
5.1.1 Covid-19 Impact Analysis
5.1.2 post-COVID-19 Scenario- Low Growth Case
5.1.3 post-COVID-19 Scenario- Reference Growth Case
5.1.4 post-COVID-19 Scenario- Low Growth Case
6 Global Rum Market Trends
6.1 Global Rum Revenue (USD Million) and CAGR (%) by Type (2018-2030)
6.2 Global Rum Revenue (USD Million) and CAGR (%) by Applications (2018-2030)
6.3 Global Rum Revenue (USD Million) and CAGR (%) by regions (2018-2030)
7 Global Rum Market Revenue (USD Million) by Type, and Applications (2018-2022)
7.1 Global Rum Revenue (USD Million) by Type (2018-2022)
7.1.1 Global Rum Revenue (USD Million), Market Share (%) by Type (2018-2022)
7.2 Global Rum Revenue (USD Million) by Applications (2018-2022)
7.2.1 Global Rum Revenue (USD Million), Market Share (%) by Applications (2018-2022)
8 Global Rum Development Regional Status and Outlook
8.1 Global Rum Revenue (USD Million) By Regions (2018-2022)
8.2 North America Rum Revenue (USD Million) by Type, and Application (2018-2022)
8.2.1 North America Rum Revenue (USD Million) by Country (2018-2022)
8.2.2 North America Rum Revenue (USD Million) by Type (2018-2022)
8.2.3 North America Rum Revenue (USD Million) by Applications (2018-2022)
8.3 Europe Rum Revenue (USD Million), by Type, and Applications (USD Million) (2018-2022)
8.3.1 Europe Rum Revenue (USD Million), by Country (2018-2022)
8.3.2 Europe Rum Revenue (USD Million) by Type (2018-2022)
8.3.3 Europe Rum Revenue (USD Million) by Applications (2018-2022)
8.4 Asia Pacific Rum Revenue (USD Million), and Revenue (USD Million) by Type, and Applications (2018-2022)
8.4.1 Asia Pacific Rum Revenue (USD Million) by Country (2018-2022)
8.4.2 Asia Pacific Rum Revenue (USD Million) by Type (2018-2022)
8.4.3 Asia Pacific Rum Revenue (USD Million) by Applications (2018-2022)
8.5 South America Rum Revenue (USD Million), by Type, and Applications (2018-2022)
8.5.1 South America Rum Revenue (USD Million), by Country (2018-2022)
8.5.2 South America Rum Revenue (USD Million) by Type (2018-2022)
8.5.3 South America Rum Revenue (USD Million) by Applications (2018-2022)
8.6 Middle East and Africa Rum Revenue (USD Million), by Type, Technology, Application, Thickness (2018-2022)
8.6.1 Middle East and Africa Rum Revenue (USD Million) by Country (2018-2022)
8.6.2 Middle East and Africa Rum Revenue (USD Million) by Type (2018-2022)
8.6.3 Middle East and Africa Rum Revenue (USD Million) by Applications (2018-2022)
9 Company Profiles
10 Global Rum Market Revenue (USD Million), by Type, and Applications (2023-2030)
10.1 Global Rum Revenue (USD Million) and Market Share (%) by Type (2023-2030)
10.1.1 Global Rum Revenue (USD Million), and Market Share (%) by Type (2023-2030)
10.2 Global Rum Revenue (USD Million) and Market Share (%) by Applications (2023-2030)
10.2.1 Global Rum Revenue (USD Million), and Market Share (%) by Applications (2023-2030)
11 Global Rum Development Regional Status and Outlook Forecast
11.1 Global Rum Revenue (USD Million) By Regions (2023-2030)
11.2 North America Rum Revenue (USD Million) by Type, and Applications (2023-2030)
11.2.1 North America Rum Revenue (USD) Million by Country (2023-2030)
11.2.2 North America Rum Revenue (USD Million), by Type (2023-2030)
11.2.3 North America Rum Revenue (USD Million), Market Share (%) by Applications (2023-2030)
11.3 Europe Rum Revenue (USD Million), by Type, and Applications (2023-2030)
11.3.1 Europe Rum Revenue (USD Million), by Country (2023-2030)
11.3.2 Europe Rum Revenue (USD Million), by Type (2023-2030)
11.3.3 Europe Rum Revenue (USD Million), by Applications (2023-2030)
11.4 Asia Pacific Rum Revenue (USD Million) by Type, and Applications (2023-2030)
11.4.1 Asia Pacific Rum Revenue (USD Million), by Country (2023-2030)
11.4.2 Asia Pacific Rum Revenue (USD Million), by Type (2023-2030)
11.4.3 Asia Pacific Rum Revenue (USD Million), by Applications (2023-2030)
11.5 South America Rum Revenue (USD Million), by Type, and Applications (2023-2030)
11.5.1 South America Rum Revenue (USD Million), by Country (2023-2030)
11.5.2 South America Rum Revenue (USD Million), by Type (2023-2030)
11.5.3 South America Rum Revenue (USD Million), by Applications (2023-2030)
11.6 Middle East and Africa Rum Revenue (USD Million), by Type, and Applications (2023-2030)
11.6.1 Middle East and Africa Rum Revenue (USD Million), by region (2023-2030)
11.6.2 Middle East and Africa Rum Revenue (USD Million), by Type (2023-2030)
11.6.3 Middle East and Africa Rum Revenue (USD Million), by Applications (2023-2030)
12 Methodology and Data Sources
12.1 Methodology/Research Approach
12.1.1 Research Programs/Design
12.1.2 Market Size Estimation
12.1.3 Market Breakdown and Data Triangulation
12.2 Data Sources
12.2.1 Secondary Sources
12.2.2 Primary Sources
12.3 Disclaimer
List of Tables
Table 1 Market Segmentation Analysis
Table 2 Global Rum Market Companies with Areas Served
Table 3 Products Offerings Global Rum Market
Table 4 Low Growth Scenario Forecasts
Table 5 Reference Case Growth Scenario
Table 6 High Growth Case Scenario
Table 7 Global Rum Revenue (USD Million) And CAGR (%) By Type (2018-2030)
Table 8 Global Rum Revenue (USD Million) And CAGR (%) By Applications (2018-2030)
Table 9 Global Rum Revenue (USD Million) And CAGR (%) By Regions (2018-2030)
Table 10 Global Rum Revenue (USD Million) By Type (2018-2022)
Table 11 Global Rum Revenue Market Share (%) By Type (2018-2022)
Table 12 Global Rum Revenue (USD Million) By Applications (2018-2022)
Table 13 Global Rum Revenue Market Share (%) By Applications (2018-2022)
Table 14 Global Rum Market Revenue (USD Million) By Regions (2018-2022)
Table 15 Global Rum Market Share (%) By Regions (2018-2022)
Table 16 North America Rum Revenue (USD Million) By Country (2018-2022)
Table 17 North America Rum Revenue (USD Million) By Type (2018-2022)
Table 18 North America Rum Revenue (USD Million) By Applications (2018-2022)
Table 19 Europe Rum Revenue (USD Million) By Country (2018-2022)
Table 20 Europe Rum Revenue (USD Million) By Type (2018-2022)
Table 21 Europe Rum Revenue (USD Million) By Applications (2018-2022)
Table 22 Asia Pacific Rum Revenue (USD Million) By Country (2018-2022)
Table 23 Asia Pacific Rum Revenue (USD Million) By Type (2018-2022)
Table 24 Asia Pacific Rum Revenue (USD Million) By Applications (2018-2022)
Table 25 South America Rum Revenue (USD Million) By Country (2018-2022)
Table 26 South America Rum Revenue (USD Million) By Type (2018-2022)
Table 27 South America Rum Revenue (USD Million) By Applications (2018-2022)
Table 28 Middle East and Africa Rum Revenue (USD Million) By Region (2018-2022)
Table 29 Middle East and Africa Rum Revenue (USD Million) By Type (2018-2022)
Table 30 Middle East and Africa Rum Revenue (USD Million) By Applications (2018-2022)
Table 31 Financial Analysis
Table 32 Global Rum Revenue (USD Million) By Type (2023-2030)
Table 33 Global Rum Revenue Market Share (%) By Type (2023-2030)
Table 34 Global Rum Revenue (USD Million) By Applications (2023-2030)
Table 35 Global Rum Revenue Market Share (%) By Applications (2023-2030)
Table 36 Global Rum Market Revenue (USD Million), And Revenue (USD Million) By Regions (2023-2030)
Table 37 North America Rum Revenue (USD)By Country (2023-2030)
Table 38 North America Rum Revenue (USD Million) By Type (2023-2030)
Table 39 North America Rum Revenue (USD Million) By Applications (2023-2030)
Table 40 Europe Rum Revenue (USD Million) By Country (2023-2030)
Table 41 Europe Rum Revenue (USD Million) By Type (2023-2030)
Table 42 Europe Rum Revenue (USD Million) By Applications (2023-2030)
Table 43 Asia Pacific Rum Revenue (USD Million) By Country (2023-2030)
Table 44 Asia Pacific Rum Revenue (USD Million) By Type (2023-2030)
Table 45 Asia Pacific Rum Revenue (USD Million) By Applications (2023-2030)
Table 46 South America Rum Revenue (USD Million) By Country (2023-2030)
Table 47 South America Rum Revenue (USD Million) By Type (2023-2030)
Table 48 South America Rum Revenue (USD Million) By Applications (2023-2030)
Table 49 Middle East and Africa Rum Revenue (USD Million) By Region (2023-2030)
Table 50 Middle East and Africa Rum Revenue (USD Million) By Region (2023-2030)
Table 51 Middle East and Africa Rum Revenue (USD Million) By Type (2023-2030)
Table 52 Middle East and Africa Rum Revenue (USD Million) By Applications (2023-2030)
Table 53 Research Programs/Design for This Report
Table 54 Key Data Information from Secondary Sources
Table 55 Key Data Information from Primary Sources
List of Figures
Figure 1 Market Scope
Figure 2 Porter’s Five Forces
Figure 3 Global Rum Revenue (USD Million) By Type (2018-2022)
Figure 4 Global Rum Revenue Market Share (%) By Type (2022)
Figure 5 Global Rum Revenue (USD Million) By Applications (2018-2022)
Figure 6 Global Rum Revenue Market Share (%) By Applications (2022)
Figure 7 Global Rum Market Revenue (USD Million) By Regions (2018-2022)
Figure 8 Global Rum Market Share (%) By Regions (2022)
Figure 9 North America Rum Revenue (USD Million) By Country (2018-2022)
Figure 10 North America Rum Revenue (USD Million) By Type (2018-2022)
Figure 11 North America Rum Revenue (USD Million) By Applications (2018-2022)
Figure 12 Europe Rum Revenue (USD Million) By Country (2018-2022)
Figure 13 Europe Rum Revenue (USD Million) By Type (2018-2022)
Figure 14 Europe Rum Revenue (USD Million) By Applications (2018-2022)
Figure 15 Asia Pacific Rum Revenue (USD Million) By Country (2018-2022)
Figure 16 Asia Pacific Rum Revenue (USD Million) By Type (2018-2022)
Figure 17 Asia Pacific Rum Revenue (USD Million) By Applications (2018-2022)
Figure 18 South America Rum Revenue (USD Million) By Country (2018-2022)
Figure 19 South America Rum Revenue (USD Million) By Type (2018-2022)
Figure 20 South America Rum Revenue (USD Million) By Applications (2018-2022)
Figure 21 Middle East and Africa Rum Revenue (USD Million) By Region (2018-2022)
Figure 22 Middle East and Africa Rum Revenue (USD Million) By Type (2018-2022)
Figure 23 Middle East and Africa Rum Revenue (USD Million) By Applications (2018-2022)
Figure 24 Global Rum Revenue (USD Million) By Type (2023-2030)
Figure 25 Global Rum Revenue Market Share (%) By Type (2030)
Figure 26 Global Rum Revenue (USD Million) By Applications (2023-2030)
Figure 27 Global Rum Revenue Market Share (%) By Applications (2030)
Figure 28 Global Rum Market Revenue (USD Million) By Regions (2023-2030)
Figure 29 North America Rum Revenue (USD Million) By Country (2023-2030)
Figure 30 North America Rum Revenue (USD Million) By Type (2023-2030)
Figure 31 North America Rum Revenue (USD Million) By Applications (2023-2030)
Figure 32 Europe Rum Revenue (USD Million) By Country (2023-2030)
Figure 33 Europe Rum Revenue (USD Million) By Type (2023-2030)
Figure 34 Europe Rum Revenue (USD Million) By Applications (2023-2030)
Figure 35 Asia Pacific Rum Revenue (USD Million) By Country (2023-2030)
Figure 36 Asia Pacific Rum Revenue (USD Million) By Type (2023-2030)
Figure 37 Asia Pacific Rum Revenue (USD Million) By Applications (2023-2030)
Figure 38 South America Rum Revenue (USD Million) By Country (2023-2030)
Figure 39 South America Rum Revenue (USD Million) By Type (2023-2030)
Figure 40 South America Rum Revenue (USD Million) By Applications (2023-2030)
Figure 41 Middle East and Africa Rum Revenue (USD Million) By Region (2023-2030)
Figure 42 Middle East and Africa Rum Revenue (USD Million) By Region (2023-2030)
Figure 43 Middle East and Africa Rum Revenue (USD Million) By Type (2023-2030)
Figure 44 Middle East and Africa Rum Revenue (USD Million) By Applications (2023-2030)
Figure 45 Bottom-Up and Top-Down Approaches for This Report
Figure 46 Data Triangulation
