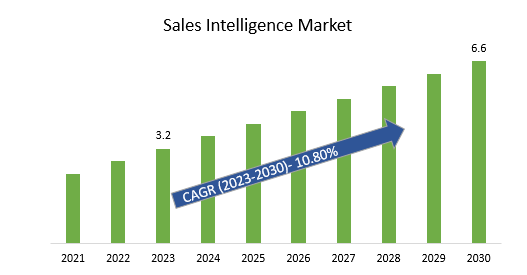
The global Sales Intelligence Market Size is estimated to be US$ 3.2 Billion in 2023 and is poised to register 10.8% growth over the forecast period from 2023 to 2030.
The market growth is increased by Sales intelligence tools that enable businesses to gather deep insights into customer behavior and preferences, personalized sales strategies, and enhanced customer experiences and it supports ABM by providing information about target accounts, decision-makers, and relevant contacts, helping sales teams tailor their approach to specific accounts.
Leading key market players are investing Hyper-Personalization, Enhanced Data Enrichment, and Quality, Predictive Lead Scoring, Blockchain for Data Security, Global Market Expansion, and others to boost market shares in the industry.
Market Overview
The market is increasing the need for advanced software to improve customer targeting and growing demand for data enrichment software to improve sales the market is driven by the increasing need for businesses to improve their customer targeting and connect rates, as well as the growing demand for data enrichment software and cloud-based sales intelligence solutions is increasing solutions among businesses of all sizes.
Market Dynamics
Market Trends: - Companies are launching Real-time Data Integration to attract a consumer base:
Real-time data integration of current information into business intelligence systems, allowing sales teams to access up-to-date information on customer behavior, market dynamics, and trends. The Sales Intelligence market has integrated data that provide instant updates, giving sales professionals the ability to respond quickly and effectively to changing business needs and customer interactions. This demand for the adoption of real-time data integration solutions allows sales teams to the power of up-to-the-moment information.
Market Driver: Account-Based Marketing (ABM) Adoption market drives outlook
ABM is a strategic approach to marketing and sales that focuses on identifying and targeting specific high-value accounts rather than casting a wide net. ABM relies heavily on accurate and up-to-date information about target accounts. As a result, businesses adopting ABM strategies are likely to place a higher emphasis on the quality and accuracy of data within their sales intelligence tools. This will drive the demand for reliable sources of data, including firmographic, technographic, and contact information.
Integration of Sales and Marketing Tools within sales intelligence drives the need for integrated platforms that provide seamless communication, data sharing, and coordinated efforts between these two functions.
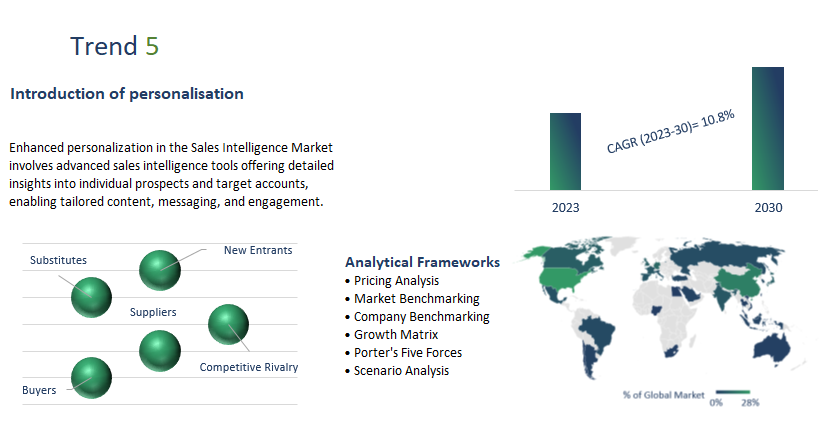
Market Opportunity: Introduction of Personalization:
Enhanced personalization in the Sales Intelligence Market involves advanced sales intelligence tools offering detailed insights into individual prospects and target accounts, enabling tailored content, messaging, and engagement. This encompasses comprehensive buyer personas, account-level context, granular contact information, predictive analytics, dynamic email campaigns, real-time engagement tracking, and integration with CRM and marketing automation for seamless personalization across channels.
Market Segmentation
Software: The growth potential of Sales Intelligence software is substantial, fueled by the evolving business landscape, advancements in technology, and the increasing demand for data-driven decision-making. As businesses recognize the importance of informed decision-making, the demand for data-driven insights is soaring. Sales Intelligence software offers the means to gather, analyze, and interpret data from various sources, empowering companies to make strategic choices based on accurate and timely information.
Sales Intelligence software provides the tools needed to segment audiences, tailor messages, and create personalized experiences, thereby enhancing customer engagement and conversion rates. Further, the integration of AI and advanced analytics within Sales Intelligence software enhances its capabilities.
Large Enterprises
Sales Intelligence aggregates and analyzes large data in these enterprises to provide actionable insights. Sales and marketing teams can use these insights to refine strategies, identify trends, and align their efforts with customer preferences and market demands.
Further, sales Intelligence aids in identifying high-potential leads and prospects through data enrichment, firmographic analysis, and technographic insights. Sales Intelligence enables personalized communication by providing information about customer behaviors, preferences, and engagement history.
Sales Intelligence tools also integrate with CRM systems and marketing automation platforms, fostering seamless collaboration between sales, marketing, and customer support teams.
Lead Management
Sales intelligence is vital in lead management as it provides detailed information about leads, enabling personalized engagement, timely follow-ups, and efficient prioritization. It empowers sales teams to make data-driven decisions, tailor sales pitches, and predict conversions. Through effective lead nurturing and personalized approaches, sales intelligence improves customer relationships and identifies cross-selling opportunities, resulting in more successful lead conversions and long-term business growth.
Segmentation
By Component
By Deployment Model
By Enterprise Size
By Application
- Lead Management
- Data Management
- Analytics & Reporting
- Others
By Industry Verticals
- BFSI
- IT & Telecom
- Retail & E-Commerce
- Healthcare
- Media & Entertainment
- Others
By Region
- North America (United States, Canada, Mexico)
- Europe (Germany, France, United Kingdom, Spain, Italy, Others)
- Asia Pacific (China, India, Japan, South Korea, Australia, Others)
- Latin America (Brazil, Argentina, Others)
- Middle East and Africa (Saudi Arabia, UAE, Kuwait, Other Middle East, South Africa, Nigeria, Other Africa)
Key Players
Leading companies profiled in the study include-
- LinkedIn
- Oracle
- Dun & Bradstreet
- Infogroup
- Demandbase
- InsideView
- Clearbit
- EverString
- HG Insights
- DiscoverOrg
- LeadGenius
- UpLead
- RelPro
- DueDil
- Yesware
- RingLead
- List Partners
- FullContact
- Zoho
- Gryphon Networks
Sales Intelligence Systems Market Outlook 2023
1 Market Overview
1.1 Introduction to Sales Intelligence Systems Market
1.2 Scope of the Study
1.3 Research Objective
1.3.1 Key Market Scope and Segments
1.3.2 Players Covered
1.3.3 Years Considered
2 Executive Summary
2.1 2023 Sales Intelligence Systems Industry- Market Statistics
3 Market Dynamics
3.1 Market Drivers
3.2 Market Challenges
3.3 Market Opportunities
3.4 Market Trends
4 Market Factor Analysis
4.1 Porter’s Five Forces
4.2 Market Entropy
4.2.1 Global Sales Intelligence Systems Market Companies with Area Served
4.2.2 Products Offerings Global Sales Intelligence Systems Market
5 COVID-19 Impact Analysis and Outlook Scenarios
5.1.1 Covid-19 Impact Analysis
5.1.2 Post-COVID-19 Scenario- Low Growth Case
5.1.3 Post-COVID-19 Scenario- Reference Growth Case
5.1.4 Post-COVID-19 Scenario- Low Growth Case
6 Global Sales Intelligence Systems Market Trends
6.1 Global Sales Intelligence Systems Revenue (USD Million) and CAGR (%) by Type (2018-2030)
6.2 Global Sales Intelligence Systems Revenue (USD Million) and CAGR (%) by Applications (2018-2030)
6.3 Global Sales Intelligence Systems Revenue (USD Million) and CAGR (%) by Regions (2018-2030)
7 Global Sales Intelligence Systems Market Revenue (USD Million) by Type, and Applications (2018-2022)
7.1 Global Sales Intelligence Systems Revenue (USD Million) by Type (2018-2022)
7.1.1 Global Sales Intelligence Systems Revenue (USD Million), Market Share (%) by Type (2018-2022)
7.2 Global Sales Intelligence Systems Revenue (USD Million) by Applications (2018-2022)
7.2.1 Global Sales Intelligence Systems Revenue (USD Million), Market Share (%) by Applications (2018-2022)
8 Global Sales Intelligence Systems Development Regional Status and Outlook
8.1 Global Sales Intelligence Systems Revenue (USD Million) By Regions (2018-2022)
8.2 North America Sales Intelligence Systems Revenue (USD Million) by Type, and Application (2018-2022)
8.2.1 North America Sales Intelligence Systems Revenue (USD Million) by Country (2018-2022)
8.2.2 North America Sales Intelligence Systems Revenue (USD Million) by Type (2018-2022)
8.2.3 North America Sales Intelligence Systems Revenue (USD Million) by Applications (2018-2022)
8.3 Europe Sales Intelligence Systems Revenue (USD Million), by Type, and Applications (USD Million) (2018-2022)
8.3.1 Europe Sales Intelligence Systems Revenue (USD Million), by Country (2018-2022)
8.3.2 Europe Sales Intelligence Systems Revenue (USD Million) by Type (2018-2022)
8.3.3 Europe Sales Intelligence Systems Revenue (USD Million) by Applications (2018-2022)
8.4 Asia Pacific Sales Intelligence Systems Revenue (USD Million), and Revenue (USD Million) by Type, and Applications (2018-2022)
8.4.1 Asia Pacific Sales Intelligence Systems Revenue (USD Million) by Country (2018-2022)
8.4.2 Asia Pacific Sales Intelligence Systems Revenue (USD Million) by Type (2018-2022)
8.4.3 Asia Pacific Sales Intelligence Systems Revenue (USD Million) by Applications (2018-2022)
8.5 South America Sales Intelligence Systems Revenue (USD Million), by Type, and Applications (2018-2022)
8.5.1 South America Sales Intelligence Systems Revenue (USD Million), by Country (2018-2022)
8.5.2 South America Sales Intelligence Systems Revenue (USD Million) by Type (2018-2022)
8.5.3 South America Sales Intelligence Systems Revenue (USD Million) by Applications (2018-2022)
8.6 Middle East and Africa Sales Intelligence Systems Revenue (USD Million), by Type, Technology, Application, Thickness (2018-2022)
8.6.1 Middle East and Africa Sales Intelligence Systems Revenue (USD Million) by Country (2018-2022)
8.6.2 Middle East and Africa Sales Intelligence Systems Revenue (USD Million) by Type (2018-2022)
8.6.3 Middle East and Africa Sales Intelligence Systems Revenue (USD Million) by Applications (2018-2022)
9 Company Profiles
10 Global Sales Intelligence Systems Market Revenue (USD Million), by Type, and Applications (2023-2030)
10.1 Global Sales Intelligence Systems Revenue (USD Million) and Market Share (%) by Type (2023-2030)
10.1.1 Global Sales Intelligence Systems Revenue (USD Million), and Market Share (%) by Type (2023-2030)
10.2 Global Sales Intelligence Systems Revenue (USD Million) and Market Share (%) by Applications (2023-2030)
10.2.1 Global Sales Intelligence Systems Revenue (USD Million), and Market Share (%) by Applications (2023-2030)
11 Global Sales Intelligence Systems Development Regional Status and Outlook Forecast
11.1 Global Sales Intelligence Systems Revenue (USD Million) By Regions (2023-2030)
11.2 North America Sales Intelligence Systems Revenue (USD Million) by Type, and Applications (2023-2030)
11.2.1 North America Sales Intelligence Systems Revenue (USD) Million by Country (2023-2030)
11.2.2 North America Sales Intelligence Systems Revenue (USD Million), by Type (2023-2030)
11.2.3 North America Sales Intelligence Systems Revenue (USD Million), Market Share (%) by Applications (2023-2030)
11.3 Europe Sales Intelligence Systems Revenue (USD Million), by Type, and Applications (2023-2030)
11.3.1 Europe Sales Intelligence Systems Revenue (USD Million), by Country (2023-2030)
11.3.2 Europe Sales Intelligence Systems Revenue (USD Million), by Type (2023-2030)
11.3.3 Europe Sales Intelligence Systems Revenue (USD Million), by Applications (2023-2030)
11.4 Asia Pacific Sales Intelligence Systems Revenue (USD Million) by Type, and Applications (2023-2030)
11.4.1 Asia Pacific Sales Intelligence Systems Revenue (USD Million), by Country (2023-2030)
11.4.2 Asia Pacific Sales Intelligence Systems Revenue (USD Million), by Type (2023-2030)
11.4.3 Asia Pacific Sales Intelligence Systems Revenue (USD Million), by Applications (2023-2030)
11.5 South America Sales Intelligence Systems Revenue (USD Million), by Type, and Applications (2023-2030)
11.5.1 South America Sales Intelligence Systems Revenue (USD Million), by Country (2023-2030)
11.5.2 South America Sales Intelligence Systems Revenue (USD Million), by Type (2023-2030)
11.5.3 South America Sales Intelligence Systems Revenue (USD Million), by Applications (2023-2030)
11.6 Middle East and Africa Sales Intelligence Systems Revenue (USD Million), by Type, and Applications (2023-2030)
11.6.1 Middle East and Africa Sales Intelligence Systems Revenue (USD Million), by Region (2023-2030)
11.6.2 Middle East and Africa Sales Intelligence Systems Revenue (USD Million), by Type (2023-2030)
11.6.3 Middle East and Africa Sales Intelligence Systems Revenue (USD Million), by Applications (2023-2030)
12 Methodology and Data Sources
12.1 Methodology/Research Approach
12.1.1 Research Programs/Design
12.1.2 Market Size Estimation
12.1.3 Market Breakdown and Data Triangulation
12.2 Data Sources
12.2.1 Secondary Sources
12.2.2 Primary Sources
12.3 Disclaimer
List Of Tables
Table 1 Market Segmentation Analysis
Table 2 Global Sales Intelligence Systems Market Companies with Areas Served
Table 3 Products Offerings Global Sales Intelligence Systems Market
Table 4 Low Growth Scenario Forecasts
Table 5 Reference Case Growth Scenario
Table 6 High Growth Case Scenario
Table 7 Global Sales Intelligence Systems Revenue (USD Million) And CAGR (%) By Type (2018-2030)
Table 8 Global Sales Intelligence Systems Revenue (USD Million) And CAGR (%) By Applications (2018-2030)
Table 9 Global Sales Intelligence Systems Revenue (USD Million) And CAGR (%) By Regions (2018-2030)
Table 10 Global Sales Intelligence Systems Revenue (USD Million) By Type (2018-2022)
Table 11 Global Sales Intelligence Systems Revenue Market Share (%) By Type (2018-2022)
Table 12 Global Sales Intelligence Systems Revenue (USD Million) By Applications (2018-2022)
Table 13 Global Sales Intelligence Systems Revenue Market Share (%) By Applications (2018-2022)
Table 14 Global Sales Intelligence Systems Market Revenue (USD Million) By Regions (2018-2022)
Table 15 Global Sales Intelligence Systems Market Share (%) By Regions (2018-2022)
Table 16 North America Sales Intelligence Systems Revenue (USD Million) By Country (2018-2022)
Table 17 North America Sales Intelligence Systems Revenue (USD Million) By Type (2018-2022)
Table 18 North America Sales Intelligence Systems Revenue (USD Million) By Applications (2018-2022)
Table 19 Europe Sales Intelligence Systems Revenue (USD Million) By Country (2018-2022)
Table 20 Europe Sales Intelligence Systems Revenue (USD Million) By Type (2018-2022)
Table 21 Europe Sales Intelligence Systems Revenue (USD Million) By Applications (2018-2022)
Table 22 Asia Pacific Sales Intelligence Systems Revenue (USD Million) By Country (2018-2022)
Table 23 Asia Pacific Sales Intelligence Systems Revenue (USD Million) By Type (2018-2022)
Table 24 Asia Pacific Sales Intelligence Systems Revenue (USD Million) By Applications (2018-2022)
Table 25 South America Sales Intelligence Systems Revenue (USD Million) By Country (2018-2022)
Table 26 South America Sales Intelligence Systems Revenue (USD Million) By Type (2018-2022)
Table 27 South America Sales Intelligence Systems Revenue (USD Million) By Applications (2018-2022)
Table 28 Middle East and Africa Sales Intelligence Systems Revenue (USD Million) By Region (2018-2022)
Table 29 Middle East and Africa Sales Intelligence Systems Revenue (USD Million) By Type (2018-2022)
Table 30 Middle East and Africa Sales Intelligence Systems Revenue (USD Million) By Applications (2018-2022)
Table 31 Financial Analysis
Table 32 Global Sales Intelligence Systems Revenue (USD Million) By Type (2023-2030)
Table 33 Global Sales Intelligence Systems Revenue Market Share (%) By Type (2023-2030)
Table 34 Global Sales Intelligence Systems Revenue (USD Million) By Applications (2023-2030)
Table 35 Global Sales Intelligence Systems Revenue Market Share (%) By Applications (2023-2030)
Table 36 Global Sales Intelligence Systems Market Revenue (USD Million), And Revenue (USD Million) By Regions (2023-2030)
Table 37 North America Sales Intelligence Systems Revenue (USD)By Country (2023-2030)
Table 38 North America Sales Intelligence Systems Revenue (USD Million) By Type (2023-2030)
Table 39 North America Sales Intelligence Systems Revenue (USD Million) By Applications (2023-2030)
Table 40 Europe Sales Intelligence Systems Revenue (USD Million) By Country (2023-2030)
Table 41 Europe Sales Intelligence Systems Revenue (USD Million) By Type (2023-2030)
Table 42 Europe Sales Intelligence Systems Revenue (USD Million) By Applications (2023-2030)
Table 43 Asia Pacific Sales Intelligence Systems Revenue (USD Million) By Country (2023-2030)
Table 44 Asia Pacific Sales Intelligence Systems Revenue (USD Million) By Type (2023-2030)
Table 45 Asia Pacific Sales Intelligence Systems Revenue (USD Million) By Applications (2023-2030)
Table 46 South America Sales Intelligence Systems Revenue (USD Million) By Country (2023-2030)
Table 47 South America Sales Intelligence Systems Revenue (USD Million) By Type (2023-2030)
Table 48 South America Sales Intelligence Systems Revenue (USD Million) By Applications (2023-2030)
Table 49 Middle East and Africa Sales Intelligence Systems Revenue (USD Million) By Region (2023-2030)
Table 50 Middle East and Africa Sales Intelligence Systems Revenue (USD Million) By Region (2023-2030)
Table 51 Middle East and Africa Sales Intelligence Systems Revenue (USD Million) By Type (2023-2030)
Table 52 Middle East and Africa Sales Intelligence Systems Revenue (USD Million) By Applications (2023-2030)
Table 53 Research Programs/Design for This Report
Table 54 Key Data Information from Secondary Sources
Table 55 Key Data Information from Primary Sources
List Of Figures
Figure 1 Market Scope
Figure 2 Porter’s Five Forces
Figure 3 Global Sales Intelligence Systems Revenue (USD Million) By Type (2018-2022)
Figure 4 Global Sales Intelligence Systems Revenue Market Share (%) By Type (2022)
Figure 5 Global Sales Intelligence Systems Revenue (USD Million) By Applications (2018-2022)
Figure 6 Global Sales Intelligence Systems Revenue Market Share (%) By Applications (2022)
Figure 7 Global Sales Intelligence Systems Market Revenue (USD Million) By Regions (2018-2022)
Figure 8 Global Sales Intelligence Systems Market Share (%) By Regions (2022)
Figure 9 North America Sales Intelligence Systems Revenue (USD Million) By Country (2018-2022)
Figure 10 North America Sales Intelligence Systems Revenue (USD Million) By Type (2018-2022)
Figure 11 North America Sales Intelligence Systems Revenue (USD Million) By Applications (2018-2022)
Figure 12 Europe Sales Intelligence Systems Revenue (USD Million) By Country (2018-2022)
Figure 13 Europe Sales Intelligence Systems Revenue (USD Million) By Type (2018-2022)
Figure 14 Europe Sales Intelligence Systems Revenue (USD Million) By Applications (2018-2022)
Figure 15 Asia Pacific Sales Intelligence Systems Revenue (USD Million) By Country (2018-2022)
Figure 16 Asia Pacific Sales Intelligence Systems Revenue (USD Million) By Type (2018-2022)
Figure 17 Asia Pacific Sales Intelligence Systems Revenue (USD Million) By Applications (2018-2022)
Figure 18 South America Sales Intelligence Systems Revenue (USD Million) By Country (2018-2022)
Figure 19 South America Sales Intelligence Systems Revenue (USD Million) By Type (2018-2022)
Figure 20 South America Sales Intelligence Systems Revenue (USD Million) By Applications (2018-2022)
Figure 21 Middle East and Africa Sales Intelligence Systems Revenue (USD Million) By Region (2018-2022)
Figure 22 Middle East and Africa Sales Intelligence Systems Revenue (USD Million) By Type (2018-2022)
Figure 23 Middle East and Africa Sales Intelligence Systems Revenue (USD Million) By Applications (2018-2022)
Figure 24 Global Sales Intelligence Systems Revenue (USD Million) By Type (2023-2030)
Figure 25 Global Sales Intelligence Systems Revenue Market Share (%) By Type (2030)
Figure 26 Global Sales Intelligence Systems Revenue (USD Million) By Applications (2023-2030)
Figure 27 Global Sales Intelligence Systems Revenue Market Share (%) By Applications (2030)
Figure 28 Global Sales Intelligence Systems Market Revenue (USD Million) By Regions (2023-2030)
Figure 29 North America Sales Intelligence Systems Revenue (USD Million) By Country (2023-2030)
Figure 30 North America Sales Intelligence Systems Revenue (USD Million) By Type (2023-2030)
Figure 31 North America Sales Intelligence Systems Revenue (USD Million) By Applications (2023-2030)
Figure 32 Europe Sales Intelligence Systems Revenue (USD Million) By Country (2023-2030)
Figure 33 Europe Sales Intelligence Systems Revenue (USD Million) By Type (2023-2030)
Figure 34 Europe Sales Intelligence Systems Revenue (USD Million) By Applications (2023-2030)
Figure 35 Asia Pacific Sales Intelligence Systems Revenue (USD Million) By Country (2023-2030)
Figure 36 Asia Pacific Sales Intelligence Systems Revenue (USD Million) By Type (2023-2030)
Figure 37 Asia Pacific Sales Intelligence Systems Revenue (USD Million) By Applications (2023-2030)
Figure 38 South America Sales Intelligence Systems Revenue (USD Million) By Country (2023-2030)
Figure 39 South America Sales Intelligence Systems Revenue (USD Million) By Type (2023-2030)
Figure 40 South America Sales Intelligence Systems Revenue (USD Million) By Applications (2023-2030)
Figure 41 Middle East and Africa Sales Intelligence Systems Revenue (USD Million) By Region (2023-2030)
Figure 42 Middle East and Africa Sales Intelligence Systems Revenue (USD Million) By Region (2023-2030)
Figure 43 Middle East and Africa Sales Intelligence Systems Revenue (USD Million) By Type (2023-2030)
Figure 44 Middle East and Africa Sales Intelligence Systems Revenue (USD Million) By Applications (2023-2030)
Figure 45 Bottom-Up and Top-Down Approaches For This Report
Figure 46 Data Triangulation
