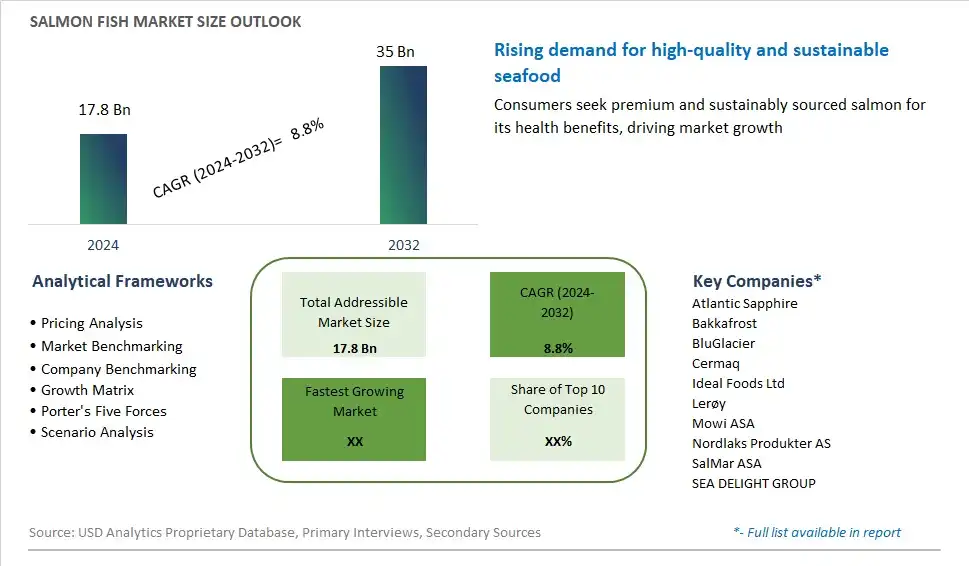
Global Salmon Fish Market Size is valued at $17.8 Billion in 2024 and is forecast to register a growth rate (CAGR) of 8.8% to reach $35 Billion by 2032.
The global Salmon Fish Market Comprehensive Study analyzes and forecasts the market size across 6 regions and 24 countries for diverse segments -By Species (Atlantic/Aquaculture, Pacific), By Form (Fresh, Frozen, Others)
An Introduction to Salmon Fish Market
The market for salmon fish remains buoyant in 2024, fueled by sustained demand for this nutritious and versatile seafood staple. Renowned for its rich flavor, tender texture, and high omega-3 fatty acid content, salmon is a popular choice among health-conscious consumers seeking to incorporate more seafood into their diets. In addition to its exceptional taste profile, salmon is prized for its numerous health benefits, including support for heart health, brain function, and overall well-being. The market is characterized by a diverse range of salmon products, including fresh, frozen, smoked, and canned varieties, catering to different culinary preferences and consumption occasions. Moreover, advancements in aquaculture technology and sustainable fishing practices are ensuring a steady supply of high-quality salmon while minimizing environmental impact. As consumers continue to prioritize sustainable and responsibly sourced seafood options, the market for salmon fish is poised for continued growth, supported by innovation, traceability, and a growing appreciation for the nutritional value and culinary versatility of this beloved fish.
Salmon Fish Competitive Landscape
The market report analyses the leading companies in the industry including Atlantic Sapphire, Bakkafrost, BluGlacier, Cermaq, Ideal Foods Ltd, Lerøy, Mowi ASA, Nordlaks Produkter AS, SalMar ASA, SEA DELIGHT GROUP, and Others.
Salmon Fish Market Dynamics
Salmon Fish Market Trend: Increasing Consumer Demand for Healthy and Sustainable Seafood Options
The market for Salmon Fish is experiencing a prominent trend driven by the growing consumer preference for healthy and sustainable seafood choices. With rising awareness of the health benefits associated with consuming omega-3 fatty acids found abundantly in salmon, coupled with concerns about overfishing and environmental sustainability, consumers are actively seeking out salmon as a nutritious and eco-friendly protein source. This trend is further fueled by the popularity of Mediterranean and Nordic diets, which emphasize the consumption of fatty fish like salmon for their cardiovascular and overall health benefits.
Market Driver: Health Benefits and Nutritional Superiority of Salmon
The market for Salmon Fish is primarily driven by its well-documented health benefits and nutritional superiority. Salmon is renowned for its high protein content, along with being an excellent source of omega-3 fatty acids, vitamins D and B12, and minerals like selenium. The omega-3 fatty acids found in salmon are known to promote heart health, improve brain function, and reduce inflammation, making it a highly sought-after food among health-conscious consumers. Additionally, salmon's versatility in culinary applications, ranging from grilling and baking to smoking and sushi preparation, further contributes to its popularity and market demand.
Market Opportunity: Diversification of Product Offerings and Market Expansion
The market for Salmon Fish presents a significant opportunity for diversification of product offerings and market expansion. Companies operating in the seafood industry can capitalize on the growing demand for salmon by introducing a variety of value-added products and expanding into new market segments. This includes offering ready-to-cook salmon fillets, smoked salmon slices, salmon burgers, and pre-marinated salmon cuts to cater to diverse consumer preferences and convenience needs. Moreover, there's an opportunity to explore new distribution channels, such as online retail platforms and direct-to-consumer sales, to reach a broader customer base beyond traditional seafood markets. By leveraging these opportunities for product diversification and market expansion, companies can strengthen their position in the salmon fish market and capitalize on the growing consumer demand for healthy and sustainable seafood options.
Salmon Fish Market Share Analysis: Atlantic/Aquaculture Salmon held the dominant market share in 2024
In the Salmon Fish Market, the Atlantic/Aquaculture segment stands as the largest. This dominance is primarily attributed to the widespread commercial farming of Atlantic salmon, which ensures a consistent and abundant supply throughout the year. Aquaculture practices have enabled efficient breeding and cultivation of Atlantic salmon, meeting the high demand for this prized fish species in various markets worldwide. Further, Atlantic salmon's mild flavor, delicate texture, and versatility in culinary applications make it a favorite choice among consumers and chefs alike. Additionally, the availability of certifications and sustainable farming practices in the aquaculture industry further reinforces the popularity of Atlantic salmon among environmentally-conscious consumers. As a result, the Atlantic/Aquaculture segment maintains its position as the largest segment in the Salmon Fish Market, offering a reliable and flavorful source of salmon to meet global demand.
Salmon Fish Market Share Analysis: Frozen Salmon market is poised to register the fastest growth rae over the forecast period to 2032
Within the Salmon Fish Market, the Frozen Salmon segment is the fastest-growing. The robust growth outlook is driven by several factors. Firstly, advancements in freezing technology have greatly improved the quality and shelf life of frozen salmon, making it an attractive option for both consumers and retailers. Frozen salmon offers the convenience of extended storage without compromising on taste or nutritional value, appealing to busy consumers seeking quick and easy meal solutions. Further, frozen salmon provides greater flexibility in distribution and logistics, allowing suppliers to reach distant markets and expand their customer base. Additionally, the COVID-19 pandemic has further accelerated the demand for frozen seafood as consumers prioritize longer-lasting food options and minimize shopping trips. Furthermore, the growing awareness of sustainable fishing practices and certifications in the seafood industry has bolstered consumer confidence in the quality and provenance of frozen salmon products. As a result, the Frozen Salmon segment is experiencing rapid growth in the Salmon Fish Market, presenting significant opportunities for suppliers to capitalize on this burgeoning trend.
Salmon Fish Market Segmentation
By Species
Atlantic/Aquaculture
Pacific
-Coho
-Chinook/King
-Pink
-Red
-Chum
By Form
Fresh
Frozen
Others
Countries Analyzed
North America (US, Canada, Mexico)
Europe (Germany, UK, France, Spain, Italy, Russia, Rest of Europe)
Asia Pacific (China, India, Japan, South Korea, Australia, South East Asia, Rest of Asia)
South America (Brazil, Argentina, Rest of South America)
Middle East and Africa (Saudi Arabia, UAE, Rest of Middle East, South Africa, Egypt, Rest of Africa)
Salmon Fish Companies Profiled in the Study
Atlantic Sapphire
Bakkafrost
BluGlacier
Cermaq
Ideal Foods Ltd
Lerøy
Mowi ASA
Nordlaks Produkter AS
SalMar ASA
SEA DELIGHT GROUP
*- List Not Exhaustive
Chapter 1. TABLE OF CONTENTS
Chapter 2. Introduction to Salmon Fish Market
2.1. Market Overview
2.2. Key Statistics and Report Highlights
2.3. Scope of the Comprehensive Study
2.3.1. Market Definition
2.3.2 Countries and Regions Covered
2.3.3 Research Objective
2.3.4 Units, Currency, and Conversions
2.3.5 Industry Value Chain
2.4. Key Market Segments
2.5. Key Companies
2.6. Study Period
Chapter 3. Strategic Analysis Review
3.1. Salmon Fish Pricing Analysis and Forecast
3.2. Porter’s Five Forces
3.3. Market Ecosystem
3.4. SWOT Analysis
3.5. Regulatory Scenario
3.3. Effects of Inflation, Russia-Ukraine War, moderating economic growth, and other macroeconomic factors
Chapter 4. Competitive Landscape
4.1. Market Share Analysis
4.1.1. Global Salmon Fish Market Share by Company, 2023
4.1.2. Product Offerings of Leading Salmon Fish Companies
4.2. Market Entropy
4.2.1. New Product Launches in the Industry
4.2.2. Mergers, Acquisitions, Joint ventures, and Partnerships
4.3. Key Strategies and Best Practices
Chapter 5. Global Market Projections: Best, Reference, and Low Case Scenarios
5.1. Growth Analysis- Case Scenario Definitions
5.2. Low Growth Case Scenario Forecasts
5.3. Reference Growth Case Scenario Forecasts
5.4. High Growth Case Scenario Forecasts
Chapter 6. Market Dynamics
6.1. Salmon Fish Market Drivers
6.2. Salmon Fish Market Challenges
6.6. Salmon Fish Market Opportunities
6.4. Salmon Fish Market Trends
Chapter 7. Global Salmon Fish Market Outlook Trends
7.1. Global Salmon Fish Revenue (USD Million) and CAGR (%) by Type (2021-2032)
7.2. Global Salmon Fish Revenue (USD Million) and CAGR (%) by Application (2021-2032)
7.3. Global Salmon Fish Revenue (USD Million) and CAGR (%) by Product (2021-2032)
By Species
Atlantic/Aquaculture
Pacific
-Coho
-Chinook/King
-Pink
-Red
-Chum
By Form
Fresh
Frozen
Others
Chapter 8. Global Salmon Fish Regional Analysis and Outlook
8.1. Global Salmon Fish Revenue (USD Million) By Regions (2021- 2032)
8.2. North America Salmon Fish Revenue (USD Million) by Country (2021-2032)
8.2.1. United States Salmon Fish Regional Analysis and Outlook
8.2.2. Canada Salmon Fish Regional Analysis and Outlook
8.2.3. Mexico Salmon Fish Regional Analysis and Outlook
8.3. Europe Salmon Fish Revenue (USD Million), by Country (2021-2032)
8.3.1. Germany Salmon Fish Regional Analysis and Outlook
8.3.2. France Salmon Fish Regional Analysis and Outlook
8.3.3. United Kingdom Salmon Fish Regional Analysis and Outlook
8.3.4. Spain Salmon Fish Regional Analysis and Outlook
8.3.5. Italy Salmon Fish Regional Analysis and Outlook
8.3.6. Russia Salmon Fish Regional Analysis and Outlook
8.3.7. Rest of Europe Salmon Fish Regional Analysis and Outlook
8.4. Asia Pacific Salmon Fish Revenue (USD Million) by Country (2021-2032)
8.4.1. China Salmon Fish Regional Analysis and Outlook
8.4.2. Japan Salmon Fish Regional Analysis and Outlook
8.4.3. India Salmon Fish Regional Analysis and Outlook
8.4.4. South Korea Salmon Fish Regional Analysis and Outlook
8.4.5. Australia Salmon Fish Regional Analysis and Outlook
8.4.6. South East Asia Salmon Fish Regional Analysis and Outlook
8.4.7. Rest of Asia Pacific Salmon Fish Regional Analysis and Outlook
8.5. South America Salmon Fish Revenue (USD Million), by Country (2021-2032)
8.5.1. Brazil Salmon Fish Regional Analysis and Outlook
8.5.2. Argentina Salmon Fish Regional Analysis and Outlook
8.5.3. Rest of South America Salmon Fish Regional Analysis and Outlook
8.6. Middle East and Africa Salmon Fish Revenue (USD Million) by Country (2021-2032)
8.6.1. Middle East Salmon Fish Regional Analysis and Outlook
8.6.2. Africa Salmon Fish Regional Analysis and Outlook
Chapter 9. North America Salmon Fish Analysis and Outlook
9.1. North America Salmon Fish Revenue (USD Million) by Segments (2021-2032)
9.1.1. North America Salmon Fish Revenue (USD Million) by Type (2021-2032)
9.1.2. North America Salmon Fish Revenue (USD Million) by Application (2021-2032)
9.1.3. North America Salmon Fish Revenue (USD Million) by Product (2021-2032)
By Species
Atlantic/Aquaculture
Pacific
-Coho
-Chinook/King
-Pink
-Red
-Chum
By Form
Fresh
Frozen
Others
Chapter 10. Europe Salmon Fish Analysis and Outlook
10.1. Europe Salmon Fish Revenue (USD Million), by Segments (USD Million) (2021-2032)
10.1.1. Europe Salmon Fish Revenue (USD Million) by Type (2021-2032)
10.1.2. Europe Salmon Fish Revenue (USD Million) by Application (2021-2032)
10.1.3. Europe Salmon Fish Revenue (USD Million) by Product (2021-2032)
By Species
Atlantic/Aquaculture
Pacific
-Coho
-Chinook/King
-Pink
-Red
-Chum
By Form
Fresh
Frozen
Others
Chapter 11. Asia Pacific Salmon Fish Analysis and Outlook
11.1. Asia Pacific Salmon Fish Revenue (USD Million), and Revenue (USD Million) by Segments (2021-2032)
11.1.1. Asia Pacific Salmon Fish Revenue (USD Million) by Type (2021-2032)
11.1.2. Asia Pacific Salmon Fish Revenue (USD Million) by Application (2021-2032)
11.1.3. Asia Pacific Salmon Fish Revenue (USD Million) by Product (2021-2032)
By Species
Atlantic/Aquaculture
Pacific
-Coho
-Chinook/King
-Pink
-Red
-Chum
By Form
Fresh
Frozen
Others
Chapter 12. South America Salmon Fish Analysis and Outlook
12.1. South America Salmon Fish Revenue (USD Million), by Segments (2021-2032)
12.1.1. South America Salmon Fish Revenue (USD Million) by Type (2021-2032)
12.1.2. South America Salmon Fish Revenue (USD Million) by Application (2021-2032)
12.1.3. South America Salmon Fish Revenue (USD Million) by Product (2021-2032)
By Species
Atlantic/Aquaculture
Pacific
-Coho
-Chinook/King
-Pink
-Red
-Chum
By Form
Fresh
Frozen
Others
Chapter 13. Middle East and Africa Salmon Fish Analysis and Outlook
13.1. Middle East and Africa Salmon Fish Revenue (USD Million), by Segments (2021-2032)
13.1.1. Middle East and Africa Salmon Fish Revenue (USD Million) by Type (2021-2032)
13.1.2. Middle East and Africa Salmon Fish Revenue (USD Million) by Application (2021-2032)
13.1.3. Middle East and Africa Salmon Fish Revenue (USD Million) by Product (2021-2032)
By Species
Atlantic/Aquaculture
Pacific
-Coho
-Chinook/King
-Pink
-Red
-Chum
By Form
Fresh
Frozen
Others
Chapter 14. Salmon Fish Company Profiles
14.1 Business Overview
14.2 Product Profiles
14.3 SWOT Profiles
14.5 Recent Developments
14.6 Financial Profile
List of Companies
Atlantic Sapphire
Bakkafrost
BluGlacier
Cermaq
Ideal Foods Ltd
Lerøy
Mowi ASA
Nordlaks Produkter AS
SalMar ASA
SEA DELIGHT GROUP
15. Methodology and Data Sources
15.1 Customization Offerings
15.2 Subscription Services
15.3 Related Reports
15.4 Publisher Expertise
LIST OF TABLES
Table 1 Market Segmentation Analysis
Table 2 Global Salmon Fish Market Share of Leading Companies, 2023
Table 3 Product Offerings of Leading Companies
Table 4 Low Growth Scenario Forecasts
Table 5 Reference Case Growth Scenario
Table 6 High Growth Case Scenario
Table 7 Global Salmon Fish Revenue (USD Million) And CAGR (%) By Type (2021-2032)
Table 8 Global Salmon Fish Revenue (USD Million) And CAGR (%) By Application (2021-2032)
Table 9 Global Salmon Fish Revenue (USD Million) And CAGR (%) By Product (2021-2032)
Table 10 Global Salmon Fish Market Revenue (USD Million) By Regions (2021-2032)
Table 11 Global Salmon Fish Market Share (%) By Regions (2021-2032)
Table 12 North America Salmon Fish Revenue (USD Million) By Country (2021-2032)
Table 13 Europe Salmon Fish Revenue (USD Million) By Country (2021-2032)
Table 14 Asia Pacific Salmon Fish Revenue (USD Million) By Country (2021-2032)
Table 15 South America Salmon Fish Revenue (USD Million) By Country (2021-2032)
Table 16 Middle East and Africa Salmon Fish Revenue (USD Million) By Region (2021-2032)
Table 17 North America Salmon Fish Revenue (USD Million) By Type (2021-2032)
Table 18 North America Salmon Fish Revenue (USD Million) By Application (2021-2032)
Table 19 North America Salmon Fish Revenue (USD Million) By Product (2021-2032)
Table 20 Europe Salmon Fish Revenue (USD Million) By Type (2021-2032)
Table 21 Europe Salmon Fish Revenue (USD Million) By Application (2021-2032)
Table 22 Europe Salmon Fish Revenue (USD Million) By Product (2021-2032)
Table 23 Asia Pacific Salmon Fish Revenue (USD Million) By Type (2021-2032)
Table 24 Asia Pacific Salmon Fish Revenue (USD Million) By Application (2021-2032)
Table 25 Asia Pacific Salmon Fish Revenue (USD Million) By Product (2021-2032)
Table 26 South America Salmon Fish Revenue (USD Million) By Type (2021-2032)
Table 27 South America Salmon Fish Revenue (USD Million) By Application (2021-2032)
Table 28 South America Salmon Fish Revenue (USD Million) By Product (2021-2032)
Table 29 Middle East and Africa Salmon Fish Revenue (USD Million) By Type (2021-2032)
Table 30 Middle East and Africa Salmon Fish Revenue (USD Million) By Application (2021-2032)
Table 31 Middle East and Africa Salmon Fish Revenue (USD Million) By Product (2021-2032)
LIST OF FIGURES
Figure 1. Market Scope
Figure 2. Pricing Forecasts Per Unit, 2023- 2032
Figure 3. Porter’s Five Forces
Figure 4. Global Salmon Fish Market Revenue (USD Million) By Regions (2021-2032)
Figure 5. Global Salmon Fish Market Share (%) By Regions (2023)
Figure 6. North America Salmon Fish Revenue (USD Million) By Country (2021-2032)
Figure 7. United States Salmon Fish Revenue (USD Million) By Country (2021-2032)
Figure 8. Canada Salmon Fish Revenue (USD Million) By Country (2021-2032)
Figure 9. Mexico Salmon Fish Revenue (USD Million) By Country (2021-2032)
Figure 10. Europe Salmon Fish Revenue (USD Million) By Country (2021-2032)
Figure 11. Germany Salmon Fish Revenue (USD Million) By Country (2021-2032)
Figure 12. France Salmon Fish Revenue (USD Million) By Country (2021-2032)
Figure 13. United Kingdom Salmon Fish Revenue (USD Million) By Country (2021-2032)
Figure 14. Spain Salmon Fish Revenue (USD Million) By Country (2021-2032)
Figure 15. Italy Salmon Fish Revenue (USD Million) By Country (2021-2032)
Figure 16. Russia Salmon Fish Revenue (USD Million) By Country (2021-2032)
Figure 17. Rest of Europe Salmon Fish Revenue (USD Million) By Country (2021-2032)
Figure 11. Asia Pacific Salmon Fish Revenue (USD Million) By Country (2021-2032)
Figure 12. China Salmon Fish Revenue (USD Million) By Country (2021-2032)
Figure 13. Japan Salmon Fish Revenue (USD Million) By Country (2021-2032)
Figure 14. India Salmon Fish Revenue (USD Million) By Country (2021-2032)
Figure 15. South Korea Salmon Fish Revenue (USD Million) By Country (2021-2032)
Figure 16. Australia Salmon Fish Revenue (USD Million) By Country (2021-2032)
Figure 17. South East Asia Salmon Fish Revenue (USD Million) By Country (2021-2032)
Figure 18. South America Salmon Fish Revenue (USD Million) By Country (2021-2032)
Figure 19. Brazil Salmon Fish Revenue (USD Million) By Country (2021-2032)
Figure 20. Argentina Salmon Fish Revenue (USD Million) By Country (2021-2032)
Figure 21. Rest of Asia Pacific Salmon Fish Revenue (USD Million) By Country (2021-2032)
Figure 22. Middle East and Africa Salmon Fish Revenue (USD Million) By Region (2021-2032)
Figure 23. Saudi Arabia Salmon Fish Revenue (USD Million) By Region (2021-2032)
Figure 24. The UAE Salmon Fish Revenue (USD Million) By Region (2021-2032)
Figure 25. Rest of Middle East Salmon Fish Revenue (USD Million) By Region (2021-2032)
Figure 26. South Africa Salmon Fish Revenue (USD Million) By Region (2021-2032)
Figure 27. Africa Salmon Fish Revenue (USD Million) By Region (2021-2032)
Figure 28. North America Salmon Fish Revenue (USD Million) By Type (2021-2032)
Figure 29. North America Salmon Fish Revenue (USD Million) By Application (2021-2032)
Figure 30. North America Salmon Fish Revenue (USD Million) By Product (2021-2032)
Figure 31. Europe Salmon Fish Revenue (USD Million) By Type (2021-2032)
Figure 32. Europe Salmon Fish Revenue (USD Million) By Application (2021-2032)
Figure 33. Europe Salmon Fish Revenue (USD Million) By Product (2021-2032)
Figure 34. Asia Pacific Salmon Fish Revenue (USD Million) By Type (2021-2032)
Figure 35. Asia Pacific Salmon Fish Revenue (USD Million) By Application (2021-2032)
Figure 36. Asia Pacific Salmon Fish Revenue (USD Million) By Product (2021-2032)
Figure 37. South America Salmon Fish Revenue (USD Million) By Type (2021-2032)
Figure 38. South America Salmon Fish Revenue (USD Million) By Application (2021-2032)
Figure 39. South America Salmon Fish Revenue (USD Million) By Product (2021-2032)
Figure 40. Middle East and Africa Salmon Fish Revenue (USD Million) By Type (2021-2032)
Figure 41. Middle East and Africa Salmon Fish Revenue (USD Million) By Application (2021-2032)
Figure 42. Middle East and Africa Salmon Fish Revenue (USD Million) By Product (2021-2032)
By Species
Atlantic/Aquaculture
Pacific
-Coho
-Chinook/King
-Pink
-Red
-Chum
By Form
Fresh
Frozen
Others
Countries Analyzed
North America (US, Canada, Mexico)
Europe (Germany, UK, France, Spain, Italy, Russia, Rest of Europe)
Asia Pacific (China, India, Japan, South Korea, Australia, South East Asia, Rest of Asia)
South America (Brazil, Argentina, Rest of South America)
Middle East and Africa (Saudi Arabia, UAE, Rest of Middle East, South Africa, Egypt, Rest of Africa)
