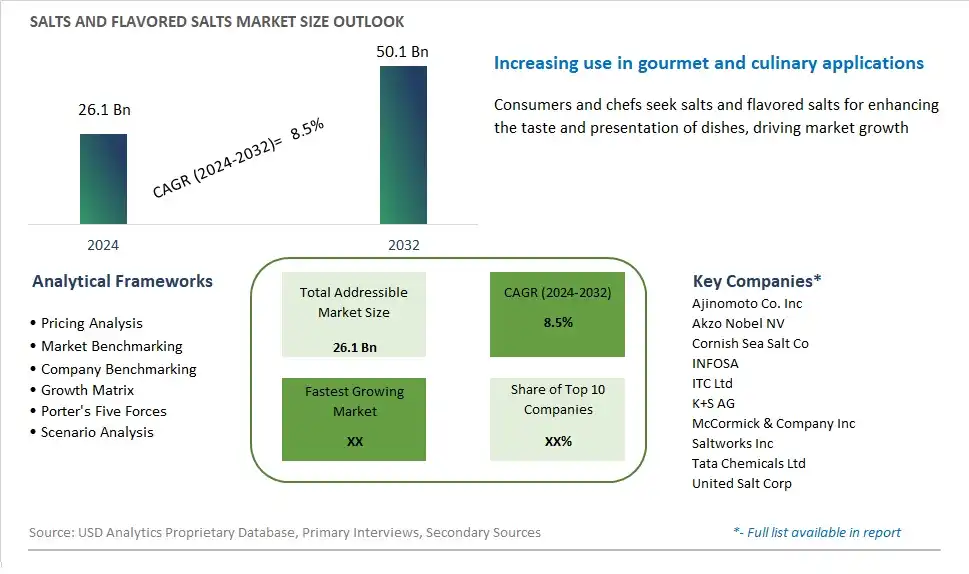
Global Salts and Flavored Salts Market Size is valued at $26.1 Billion in 2024 and is forecast to register a growth rate (CAGR) of 8.5% to reach $50.1 Billion by 2032.
The global Salts and Flavored Salts Market Comprehensive Study analyzes and forecasts the market size across 6 regions and 24 countries for diverse segments -By Type (Table Salt, Seasoned Salt, Flavored Salt, Lime, and Lemon Salt, Smoked Salt, Jalapeno Salt, Others), By End-User (Food and beverages, Foodservice, Household), By Distribution Channel (Supermarkets/Hypermarkets, Convenience Stores, Departmental Stores, Others)
An Introduction to Salts and Flavored Salts Market
The salts and flavored salts market in 2024 is thriving, driven by the increasing culinary trend towards gourmet and artisanal food experiences. Flavored salts, infused with herbs, spices, and other natural ingredients, offer unique taste profiles that enhance a variety of dishes. The market is characterized by a wide range of products, from exotic sea salts to locally sourced specialty salts. Health-conscious consumers are also seeking low-sodium and mineral-rich salt alternatives. Innovations in packaging and marketing, along with the growing popularity of cooking shows and food blogs, are further propelling market growth. Major producers are focusing on sustainable sourcing and ethical production practices to cater to discerning consumers.
Salts and Flavored Salts Competitive Landscape
The market report analyses the leading companies in the industry including Ajinomoto Co. Inc, Akzo Nobel NV, Cornish Sea Salt Co, INFOSA, ITC Ltd, K+S AG, McCormick & Company Inc, Saltworks Inc, Tata Chemicals Ltd, United Salt Corp, and Others.
Salts and Flavored Salts Market Dynamics
Salts and Flavored Salts Market Trend: Rising Demand for Gourmet and Artisanal Culinary Products
A prominent market trend in salts and flavored salts is the rising demand for gourmet and artisanal culinary products. Consumers are increasingly seeking high-quality ingredients to elevate their cooking and dining experiences, and salts and flavored salts are no exception. From Himalayan pink salt to smoked sea salt infused with herbs and spices, there is growing interest in specialty salts that add unique flavors and textures to dishes. This trend is driven by a growing foodie culture, increased interest in home cooking and culinary experimentation, and the desire for restaurant-quality meals prepared at home.
Market Driver: Focus on Health and Wellness Benefits of Salt Alternatives
The market driver for salts and flavored salts is the focus on the health and wellness benefits of salt alternatives. With growing concerns about the health implications of excessive sodium consumption, consumers are seeking alternatives to traditional table salt that offer flavor without compromising on health. Flavored salts made with natural ingredients such as herbs, spices, and botanicals provide a flavorful alternative to plain salt while adding nutritional value and complexity to dishes. This driver is reinforced by the increasing emphasis on clean eating, label transparency, and the incorporation of functional ingredients in culinary products, driving demand for salts and flavored salts that offer both taste and health benefits.
Market Opportunity: Expansion into Premium Gift and Gourmet Food Markets
One potential opportunity for the salts and flavored salts market lies in expansion into the premium gift and gourmet food markets. Salts and flavored salts packaged in elegant jars or gift sets can appeal to consumers looking for upscale culinary gifts or specialty food items for entertaining and gifting occasions. By positioning salts and flavored salts as premium, artisanal products with unique flavor profiles and packaging designs, brands can tap into the growing market for gourmet food products and gift items. Additionally, targeting specialty food stores, gourmet grocery retailers, and online platforms catering to food enthusiasts can help expand distribution channels and reach a broader audience of discerning consumers seeking high-quality culinary ingredients and gifts.
Salts and Flavored Salts Market Share Analysis: Table Salt held the dominant market share in 2024
In the Salts and Flavored Salts market segmented by type, the Table Salt segment is the largest, driven by its ubiquitous use in households and food service establishments worldwide. Table salt, also known as sodium chloride, is a fundamental ingredient in cooking, baking, and food preservation, making it an essential pantry staple for consumers across diverse culinary cultures. This segment's dominance is reinforced by the widespread availability and affordability of table salt, which is readily accessible in various forms, including iodized, kosher, sea salt, and rock salt. Further, table salt's neutral flavor profile and versatility make it suitable for a wide range of culinary applications, from seasoning and flavoring dishes to enhancing the taste and texture of baked goods and preserving foods. Additionally, the consistent demand for table salt in food processing and manufacturing industries further contributes to its prominence in the market. Furthermore, the perception of table salt as a basic necessity and its essential role in everyday cooking and food preparation solidify its position as the largest segment in the Salts and Flavored Salts market. Overall, the combination of its widespread usage, affordability, and indispensable role in culinary practices positions Table Salt as the largest segment in the Salts and Flavored Salts market.
Salts and Flavored Salts Market Share Analysis: Food and Beverages market is poised to register the fastest growth rae over the forecast period to 2032
In the Salts and Flavored Salts market segmented by end-user, the Food and Beverages segment is the fastest-growing, driven by the increasing demand for innovative and gourmet flavor profiles in culinary creations and packaged food products. This growth is propelled by several factors, including the rising consumer interest in culinary experimentation, artisanal cooking, and ethnic cuisine, where flavored salts add complexity and depth to dishes. Further, food manufacturers and chefs are incorporating flavored salts into their product formulations to cater to evolving consumer preferences for unique and premium taste experiences. Additionally, the Food and Beverages segment benefits from the versatility of flavored salts, which can be used as seasoning agents, finishing touches, or flavor enhancers in a wide range of food and beverage applications, including snacks, condiments, sauces, and ready-to-eat meals. Furthermore, the growing popularity of gourmet and specialty food products, coupled with the increasing emphasis on flavor differentiation and sensory appeal, drives the demand for flavored salts in the food and beverage industry. Further, the Food and Beverages segment's growth is further fueled by the expanding market for flavored salts in the culinary and mixology sectors, where bartenders and chefs use flavored salts to create innovative cocktails and mocktails, appealing to discerning consumers seeking unique taste experiences. Overall, the combination of culinary innovation, consumer demand for premium flavors, and the versatility of flavored salts positions the Food and Beverages segment as the fastest-growing in the Salts and Flavored Salts market.
Salts and Flavored Salts Market Share Analysis: Supermarkets/Hypermarkets held the dominant market share in 2024
In the Salts and Flavored Salts market segmented by distribution channel, the Supermarkets/Hypermarkets segment is the largest, driven by the extensive reach, diverse product offerings, and consumer convenience offered by these retail outlets. Supermarkets and hypermarkets serve as primary destinations for consumers to fulfill their grocery needs, offering a wide selection of salts and flavored salts alongside other food and household items. This segment's dominance is reinforced by the one-stop shopping experience provided by supermarkets and hypermarkets, where consumers can find a variety of brands, flavors, and packaging options under one roof. Further, the strategic placement of salts and flavored salts within these retail spaces, often near cooking ingredients or gourmet food sections, enhances their visibility and accessibility to shoppers. Additionally, supermarkets and hypermarkets frequently offer promotional discounts, bundled deals, and in-store demonstrations, further incentivizing consumers to purchase salts and flavored salts during their shopping trips. Furthermore, the established logistics and supply chain networks of supermarkets and hypermarkets ensure consistent product availability and timely replenishment, contributing to the segment's market dominance. Overall, the combination of convenience, variety, and promotional activities positions the Supermarkets/Hypermarkets segment as the largest in the Salts and Flavored Salts market distribution channels.
Salts and Flavored Salts Market Segmentation
By Type
Table Salt
Seasoned Salt
Flavored Salt
Lime and Lemon Salt
Smoked Salt
Jalapeno Salt
Others
By End-User
Food and beverages
Food service
Household
By Distribution Channel
Supermarkets/Hypermarkets
Convenience Stores
Departmental Stores
Others
Countries Analyzed
North America (US, Canada, Mexico)
Europe (Germany, UK, France, Spain, Italy, Russia, Rest of Europe)
Asia Pacific (China, India, Japan, South Korea, Australia, South East Asia, Rest of Asia)
South America (Brazil, Argentina, Rest of South America)
Middle East and Africa (Saudi Arabia, UAE, Rest of Middle East, South Africa, Egypt, Rest of Africa)
Salts and Flavored Salts Companies Profiled in the Study
Ajinomoto Co. Inc
Akzo Nobel NV
Cornish Sea Salt Co
INFOSA
ITC Ltd
K+S AG
McCormick & Company Inc
Saltworks Inc
Tata Chemicals Ltd
United Salt Corp
*- List Not Exhaustive
Chapter 1. TABLE OF CONTENTS
Chapter 2. Introduction to Salts and Flavored Salts Market
2.1. Market Overview
2.2. Key Statistics and Report Highlights
2.3. Scope of the Comprehensive Study
2.3.1. Market Definition
2.3.2 Countries and Regions Covered
2.3.3 Research Objective
2.3.4 Units, Currency, and Conversions
2.3.5 Industry Value Chain
2.4. Key Market Segments
2.5. Key Companies
2.6. Study Period
Chapter 3. Strategic Analysis Review
3.1. Salts and Flavored Salts Pricing Analysis and Forecast
3.2. Porter’s Five Forces
3.3. Market Ecosystem
3.4. SWOT Analysis
3.5. Regulatory Scenario
3.3. Effects of Inflation, Russia-Ukraine War, moderating economic growth, and other macroeconomic factors
Chapter 4. Competitive Landscape
4.1. Market Share Analysis
4.1.1. Global Salts and Flavored Salts Market Share by Company, 2023
4.1.2. Product Offerings of Leading Salts and Flavored Salts Companies
4.2. Market Entropy
4.2.1. New Product Launches in the Industry
4.2.2. Mergers, Acquisitions, Joint ventures, and Partnerships
4.3. Key Strategies and Best Practices
Chapter 5. Global Market Projections: Best, Reference, and Low Case Scenarios
5.1. Growth Analysis- Case Scenario Definitions
5.2. Low Growth Case Scenario Forecasts
5.3. Reference Growth Case Scenario Forecasts
5.4. High Growth Case Scenario Forecasts
Chapter 6. Market Dynamics
6.1. Salts and Flavored Salts Market Drivers
6.2. Salts and Flavored Salts Market Challenges
6.6. Salts and Flavored Salts Market Opportunities
6.4. Salts and Flavored Salts Market Trends
Chapter 7. Global Salts and Flavored Salts Market Outlook Trends
7.1. Global Salts and Flavored Salts Revenue (USD Million) and CAGR (%) by Type (2021-2032)
7.2. Global Salts and Flavored Salts Revenue (USD Million) and CAGR (%) by Application (2021-2032)
7.3. Global Salts and Flavored Salts Revenue (USD Million) and CAGR (%) by Product (2021-2032)
By Type
Table Salt
Seasoned Salt
Flavored Salt
Lime and Lemon Salt
Smoked Salt
Jalapeno Salt
Others
By End-User
Food and beverages
Food service
Household
By Distribution Channel
Supermarkets/Hypermarkets
Convenience Stores
Departmental Stores
Others
Chapter 8. Global Salts and Flavored Salts Regional Analysis and Outlook
8.1. Global Salts and Flavored Salts Revenue (USD Million) By Regions (2021- 2032)
8.2. North America Salts and Flavored Salts Revenue (USD Million) by Country (2021-2032)
8.2.1. United States Salts and Flavored Salts Regional Analysis and Outlook
8.2.2. Canada Salts and Flavored Salts Regional Analysis and Outlook
8.2.3. Mexico Salts and Flavored Salts Regional Analysis and Outlook
8.3. Europe Salts and Flavored Salts Revenue (USD Million), by Country (2021-2032)
8.3.1. Germany Salts and Flavored Salts Regional Analysis and Outlook
8.3.2. France Salts and Flavored Salts Regional Analysis and Outlook
8.3.3. United Kingdom Salts and Flavored Salts Regional Analysis and Outlook
8.3.4. Spain Salts and Flavored Salts Regional Analysis and Outlook
8.3.5. Italy Salts and Flavored Salts Regional Analysis and Outlook
8.3.6. Russia Salts and Flavored Salts Regional Analysis and Outlook
8.3.7. Rest of Europe Salts and Flavored Salts Regional Analysis and Outlook
8.4. Asia Pacific Salts and Flavored Salts Revenue (USD Million) by Country (2021-2032)
8.4.1. China Salts and Flavored Salts Regional Analysis and Outlook
8.4.2. Japan Salts and Flavored Salts Regional Analysis and Outlook
8.4.3. India Salts and Flavored Salts Regional Analysis and Outlook
8.4.4. South Korea Salts and Flavored Salts Regional Analysis and Outlook
8.4.5. Australia Salts and Flavored Salts Regional Analysis and Outlook
8.4.6. South East Asia Salts and Flavored Salts Regional Analysis and Outlook
8.4.7. Rest of Asia Pacific Salts and Flavored Salts Regional Analysis and Outlook
8.5. South America Salts and Flavored Salts Revenue (USD Million), by Country (2021-2032)
8.5.1. Brazil Salts and Flavored Salts Regional Analysis and Outlook
8.5.2. Argentina Salts and Flavored Salts Regional Analysis and Outlook
8.5.3. Rest of South America Salts and Flavored Salts Regional Analysis and Outlook
8.6. Middle East and Africa Salts and Flavored Salts Revenue (USD Million) by Country (2021-2032)
8.6.1. Middle East Salts and Flavored Salts Regional Analysis and Outlook
8.6.2. Africa Salts and Flavored Salts Regional Analysis and Outlook
Chapter 9. North America Salts and Flavored Salts Analysis and Outlook
9.1. North America Salts and Flavored Salts Revenue (USD Million) by Segments (2021-2032)
9.1.1. North America Salts and Flavored Salts Revenue (USD Million) by Type (2021-2032)
9.1.2. North America Salts and Flavored Salts Revenue (USD Million) by Application (2021-2032)
9.1.3. North America Salts and Flavored Salts Revenue (USD Million) by Product (2021-2032)
By Type
Table Salt
Seasoned Salt
Flavored Salt
Lime and Lemon Salt
Smoked Salt
Jalapeno Salt
Others
By End-User
Food and beverages
Food service
Household
By Distribution Channel
Supermarkets/Hypermarkets
Convenience Stores
Departmental Stores
Others
Chapter 10. Europe Salts and Flavored Salts Analysis and Outlook
10.1. Europe Salts and Flavored Salts Revenue (USD Million), by Segments (USD Million) (2021-2032)
10.1.1. Europe Salts and Flavored Salts Revenue (USD Million) by Type (2021-2032)
10.1.2. Europe Salts and Flavored Salts Revenue (USD Million) by Application (2021-2032)
10.1.3. Europe Salts and Flavored Salts Revenue (USD Million) by Product (2021-2032)
By Type
Table Salt
Seasoned Salt
Flavored Salt
Lime and Lemon Salt
Smoked Salt
Jalapeno Salt
Others
By End-User
Food and beverages
Food service
Household
By Distribution Channel
Supermarkets/Hypermarkets
Convenience Stores
Departmental Stores
Others
Chapter 11. Asia Pacific Salts and Flavored Salts Analysis and Outlook
11.1. Asia Pacific Salts and Flavored Salts Revenue (USD Million), and Revenue (USD Million) by Segments (2021-2032)
11.1.1. Asia Pacific Salts and Flavored Salts Revenue (USD Million) by Type (2021-2032)
11.1.2. Asia Pacific Salts and Flavored Salts Revenue (USD Million) by Application (2021-2032)
11.1.3. Asia Pacific Salts and Flavored Salts Revenue (USD Million) by Product (2021-2032)
By Type
Table Salt
Seasoned Salt
Flavored Salt
Lime and Lemon Salt
Smoked Salt
Jalapeno Salt
Others
By End-User
Food and beverages
Food service
Household
By Distribution Channel
Supermarkets/Hypermarkets
Convenience Stores
Departmental Stores
Others
Chapter 12. South America Salts and Flavored Salts Analysis and Outlook
12.1. South America Salts and Flavored Salts Revenue (USD Million), by Segments (2021-2032)
12.1.1. South America Salts and Flavored Salts Revenue (USD Million) by Type (2021-2032)
12.1.2. South America Salts and Flavored Salts Revenue (USD Million) by Application (2021-2032)
12.1.3. South America Salts and Flavored Salts Revenue (USD Million) by Product (2021-2032)
By Type
Table Salt
Seasoned Salt
Flavored Salt
Lime and Lemon Salt
Smoked Salt
Jalapeno Salt
Others
By End-User
Food and beverages
Food service
Household
By Distribution Channel
Supermarkets/Hypermarkets
Convenience Stores
Departmental Stores
Others
Chapter 13. Middle East and Africa Salts and Flavored Salts Analysis and Outlook
13.1. Middle East and Africa Salts and Flavored Salts Revenue (USD Million), by Segments (2021-2032)
13.1.1. Middle East and Africa Salts and Flavored Salts Revenue (USD Million) by Type (2021-2032)
13.1.2. Middle East and Africa Salts and Flavored Salts Revenue (USD Million) by Application (2021-2032)
13.1.3. Middle East and Africa Salts and Flavored Salts Revenue (USD Million) by Product (2021-2032)
By Type
Table Salt
Seasoned Salt
Flavored Salt
Lime and Lemon Salt
Smoked Salt
Jalapeno Salt
Others
By End-User
Food and beverages
Food service
Household
By Distribution Channel
Supermarkets/Hypermarkets
Convenience Stores
Departmental Stores
Others
Chapter 14. Salts and Flavored Salts Company Profiles
14.1 Business Overview
14.2 Product Profiles
14.3 SWOT Profiles
14.5 Recent Developments
14.6 Financial Profile
List of Companies
Ajinomoto Co. Inc
Akzo Nobel NV
Cornish Sea Salt Co
INFOSA
ITC Ltd
K+S AG
McCormick & Company Inc
Saltworks Inc
Tata Chemicals Ltd
United Salt Corp
15. Methodology and Data Sources
15.1 Customization Offerings
15.2 Subscription Services
15.3 Related Reports
15.4 Publisher Expertise
LIST OF TABLES
Table 1 Market Segmentation Analysis
Table 2 Global Salts and Flavored Salts Market Share of Leading Companies, 2023
Table 3 Product Offerings of Leading Companies
Table 4 Low Growth Scenario Forecasts
Table 5 Reference Case Growth Scenario
Table 6 High Growth Case Scenario
Table 7 Global Salts and Flavored Salts Revenue (USD Million) And CAGR (%) By Type (2021-2032)
Table 8 Global Salts and Flavored Salts Revenue (USD Million) And CAGR (%) By Application (2021-2032)
Table 9 Global Salts and Flavored Salts Revenue (USD Million) And CAGR (%) By Product (2021-2032)
Table 10 Global Salts and Flavored Salts Market Revenue (USD Million) By Regions (2021-2032)
Table 11 Global Salts and Flavored Salts Market Share (%) By Regions (2021-2032)
Table 12 North America Salts and Flavored Salts Revenue (USD Million) By Country (2021-2032)
Table 13 Europe Salts and Flavored Salts Revenue (USD Million) By Country (2021-2032)
Table 14 Asia Pacific Salts and Flavored Salts Revenue (USD Million) By Country (2021-2032)
Table 15 South America Salts and Flavored Salts Revenue (USD Million) By Country (2021-2032)
Table 16 Middle East and Africa Salts and Flavored Salts Revenue (USD Million) By Region (2021-2032)
Table 17 North America Salts and Flavored Salts Revenue (USD Million) By Type (2021-2032)
Table 18 North America Salts and Flavored Salts Revenue (USD Million) By Application (2021-2032)
Table 19 North America Salts and Flavored Salts Revenue (USD Million) By Product (2021-2032)
Table 20 Europe Salts and Flavored Salts Revenue (USD Million) By Type (2021-2032)
Table 21 Europe Salts and Flavored Salts Revenue (USD Million) By Application (2021-2032)
Table 22 Europe Salts and Flavored Salts Revenue (USD Million) By Product (2021-2032)
Table 23 Asia Pacific Salts and Flavored Salts Revenue (USD Million) By Type (2021-2032)
Table 24 Asia Pacific Salts and Flavored Salts Revenue (USD Million) By Application (2021-2032)
Table 25 Asia Pacific Salts and Flavored Salts Revenue (USD Million) By Product (2021-2032)
Table 26 South America Salts and Flavored Salts Revenue (USD Million) By Type (2021-2032)
Table 27 South America Salts and Flavored Salts Revenue (USD Million) By Application (2021-2032)
Table 28 South America Salts and Flavored Salts Revenue (USD Million) By Product (2021-2032)
Table 29 Middle East and Africa Salts and Flavored Salts Revenue (USD Million) By Type (2021-2032)
Table 30 Middle East and Africa Salts and Flavored Salts Revenue (USD Million) By Application (2021-2032)
Table 31 Middle East and Africa Salts and Flavored Salts Revenue (USD Million) By Product (2021-2032)
LIST OF FIGURES
Figure 1. Market Scope
Figure 2. Pricing Forecasts Per Unit, 2023- 2032
Figure 3. Porter’s Five Forces
Figure 4. Global Salts and Flavored Salts Market Revenue (USD Million) By Regions (2021-2032)
Figure 5. Global Salts and Flavored Salts Market Share (%) By Regions (2023)
Figure 6. North America Salts and Flavored Salts Revenue (USD Million) By Country (2021-2032)
Figure 7. United States Salts and Flavored Salts Revenue (USD Million) By Country (2021-2032)
Figure 8. Canada Salts and Flavored Salts Revenue (USD Million) By Country (2021-2032)
Figure 9. Mexico Salts and Flavored Salts Revenue (USD Million) By Country (2021-2032)
Figure 10. Europe Salts and Flavored Salts Revenue (USD Million) By Country (2021-2032)
Figure 11. Germany Salts and Flavored Salts Revenue (USD Million) By Country (2021-2032)
Figure 12. France Salts and Flavored Salts Revenue (USD Million) By Country (2021-2032)
Figure 13. United Kingdom Salts and Flavored Salts Revenue (USD Million) By Country (2021-2032)
Figure 14. Spain Salts and Flavored Salts Revenue (USD Million) By Country (2021-2032)
Figure 15. Italy Salts and Flavored Salts Revenue (USD Million) By Country (2021-2032)
Figure 16. Russia Salts and Flavored Salts Revenue (USD Million) By Country (2021-2032)
Figure 17. Rest of Europe Salts and Flavored Salts Revenue (USD Million) By Country (2021-2032)
Figure 11. Asia Pacific Salts and Flavored Salts Revenue (USD Million) By Country (2021-2032)
Figure 12. China Salts and Flavored Salts Revenue (USD Million) By Country (2021-2032)
Figure 13. Japan Salts and Flavored Salts Revenue (USD Million) By Country (2021-2032)
Figure 14. India Salts and Flavored Salts Revenue (USD Million) By Country (2021-2032)
Figure 15. South Korea Salts and Flavored Salts Revenue (USD Million) By Country (2021-2032)
Figure 16. Australia Salts and Flavored Salts Revenue (USD Million) By Country (2021-2032)
Figure 17. South East Asia Salts and Flavored Salts Revenue (USD Million) By Country (2021-2032)
Figure 18. South America Salts and Flavored Salts Revenue (USD Million) By Country (2021-2032)
Figure 19. Brazil Salts and Flavored Salts Revenue (USD Million) By Country (2021-2032)
Figure 20. Argentina Salts and Flavored Salts Revenue (USD Million) By Country (2021-2032)
Figure 21. Rest of Asia Pacific Salts and Flavored Salts Revenue (USD Million) By Country (2021-2032)
Figure 22. Middle East and Africa Salts and Flavored Salts Revenue (USD Million) By Region (2021-2032)
Figure 23. Saudi Arabia Salts and Flavored Salts Revenue (USD Million) By Region (2021-2032)
Figure 24. The UAE Salts and Flavored Salts Revenue (USD Million) By Region (2021-2032)
Figure 25. Rest of Middle East Salts and Flavored Salts Revenue (USD Million) By Region (2021-2032)
Figure 26. South Africa Salts and Flavored Salts Revenue (USD Million) By Region (2021-2032)
Figure 27. Africa Salts and Flavored Salts Revenue (USD Million) By Region (2021-2032)
Figure 28. North America Salts and Flavored Salts Revenue (USD Million) By Type (2021-2032)
Figure 29. North America Salts and Flavored Salts Revenue (USD Million) By Application (2021-2032)
Figure 30. North America Salts and Flavored Salts Revenue (USD Million) By Product (2021-2032)
Figure 31. Europe Salts and Flavored Salts Revenue (USD Million) By Type (2021-2032)
Figure 32. Europe Salts and Flavored Salts Revenue (USD Million) By Application (2021-2032)
Figure 33. Europe Salts and Flavored Salts Revenue (USD Million) By Product (2021-2032)
Figure 34. Asia Pacific Salts and Flavored Salts Revenue (USD Million) By Type (2021-2032)
Figure 35. Asia Pacific Salts and Flavored Salts Revenue (USD Million) By Application (2021-2032)
Figure 36. Asia Pacific Salts and Flavored Salts Revenue (USD Million) By Product (2021-2032)
Figure 37. South America Salts and Flavored Salts Revenue (USD Million) By Type (2021-2032)
Figure 38. South America Salts and Flavored Salts Revenue (USD Million) By Application (2021-2032)
Figure 39. South America Salts and Flavored Salts Revenue (USD Million) By Product (2021-2032)
Figure 40. Middle East and Africa Salts and Flavored Salts Revenue (USD Million) By Type (2021-2032)
Figure 41. Middle East and Africa Salts and Flavored Salts Revenue (USD Million) By Application (2021-2032)
Figure 42. Middle East and Africa Salts and Flavored Salts Revenue (USD Million) By Product (2021-2032)
By Type
Table Salt
Seasoned Salt
Flavored Salt
Lime and Lemon Salt
Smoked Salt
Jalapeno Salt
Others
By End-User
Food and beverages
Food service
Household
By Distribution Channel
Supermarkets/Hypermarkets
Convenience Stores
Departmental Stores
Others
Countries Analyzed
North America (US, Canada, Mexico)
Europe (Germany, UK, France, Spain, Italy, Russia, Rest of Europe)
Asia Pacific (China, India, Japan, South Korea, Australia, South East Asia, Rest of Asia)
South America (Brazil, Argentina, Rest of South America)
Middle East and Africa (Saudi Arabia, UAE, Rest of Middle East, South Africa, Egypt, Rest of Africa)
