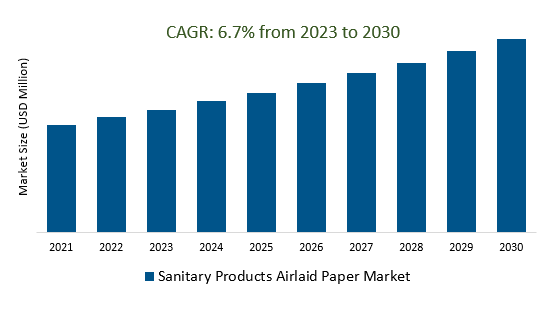
The global Sanitary Products Airlaid Paper Market Size is estimated to register 6.70% growth over the forecast period from 2023 to 2030.
Superior properties of high absorbency, soft texture, and comfort, growing awareness about personal hygiene and health, aging population demographics, and others are driving the sales volume of the non-woven fabric that is made by bonding together fibers that have been randomly dispersed in the air. Further, the rapid growth in online commerce business is further strengthening the market outlook.
The launch of thinner and lighter products with better absorbency, the introduction of innovative product designs including flexible diapers and pads, use of biodegradable and compostable to cater to the consumer demands for eco-friendly products, ongoing R&D to use advanced absorbent polymers and additives to further enhance the absorbency and performance of products, and other trends are widely observed in the industry.
Leading Sanitary Products Airlaid Paper manufacturers and vendors are marketing the benefits of a comfortable and secure fit, quick and effective absorption of fluids without leaks and odor, gentle on sensitive skin, ability to prevent moisture build-up, and ease of using and disposal to attract customers across countries.
Market Dynamics
Market Trends- Companies are launching Increasing Hygiene Awareness to attract a consumer base.
Increasing hygiene awareness is driving demand for sanitary products that rely on airlaid paper for superior absorbency, such as disposable diapers, feminine hygiene products, and adult incontinence items. This trend has also spurred the development of eco-friendly and health-oriented product options, fostering innovation in airlaid paper technology. The COVID-19 pandemic has further emphasized hygiene's importance, boosting demand for airlaid paper-based products like facial tissues and wet wipes. In emerging markets, rising hygiene consciousness presents growth opportunities for the industry, highlighting the critical role of airlaid paper in meeting evolving consumer preferences.
Market Driver- E-commerce Growth demand for efficient Silicon Carbide Wafer Market
E-commerce provides convenience, choice, and often competitive pricing, making it an attractive channel for purchasing these products. This shift toward online shopping has prompted manufacturers and retailers to optimize their supply chains and product offerings to cater to the digital marketplace, contributing to the overall growth and accessibility of sanitary products featuring airlaid paper.
Market Opportunity-Introduction of Health and Wellness Trends
Health and wellness trends significantly impact the sanitary products airlaid paper market by driving demand for products that prioritize hygiene, comfort, and overall well-being. Consumers seek items like diapers, feminine hygiene products, and adult incontinence items, incorporating airlaid paper for absorption, while also emphasizing hypoallergenic materials and skin-friendly designs. This trend encourages product innovations that cater to health-conscious consumers, aligning hygiene with broader wellness goals. Manufacturers are adapting by creating products that meet these evolving preferences, making health and wellness a key driver in the market.
Market Share Analysis- Latex-bonded Sanitary Products Airlaid Paper Market will register the fastest growth.
The global Sanitary Products Airlaid Paper Market is analyzed across Latex-bonded, Thermal-bonded, multi-bonded, and others. Of these, Latex-bonded is poised to register the fastest growth. The latex-bonded sanitary products airlaid paper market relies on latex as a binding agent for airlaid paper used in hygiene products like diapers, feminine care items, and adult incontinence products. This market is driven by heightened demand in regions with growing hygiene awareness and a push for eco-friendly options. Manufacturers are innovating to enhance product performance, comfort, and sustainability in response to market demands.
Market Share Analysis- Feminine Hygiene held a significant market share in 2023.
The global Sanitary Products Airlaid Paper Market is analyzed across a wide range of application including Feminine Hygiene, Consumer Wipes, Adult Incontinence, and others. Of these, Feminine Hygiene held a significant market share in 2023. The feminine hygiene segment in the sanitary products airlaid paper market pertains to products like sanitary napkins and tampons, where airlaid paper is crucial for absorbency and comfort. This sector is driven by a growing awareness of women's health and hygiene, resulting in ongoing product innovations. Demand for eco-friendly and hypoallergenic options is increasing, aligning with evolving consumer preferences, and manufacturers focus on creating functional products that prioritize women's well-being.
Sanitary Products Airlaid Paper Market Segmentation
By Type
By Application
- Feminine Hygiene
- Consumer Wipes
- Adult Incontinence
- Industrial Wipes
- Food Pads
- Other
By Region
- North America (United States, Canada, Mexico)
- Europe (Germany, France, United Kingdom, Spain, Italy, Others)
- Asia Pacific (China, India, Japan, South Korea, Australia, Others)
- Latin America (Brazil, Argentina, Others)
- Middle East and Africa (Saudi Arabia, UAE, Kuwait, Other Middle East, South Africa, Nigeria, Other Africa)
Sanitary Products Airlaid Paper Market companies
- Glatfelter
- Oji Kinocloth Co. Ltd
- Georgia-Pacific Corporation
- McAirlaid's Vliesstoffe
- Duni AB
- EAM Corporation
- Kinsei Seishi
- M&J Airlaid Products
- Fitesa
- Elite Paper
- Main S.p.A.
- ACI S.A.
- National Nonwovens
- China Silk (Shanghai) New Material Technology
- Qiaohong New Materials
- C-airlaid
- Ningbo Qixing Nonwoven
* List not exhaustive
Sanitary Products Airlaid Paper Market Outlook 2023
1 Market Overview
1.1 Introduction to the Sanitary Products Airlaid Paper Market
1.2 Scope of the Study
1.3 Research Objective
1.3.1 Key Market Scope and Segments
1.3.2 Players Covered
1.3.3 Years Considered
2 Executive Summary
2.1 2023 Sanitary Products Airlaid Paper Industry- Market Statistics
3 Market Dynamics
3.1 Market Drivers
3.2 Market Challenges
3.3 Market Opportunities
3.4 Market Trends
4 Market Factor Analysis
4.1 Porter’s Five Forces
4.2 Market Entropy
4.2.1 Global Sanitary Products Airlaid Paper Market Companies with Area Served
4.2.2 Products Offerings Global Sanitary Products Airlaid Paper Market
5 COVID-19 Impact Analysis and Outlook Scenarios
5.1.1 Covid-19 Impact Analysis
5.1.2 Post-COVID-19 Scenario- Low Growth Case
5.1.3 Post-COVID-19 Scenario- Reference Growth Case
5.1.4 Post-COVID-19 Scenario- Low Growth Case
6 Global Sanitary Products Airlaid Paper Market Trends
6.1 Global Sanitary Products Airlaid Paper Revenue (USD Million) and CAGR (%) by Type (2018-2030)
6.2 Global Sanitary Products Airlaid Paper Revenue (USD Million) and CAGR (%) by Applications (2018-2030)
6.3 Global Sanitary Products Airlaid Paper Revenue (USD Million) and CAGR (%) by Regions (2018-2030)
7 Global Sanitary Products Airlaid Paper Market Revenue (USD Million) by Type, and Applications (2018-2022)
7.1 Global Sanitary Products Airlaid Paper Revenue (USD Million) by Type (2018-2022)
7.1.1 Global Sanitary Products Airlaid Paper Revenue (USD Million), Market Share (%) by Type (2018-2022)
7.2 Global Sanitary Products Airlaid Paper Revenue (USD Million) by Applications (2018-2022)
7.2.1 Global Sanitary Products Airlaid Paper Revenue (USD Million), Market Share (%) by Applications (2018-2022)
8 Global Sanitary Products Airlaid Paper Development Regional Status and Outlook
8.1 Global Sanitary Products Airlaid Paper Revenue (USD Million) By Regions (2018-2022)
8.2 North America Sanitary Products Airlaid Paper Revenue (USD Million) by Type, and Application (2018-2022)
8.2.1 North America Sanitary Products Airlaid Paper Revenue (USD Million) by Country (2018-2022)
8.2.2 North America Sanitary Products Airlaid Paper Revenue (USD Million) by Type (2018-2022)
8.2.3 North America Sanitary Products Airlaid Paper Revenue (USD Million) by Applications (2018-2022)
8.3 Europe Sanitary Products Airlaid Paper Revenue (USD Million), by Type, and Applications (USD Million) (2018-2022)
8.3.1 Europe Sanitary Products Airlaid Paper Revenue (USD Million), by Country (2018-2022)
8.3.2 Europe Sanitary Products Airlaid Paper Revenue (USD Million) by Type (2018-2022)
8.3.3 Europe Sanitary Products Airlaid Paper Revenue (USD Million) by Applications (2018-2022)
8.4 Asia Pacific Sanitary Products Airlaid Paper Revenue (USD Million), and Revenue (USD Million) by Type, and Applications (2018-2022)
8.4.1 Asia Pacific Sanitary Products Airlaid Paper Revenue (USD Million) by Country (2018-2022)
8.4.2 Asia Pacific Sanitary Products Airlaid Paper Revenue (USD Million) by Type (2018-2022)
8.4.3 Asia Pacific Sanitary Products Airlaid Paper Revenue (USD Million) by Applications (2018-2022)
8.5 South America Sanitary Products Airlaid Paper Revenue (USD Million), by Type, and Applications (2018-2022)
8.5.1 South America Sanitary Products Airlaid Paper Revenue (USD Million), by Country (2018-2022)
8.5.2 South America Sanitary Products Airlaid Paper Revenue (USD Million) by Type (2018-2022)
8.5.3 South America Sanitary Products Airlaid Paper Revenue (USD Million) by Applications (2018-2022)
8.6 Middle East and Africa Sanitary Products Airlaid Paper Revenue (USD Million), by Type, Technology, Application, Thickness (2018-2022)
8.6.1 Middle East and Africa Sanitary Products Airlaid Paper Revenue (USD Million) by Country (2018-2022)
8.6.2 Middle East and Africa Sanitary Products Airlaid Paper Revenue (USD Million) by Type (2018-2022)
8.6.3 Middle East and Africa Sanitary Products Airlaid Paper Revenue (USD Million) by Applications (2018-2022)
9 Company Profiles
10 Global Sanitary Products Airlaid Paper Market Revenue (USD Million), by Type, and Applications (2023-2030)
10.1 Global Sanitary Products Airlaid Paper Revenue (USD Million) and Market Share (%) by Type (2023-2030)
10.1.1 Global Sanitary Products Airlaid Paper Revenue (USD Million), and Market Share (%) by Type (2023-2030)
10.2 Global Sanitary Products Airlaid Paper Revenue (USD Million) and Market Share (%) by Applications (2023-2030)
10.2.1 Global Sanitary Products Airlaid Paper Revenue (USD Million), and Market Share (%) by Applications (2023-2030)
11 Global Sanitary Products Airlaid Paper Development Regional Status and Outlook Forecast
11.1 Global Sanitary Products Airlaid Paper Revenue (USD Million) By Regions (2023-2030)
11.2 North America Sanitary Products Airlaid Paper Revenue (USD Million) by Type, and Applications (2023-2030)
11.2.1 North America Sanitary Products Airlaid Paper Revenue (USD) Million by Country (2023-2030)
11.2.2 North America Sanitary Products Airlaid Paper Revenue (USD Million), by Type (2023-2030)
11.2.3 North America Sanitary Products Airlaid Paper Revenue (USD Million), Market Share (%) by Applications (2023-2030)
11.3 Europe Sanitary Products Airlaid Paper Revenue (USD Million), by Type, and Applications (2023-2030)
11.3.1 Europe Sanitary Products Airlaid Paper Revenue (USD Million), by Country (2023-2030)
11.3.2 Europe Sanitary Products Airlaid Paper Revenue (USD Million), by Type (2023-2030)
11.3.3 Europe Sanitary Products Airlaid Paper Revenue (USD Million), by Applications (2023-2030)
11.4 Asia Pacific Sanitary Products Airlaid Paper Revenue (USD Million) by Type, and Applications (2023-2030)
11.4.1 Asia Pacific Sanitary Products Airlaid Paper Revenue (USD Million), by Country (2023-2030)
11.4.2 Asia Pacific Sanitary Products Airlaid Paper Revenue (USD Million), by Type (2023-2030)
11.4.3 Asia Pacific Sanitary Products Airlaid Paper Revenue (USD Million), by Applications (2023-2030)
11.5 South America Sanitary Products Airlaid Paper Revenue (USD Million), by Type, and Applications (2023-2030)
11.5.1 South America Sanitary Products Airlaid Paper Revenue (USD Million), by Country (2023-2030)
11.5.2 South America Sanitary Products Airlaid Paper Revenue (USD Million), by Type (2023-2030)
11.5.3 South America Sanitary Products Airlaid Paper Revenue (USD Million), by Applications (2023-2030)
11.6 Middle East and Africa Sanitary Products Airlaid Paper Revenue (USD Million), by Type, and Applications (2023-2030)
11.6.1 Middle East and Africa Sanitary Products Airlaid Paper Revenue (USD Million), by Region (2023-2030)
11.6.2 Middle East and Africa Sanitary Products Airlaid Paper Revenue (USD Million), by Type (2023-2030)
11.6.3 Middle East and Africa Sanitary Products Airlaid Paper Revenue (USD Million), by Applications (2023-2030)
12 Methodology and Data Sources
12.1 Methodology/Research Approach
12.1.1 Research Programs/Design
12.1.2 Market Size Estimation
12.1.3 Market Breakdown and Data Triangulation
12.2 Data Sources
12.2.1 Secondary Sources
12.2.2 Primary Sources
12.3 Disclaimer
List of Tables
Table 1 Market Segmentation Analysis
Table 2 Global Sanitary Products Airlaid Paper Market Companies with Areas Served
Table 3 Products Offerings Global Sanitary Products Airlaid Paper Market
Table 4 Low Growth Scenario Forecasts
Table 5 Reference Case Growth Scenario
Table 6 High Growth Case Scenario
Table 7 Global Sanitary Products Airlaid Paper Revenue (USD Million) And CAGR (%) By Type (2018-2030)
Table 8 Global Sanitary Products Airlaid Paper Revenue (USD Million) And CAGR (%) By Applications (2018-2030)
Table 9 Global Sanitary Products Airlaid Paper Revenue (USD Million) And CAGR (%) By Regions (2018-2030)
Table 10 Global Sanitary Products Airlaid Paper Revenue (USD Million) By Type (2018-2022)
Table 11 Global Sanitary Products Airlaid Paper Revenue Market Share (%) By Type (2018-2022)
Table 12 Global Sanitary Products Airlaid Paper Revenue (USD Million) By Applications (2018-2022)
Table 13 Global Sanitary Products Airlaid Paper Revenue Market Share (%) By Applications (2018-2022)
Table 14 Global Sanitary Products Airlaid Paper Market Revenue (USD Million) By Regions (2018-2022)
Table 15 Global Sanitary Products Airlaid Paper Market Share (%) By Regions (2018-2022)
Table 16 North America Sanitary Products Airlaid Paper Revenue (USD Million) By Country (2018-2022)
Table 17 North America Sanitary Products Airlaid Paper Revenue (USD Million) By Type (2018-2022)
Table 18 North America Sanitary Products Airlaid Paper Revenue (USD Million) By Applications (2018-2022)
Table 19 Europe Sanitary Products Airlaid Paper Revenue (USD Million) By Country (2018-2022)
Table 20 Europe Sanitary Products Airlaid Paper Revenue (USD Million) By Type (2018-2022)
Table 21 Europe Sanitary Products Airlaid Paper Revenue (USD Million) By Applications (2018-2022)
Table 22 Asia Pacific Sanitary Products Airlaid Paper Revenue (USD Million) By Country (2018-2022)
Table 23 Asia Pacific Sanitary Products Airlaid Paper Revenue (USD Million) By Type (2018-2022)
Table 24 Asia Pacific Sanitary Products Airlaid Paper Revenue (USD Million) By Applications (2018-2022)
Table 25 South America Sanitary Products Airlaid Paper Revenue (USD Million) By Country (2018-2022)
Table 26 South America Sanitary Products Airlaid Paper Revenue (USD Million) By Type (2018-2022)
Table 27 South America Sanitary Products Airlaid Paper Revenue (USD Million) By Applications (2018-2022)
Table 28 Middle East and Africa Sanitary Products Airlaid Paper Revenue (USD Million) By Region (2018-2022)
Table 29 Middle East and Africa Sanitary Products Airlaid Paper Revenue (USD Million) By Type (2018-2022)
Table 30 Middle East and Africa Sanitary Products Airlaid Paper Revenue (USD Million) By Applications (2018-2022)
Table 31 Financial Analysis
Table 32 Global Sanitary Products Airlaid Paper Revenue (USD Million) By Type (2023-2030)
Table 33 Global Sanitary Products Airlaid Paper Revenue Market Share (%) By Type (2023-2030)
Table 34 Global Sanitary Products Airlaid Paper Revenue (USD Million) By Applications (2023-2030)
Table 35 Global Sanitary Products Airlaid Paper Revenue Market Share (%) By Applications (2023-2030)
Table 36 Global Sanitary Products Airlaid Paper Market Revenue (USD Million), And Revenue (USD Million) By Regions (2023-2030)
Table 37 North America Sanitary Products Airlaid Paper Revenue (USD)By Country (2023-2030)
Table 38 North America Sanitary Products Airlaid Paper Revenue (USD Million) By Type (2023-2030)
Table 39 North America Sanitary Products Airlaid Paper Revenue (USD Million) By Applications (2023-2030)
Table 40 Europe Sanitary Products Airlaid Paper Revenue (USD Million) By Country (2023-2030)
Table 41 Europe Sanitary Products Airlaid Paper Revenue (USD Million) By Type (2023-2030)
Table 42 Europe Sanitary Products Airlaid Paper Revenue (USD Million) By Applications (2023-2030)
Table 43 Asia Pacific Sanitary Products Airlaid Paper Revenue (USD Million) By Country (2023-2030)
Table 44 Asia Pacific Sanitary Products Airlaid Paper Revenue (USD Million) By Type (2023-2030)
Table 45 Asia Pacific Sanitary Products Airlaid Paper Revenue (USD Million) By Applications (2023-2030)
Table 46 South America Sanitary Products Airlaid Paper Revenue (USD Million) By Country (2023-2030)
Table 47 South America Sanitary Products Airlaid Paper Revenue (USD Million) By Type (2023-2030)
Table 48 South America Sanitary Products Airlaid Paper Revenue (USD Million) By Applications (2023-2030)
Table 49 Middle East and Africa Sanitary Products Airlaid Paper Revenue (USD Million) By Region (2023-2030)
Table 50 Middle East and Africa Sanitary Products Airlaid Paper Revenue (USD Million) By Region (2023-2030)
Table 51 Middle East and Africa Sanitary Products Airlaid Paper Revenue (USD Million) By Type (2023-2030)
Table 52 Middle East and Africa Sanitary Products Airlaid Paper Revenue (USD Million) By Applications (2023-2030)
Table 53 Research Programs/Design for This Report
Table 54 Key Data Information from Secondary Sources
Table 55 Key Data Information from Primary Sources
List of Figures
Figure 1 Market Scope
Figure 2 Porter’s Five Forces
Figure 3 Global Sanitary Products Airlaid Paper Revenue (USD Million) By Type (2018-2022)
Figure 4 Global Sanitary Products Airlaid Paper Revenue Market Share (%) By Type (2022)
Figure 5 Global Sanitary Products Airlaid Paper Revenue (USD Million) By Applications (2018-2022)
Figure 6 Global Sanitary Products Airlaid Paper Revenue Market Share (%) By Applications (2022)
Figure 7 Global Sanitary Products Airlaid Paper Market Revenue (USD Million) By Regions (2018-2022)
Figure 8 Global Sanitary Products Airlaid Paper Market Share (%) By Regions (2022)
Figure 9 North America Sanitary Products Airlaid Paper Revenue (USD Million) By Country (2018-2022)
Figure 10 North America Sanitary Products Airlaid Paper Revenue (USD Million) By Type (2018-2022)
Figure 11 North America Sanitary Products Airlaid Paper Revenue (USD Million) By Applications (2018-2022)
Figure 12 Europe Sanitary Products Airlaid Paper Revenue (USD Million) By Country (2018-2022)
Figure 13 Europe Sanitary Products Airlaid Paper Revenue (USD Million) By Type (2018-2022)
Figure 14 Europe Sanitary Products Airlaid Paper Revenue (USD Million) By Applications (2018-2022)
Figure 15 Asia Pacific Sanitary Products Airlaid Paper Revenue (USD Million) By Country (2018-2022)
Figure 16 Asia Pacific Sanitary Products Airlaid Paper Revenue (USD Million) By Type (2018-2022)
Figure 17 Asia Pacific Sanitary Products Airlaid Paper Revenue (USD Million) By Applications (2018-2022)
Figure 18 South America Sanitary Products Airlaid Paper Revenue (USD Million) By Country (2018-2022)
Figure 19 South America Sanitary Products Airlaid Paper Revenue (USD Million) By Type (2018-2022)
Figure 20 South America Sanitary Products Airlaid Paper Revenue (USD Million) By Applications (2018-2022)
Figure 21 Middle East and Africa Sanitary Products Airlaid Paper Revenue (USD Million) By Region (2018-2022)
Figure 22 Middle East and Africa Sanitary Products Airlaid Paper Revenue (USD Million) By Type (2018-2022)
Figure 23 Middle East and Africa Sanitary Products Airlaid Paper Revenue (USD Million) By Applications (2018-2022)
Figure 24 Global Sanitary Products Airlaid Paper Revenue (USD Million) By Type (2023-2030)
Figure 25 Global Sanitary Products Airlaid Paper Revenue Market Share (%) By Type (2030)
Figure 26 Global Sanitary Products Airlaid Paper Revenue (USD Million) By Applications (2023-2030)
Figure 27 Global Sanitary Products Airlaid Paper Revenue Market Share (%) By Applications (2030)
Figure 28 Global Sanitary Products Airlaid Paper Market Revenue (USD Million) By Regions (2023-2030)
Figure 29 North America Sanitary Products Airlaid Paper Revenue (USD Million) By Country (2023-2030)
Figure 30 North America Sanitary Products Airlaid Paper Revenue (USD Million) By Type (2023-2030)
Figure 31 North America Sanitary Products Airlaid Paper Revenue (USD Million) By Applications (2023-2030)
Figure 32 Europe Sanitary Products Airlaid Paper Revenue (USD Million) By Country (2023-2030)
Figure 33 Europe Sanitary Products Airlaid Paper Revenue (USD Million) By Type (2023-2030)
Figure 34 Europe Sanitary Products Airlaid Paper Revenue (USD Million) By Applications (2023-2030)
Figure 35 Asia Pacific Sanitary Products Airlaid Paper Revenue (USD Million) By Country (2023-2030)
Figure 36 Asia Pacific Sanitary Products Airlaid Paper Revenue (USD Million) By Type (2023-2030)
Figure 37 Asia Pacific Sanitary Products Airlaid Paper Revenue (USD Million) By Applications (2023-2030)
Figure 38 South America Sanitary Products Airlaid Paper Revenue (USD Million) By Country (2023-2030)
Figure 39 South America Sanitary Products Airlaid Paper Revenue (USD Million) By Type (2023-2030)
Figure 40 South America Sanitary Products Airlaid Paper Revenue (USD Million) By Applications (2023-2030)
Figure 41 Middle East and Africa Sanitary Products Airlaid Paper Revenue (USD Million) By Region (2023-2030)
Figure 42 Middle East and Africa Sanitary Products Airlaid Paper Revenue (USD Million) By Region (2023-2030)
Figure 43 Middle East and Africa Sanitary Products Airlaid Paper Revenue (USD Million) By Type (2023-2030)
Figure 44 Middle East and Africa Sanitary Products Airlaid Paper Revenue (USD Million) By Applications (2023-2030)
Figure 45 Bottom-Up and Top-Down Approaches For This Report
Figure 46 Data Triangulation
