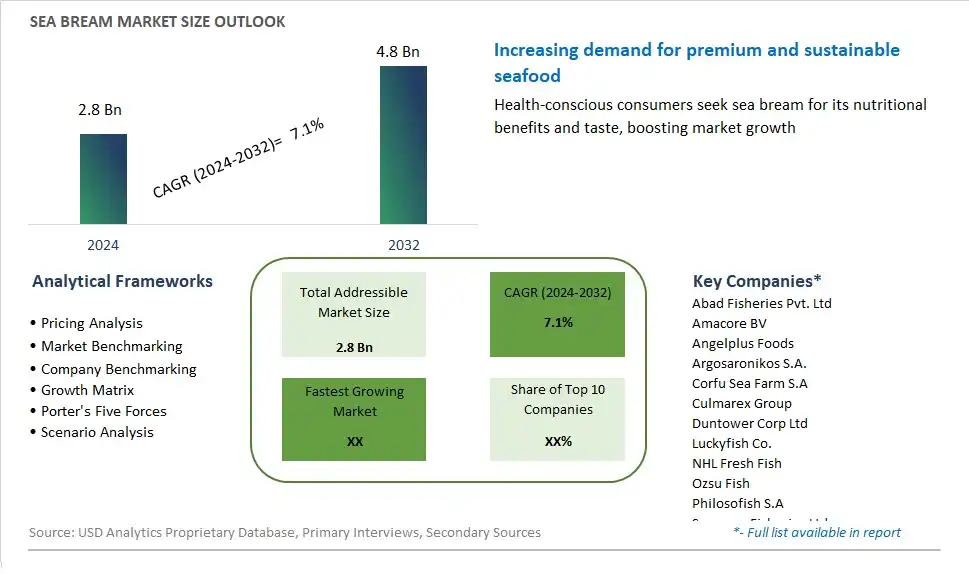
Global Sea Bream Market Size is valued at $2.8 Billion in 2024 and is forecast to register a growth rate (CAGR) of 7.1% to reach $4.8 Billion by 2032.
The global Sea Bream Market Comprehensive Study analyzes and forecasts the market size across 6 regions and 24 countries for diverse segments -By End-User (Food Service Provider, Retail, Food Processing, Animal Feed)
An Introduction to Sea Bream Market
In 2024, the sea bream market is experiencing significant growth, driven by increasing demand for high-quality, nutritious, and sustainably sourced seafood. Sea bream, prized for its delicate flavor and firm texture, is a popular choice in both home cooking and fine dining. The market is characterized by advancements in aquaculture techniques, improving yield and quality while ensuring environmental sustainability. The rise of health-conscious consumers seeking lean protein sources is also boosting demand. Major producing regions in the Mediterranean and Asia are focusing on expanding their aquaculture operations and adhering to stringent quality standards to meet global demand.
Sea Bream Competitive Landscape
The market report analyses the leading companies in the industry including Abad Fisheries Pvt. Ltd, Amacore BV, Angelplus Foods, Argosaronikos S.A., Corfu Sea Farm S.A, Culmarex Group, Duntower Corp Ltd, Luckyfish Co., NHL Fresh Fish, Ozsu Fish, Philosofish S.A, Seawave Fisheries Ltd, Selonda Aquaculture SA, Tokai Seapro Co. Ltd, and Others.
Sea Bream Market Dynamics
Sea Bream Market Trend: Increasing Demand for Sustainable and Ethically Sourced Seafood
A prominent market trend in the sea bream segment is the increasing demand for sustainable and ethically sourced seafood. With growing concerns about overfishing, habitat destruction, and marine conservation, consumers are seeking seafood products that are sourced and harvested in an environmentally responsible manner. Sea bream, known for its delicate flavor and versatile culinary applications, is gaining popularity among consumers looking for sustainably sourced fish options. This trend is driven by a heightened awareness of the importance of marine conservation, ethical consumerism, and the desire to support fisheries and aquaculture practices that prioritize sustainability and biodiversity preservation.
Market Driver: Growing Consumer Interest in Healthy and Nutritious Seafood Options
The market driver for sea bream is the growing consumer interest in healthy and nutritious seafood options. Seafood, including sea bream, is valued for its high protein content, omega-3 fatty acids, and essential nutrients, making it a popular choice for health-conscious consumers seeking nutritious and balanced diets. As consumers become more educated about the health benefits of seafood consumption, there is increasing demand for fish species like sea bream that offer a healthy and flavorful protein source. This driver is reinforced by dietary trends emphasizing whole foods, Mediterranean-style diets, and seafood-rich eating patterns that prioritize health and wellness.
Market Opportunity: Expansion into Premium and Value-Added Seafood Products
One potential opportunity for the sea bream market lies in the expansion into premium and value-added seafood products. While whole sea bream is commonly sold fresh or frozen in markets and seafood counters, there is an opportunity to develop value-added products that cater to different consumer preferences and usage occasions. This includes products such as pre-marinated sea bream fillets, ready-to-cook seafood kits, smoked sea bream, or gourmet seafood meals featuring sea bream as a premium ingredient. By offering convenient and innovative seafood solutions that appeal to busy consumers and food enthusiasts alike, sea bream suppliers can capitalize on emerging market trends and create additional value within the seafood category.
Sea Bream Market Share Analysis: Retail Segment held the dominant market share in 2024
In the Sea Bream Market, the retail segment takes the lead as the largest, driven by the widespread consumer demand for fresh and frozen sea bream products for home consumption. Retail outlets such as supermarkets, fish markets, and specialty seafood stores cater to individual consumers seeking high-quality seafood for their meals. The retail segment benefits from its direct access to consumers and offers a diverse range of sea bream products tailored to different preferences and culinary needs. Additionally, the rising trend of home cooking and increased consumer awareness of the health benefits associated with seafood consumption further contribute to the growth of the retail segment. As consumers continue to prioritize convenience and quality in their seafood purchases, the retail segment remains pivotal in shaping the sea bream market landscape, poised for sustained growth in the foreseeable future.
Sea Bream Market Segmentation
By End-User
Food Service Provider
Retail
Food Processing
Animal Feed
Countries Analyzed
North America (US, Canada, Mexico)
Europe (Germany, UK, France, Spain, Italy, Russia, Rest of Europe)
Asia Pacific (China, India, Japan, South Korea, Australia, South East Asia, Rest of Asia)
South America (Brazil, Argentina, Rest of South America)
Middle East and Africa (Saudi Arabia, UAE, Rest of Middle East, South Africa, Egypt, Rest of Africa)
Sea Bream Companies Profiled in the Study
Abad Fisheries Pvt. Ltd
Amacore BV
Angelplus Foods
Argosaronikos S.A.
Corfu Sea Farm S.A
Culmarex Group
Duntower Corp Ltd
Luckyfish Co.
NHL Fresh Fish
Ozsu Fish
Philosofish S.A
Seawave Fisheries Ltd
Selonda Aquaculture SA
Tokai Seapro Co. Ltd
*- List Not Exhaustive
Chapter 1. TABLE OF CONTENTS
Chapter 2. Introduction to Sea Bream Market
2.1. Market Overview
2.2. Key Statistics and Report Highlights
2.3. Scope of the Comprehensive Study
2.3.1. Market Definition
2.3.2 Countries and Regions Covered
2.3.3 Research Objective
2.3.4 Units, Currency, and Conversions
2.3.5 Industry Value Chain
2.4. Key Market Segments
2.5. Key Companies
2.6. Study Period
Chapter 3. Strategic Analysis Review
3.1. Sea Bream Pricing Analysis and Forecast
3.2. Porter’s Five Forces
3.3. Market Ecosystem
3.4. SWOT Analysis
3.5. Regulatory Scenario
3.3. Effects of Inflation, Russia-Ukraine War, moderating economic growth, and other macroeconomic factors
Chapter 4. Competitive Landscape
4.1. Market Share Analysis
4.1.1. Global Sea Bream Market Share by Company, 2023
4.1.2. Product Offerings of Leading Sea Bream Companies
4.2. Market Entropy
4.2.1. New Product Launches in the Industry
4.2.2. Mergers, Acquisitions, Joint ventures, and Partnerships
4.3. Key Strategies and Best Practices
Chapter 5. Global Market Projections: Best, Reference, and Low Case Scenarios
5.1. Growth Analysis- Case Scenario Definitions
5.2. Low Growth Case Scenario Forecasts
5.3. Reference Growth Case Scenario Forecasts
5.4. High Growth Case Scenario Forecasts
Chapter 6. Market Dynamics
6.1. Sea Bream Market Drivers
6.2. Sea Bream Market Challenges
6.6. Sea Bream Market Opportunities
6.4. Sea Bream Market Trends
Chapter 7. Global Sea Bream Market Outlook Trends
7.1. Global Sea Bream Revenue (USD Million) and CAGR (%) by Type (2021-2032)
7.2. Global Sea Bream Revenue (USD Million) and CAGR (%) by Application (2021-2032)
7.3. Global Sea Bream Revenue (USD Million) and CAGR (%) by Product (2021-2032)
By End-User
Food Service Provider
Retail
Food Processing
Animal Feed
Chapter 8. Global Sea Bream Regional Analysis and Outlook
8.1. Global Sea Bream Revenue (USD Million) By Regions (2021- 2032)
8.2. North America Sea Bream Revenue (USD Million) by Country (2021-2032)
8.2.1. United States Sea Bream Regional Analysis and Outlook
8.2.2. Canada Sea Bream Regional Analysis and Outlook
8.2.3. Mexico Sea Bream Regional Analysis and Outlook
8.3. Europe Sea Bream Revenue (USD Million), by Country (2021-2032)
8.3.1. Germany Sea Bream Regional Analysis and Outlook
8.3.2. France Sea Bream Regional Analysis and Outlook
8.3.3. United Kingdom Sea Bream Regional Analysis and Outlook
8.3.4. Spain Sea Bream Regional Analysis and Outlook
8.3.5. Italy Sea Bream Regional Analysis and Outlook
8.3.6. Russia Sea Bream Regional Analysis and Outlook
8.3.7. Rest of Europe Sea Bream Regional Analysis and Outlook
8.4. Asia Pacific Sea Bream Revenue (USD Million) by Country (2021-2032)
8.4.1. China Sea Bream Regional Analysis and Outlook
8.4.2. Japan Sea Bream Regional Analysis and Outlook
8.4.3. India Sea Bream Regional Analysis and Outlook
8.4.4. South Korea Sea Bream Regional Analysis and Outlook
8.4.5. Australia Sea Bream Regional Analysis and Outlook
8.4.6. South East Asia Sea Bream Regional Analysis and Outlook
8.4.7. Rest of Asia Pacific Sea Bream Regional Analysis and Outlook
8.5. South America Sea Bream Revenue (USD Million), by Country (2021-2032)
8.5.1. Brazil Sea Bream Regional Analysis and Outlook
8.5.2. Argentina Sea Bream Regional Analysis and Outlook
8.5.3. Rest of South America Sea Bream Regional Analysis and Outlook
8.6. Middle East and Africa Sea Bream Revenue (USD Million) by Country (2021-2032)
8.6.1. Middle East Sea Bream Regional Analysis and Outlook
8.6.2. Africa Sea Bream Regional Analysis and Outlook
Chapter 9. North America Sea Bream Analysis and Outlook
9.1. North America Sea Bream Revenue (USD Million) by Segments (2021-2032)
9.1.1. North America Sea Bream Revenue (USD Million) by Type (2021-2032)
9.1.2. North America Sea Bream Revenue (USD Million) by Application (2021-2032)
9.1.3. North America Sea Bream Revenue (USD Million) by Product (2021-2032)
By End-User
Food Service Provider
Retail
Food Processing
Animal Feed
Chapter 10. Europe Sea Bream Analysis and Outlook
10.1. Europe Sea Bream Revenue (USD Million), by Segments (USD Million) (2021-2032)
10.1.1. Europe Sea Bream Revenue (USD Million) by Type (2021-2032)
10.1.2. Europe Sea Bream Revenue (USD Million) by Application (2021-2032)
10.1.3. Europe Sea Bream Revenue (USD Million) by Product (2021-2032)
By End-User
Food Service Provider
Retail
Food Processing
Animal Feed
Chapter 11. Asia Pacific Sea Bream Analysis and Outlook
11.1. Asia Pacific Sea Bream Revenue (USD Million), and Revenue (USD Million) by Segments (2021-2032)
11.1.1. Asia Pacific Sea Bream Revenue (USD Million) by Type (2021-2032)
11.1.2. Asia Pacific Sea Bream Revenue (USD Million) by Application (2021-2032)
11.1.3. Asia Pacific Sea Bream Revenue (USD Million) by Product (2021-2032)
By End-User
Food Service Provider
Retail
Food Processing
Animal Feed
Chapter 12. South America Sea Bream Analysis and Outlook
12.1. South America Sea Bream Revenue (USD Million), by Segments (2021-2032)
12.1.1. South America Sea Bream Revenue (USD Million) by Type (2021-2032)
12.1.2. South America Sea Bream Revenue (USD Million) by Application (2021-2032)
12.1.3. South America Sea Bream Revenue (USD Million) by Product (2021-2032)
By End-User
Food Service Provider
Retail
Food Processing
Animal Feed
Chapter 13. Middle East and Africa Sea Bream Analysis and Outlook
13.1. Middle East and Africa Sea Bream Revenue (USD Million), by Segments (2021-2032)
13.1.1. Middle East and Africa Sea Bream Revenue (USD Million) by Type (2021-2032)
13.1.2. Middle East and Africa Sea Bream Revenue (USD Million) by Application (2021-2032)
13.1.3. Middle East and Africa Sea Bream Revenue (USD Million) by Product (2021-2032)
By End-User
Food Service Provider
Retail
Food Processing
Animal Feed
Chapter 14. Sea Bream Company Profiles
14.1 Business Overview
14.2 Product Profiles
14.3 SWOT Profiles
14.5 Recent Developments
14.6 Financial Profile
List of Companies
Abad Fisheries Pvt. Ltd
Amacore BV
Angelplus Foods
Argosaronikos S.A.
Corfu Sea Farm S.A
Culmarex Group
Duntower Corp Ltd
Luckyfish Co.
NHL Fresh Fish
Ozsu Fish
Philosofish S.A
Seawave Fisheries Ltd
Selonda Aquaculture SA
Tokai Seapro Co. Ltd
15. Methodology and Data Sources
15.1 Customization Offerings
15.2 Subscription Services
15.3 Related Reports
15.4 Publisher Expertise
LIST OF TABLES
Table 1 Market Segmentation Analysis
Table 2 Global Sea Bream Market Share of Leading Companies, 2023
Table 3 Product Offerings of Leading Companies
Table 4 Low Growth Scenario Forecasts
Table 5 Reference Case Growth Scenario
Table 6 High Growth Case Scenario
Table 7 Global Sea Bream Revenue (USD Million) And CAGR (%) By Type (2021-2032)
Table 8 Global Sea Bream Revenue (USD Million) And CAGR (%) By Application (2021-2032)
Table 9 Global Sea Bream Revenue (USD Million) And CAGR (%) By Product (2021-2032)
Table 10 Global Sea Bream Market Revenue (USD Million) By Regions (2021-2032)
Table 11 Global Sea Bream Market Share (%) By Regions (2021-2032)
Table 12 North America Sea Bream Revenue (USD Million) By Country (2021-2032)
Table 13 Europe Sea Bream Revenue (USD Million) By Country (2021-2032)
Table 14 Asia Pacific Sea Bream Revenue (USD Million) By Country (2021-2032)
Table 15 South America Sea Bream Revenue (USD Million) By Country (2021-2032)
Table 16 Middle East and Africa Sea Bream Revenue (USD Million) By Region (2021-2032)
Table 17 North America Sea Bream Revenue (USD Million) By Type (2021-2032)
Table 18 North America Sea Bream Revenue (USD Million) By Application (2021-2032)
Table 19 North America Sea Bream Revenue (USD Million) By Product (2021-2032)
Table 20 Europe Sea Bream Revenue (USD Million) By Type (2021-2032)
Table 21 Europe Sea Bream Revenue (USD Million) By Application (2021-2032)
Table 22 Europe Sea Bream Revenue (USD Million) By Product (2021-2032)
Table 23 Asia Pacific Sea Bream Revenue (USD Million) By Type (2021-2032)
Table 24 Asia Pacific Sea Bream Revenue (USD Million) By Application (2021-2032)
Table 25 Asia Pacific Sea Bream Revenue (USD Million) By Product (2021-2032)
Table 26 South America Sea Bream Revenue (USD Million) By Type (2021-2032)
Table 27 South America Sea Bream Revenue (USD Million) By Application (2021-2032)
Table 28 South America Sea Bream Revenue (USD Million) By Product (2021-2032)
Table 29 Middle East and Africa Sea Bream Revenue (USD Million) By Type (2021-2032)
Table 30 Middle East and Africa Sea Bream Revenue (USD Million) By Application (2021-2032)
Table 31 Middle East and Africa Sea Bream Revenue (USD Million) By Product (2021-2032)
LIST OF FIGURES
Figure 1. Market Scope
Figure 2. Pricing Forecasts Per Unit, 2023- 2032
Figure 3. Porter’s Five Forces
Figure 4. Global Sea Bream Market Revenue (USD Million) By Regions (2021-2032)
Figure 5. Global Sea Bream Market Share (%) By Regions (2023)
Figure 6. North America Sea Bream Revenue (USD Million) By Country (2021-2032)
Figure 7. United States Sea Bream Revenue (USD Million) By Country (2021-2032)
Figure 8. Canada Sea Bream Revenue (USD Million) By Country (2021-2032)
Figure 9. Mexico Sea Bream Revenue (USD Million) By Country (2021-2032)
Figure 10. Europe Sea Bream Revenue (USD Million) By Country (2021-2032)
Figure 11. Germany Sea Bream Revenue (USD Million) By Country (2021-2032)
Figure 12. France Sea Bream Revenue (USD Million) By Country (2021-2032)
Figure 13. United Kingdom Sea Bream Revenue (USD Million) By Country (2021-2032)
Figure 14. Spain Sea Bream Revenue (USD Million) By Country (2021-2032)
Figure 15. Italy Sea Bream Revenue (USD Million) By Country (2021-2032)
Figure 16. Russia Sea Bream Revenue (USD Million) By Country (2021-2032)
Figure 17. Rest of Europe Sea Bream Revenue (USD Million) By Country (2021-2032)
Figure 11. Asia Pacific Sea Bream Revenue (USD Million) By Country (2021-2032)
Figure 12. China Sea Bream Revenue (USD Million) By Country (2021-2032)
Figure 13. Japan Sea Bream Revenue (USD Million) By Country (2021-2032)
Figure 14. India Sea Bream Revenue (USD Million) By Country (2021-2032)
Figure 15. South Korea Sea Bream Revenue (USD Million) By Country (2021-2032)
Figure 16. Australia Sea Bream Revenue (USD Million) By Country (2021-2032)
Figure 17. South East Asia Sea Bream Revenue (USD Million) By Country (2021-2032)
Figure 18. South America Sea Bream Revenue (USD Million) By Country (2021-2032)
Figure 19. Brazil Sea Bream Revenue (USD Million) By Country (2021-2032)
Figure 20. Argentina Sea Bream Revenue (USD Million) By Country (2021-2032)
Figure 21. Rest of Asia Pacific Sea Bream Revenue (USD Million) By Country (2021-2032)
Figure 22. Middle East and Africa Sea Bream Revenue (USD Million) By Region (2021-2032)
Figure 23. Saudi Arabia Sea Bream Revenue (USD Million) By Region (2021-2032)
Figure 24. The UAE Sea Bream Revenue (USD Million) By Region (2021-2032)
Figure 25. Rest of Middle East Sea Bream Revenue (USD Million) By Region (2021-2032)
Figure 26. South Africa Sea Bream Revenue (USD Million) By Region (2021-2032)
Figure 27. Africa Sea Bream Revenue (USD Million) By Region (2021-2032)
Figure 28. North America Sea Bream Revenue (USD Million) By Type (2021-2032)
Figure 29. North America Sea Bream Revenue (USD Million) By Application (2021-2032)
Figure 30. North America Sea Bream Revenue (USD Million) By Product (2021-2032)
Figure 31. Europe Sea Bream Revenue (USD Million) By Type (2021-2032)
Figure 32. Europe Sea Bream Revenue (USD Million) By Application (2021-2032)
Figure 33. Europe Sea Bream Revenue (USD Million) By Product (2021-2032)
Figure 34. Asia Pacific Sea Bream Revenue (USD Million) By Type (2021-2032)
Figure 35. Asia Pacific Sea Bream Revenue (USD Million) By Application (2021-2032)
Figure 36. Asia Pacific Sea Bream Revenue (USD Million) By Product (2021-2032)
Figure 37. South America Sea Bream Revenue (USD Million) By Type (2021-2032)
Figure 38. South America Sea Bream Revenue (USD Million) By Application (2021-2032)
Figure 39. South America Sea Bream Revenue (USD Million) By Product (2021-2032)
Figure 40. Middle East and Africa Sea Bream Revenue (USD Million) By Type (2021-2032)
Figure 41. Middle East and Africa Sea Bream Revenue (USD Million) By Application (2021-2032)
Figure 42. Middle East and Africa Sea Bream Revenue (USD Million) By Product (2021-2032)
By End-User
Food Service Provider
Retail
Food Processing
Animal Feed
Countries Analyzed
North America (US, Canada, Mexico)
Europe (Germany, UK, France, Spain, Italy, Russia, Rest of Europe)
Asia Pacific (China, India, Japan, South Korea, Australia, South East Asia, Rest of Asia)
South America (Brazil, Argentina, Rest of South America)
Middle East and Africa (Saudi Arabia, UAE, Rest of Middle East, South Africa, Egypt, Rest of Africa)
