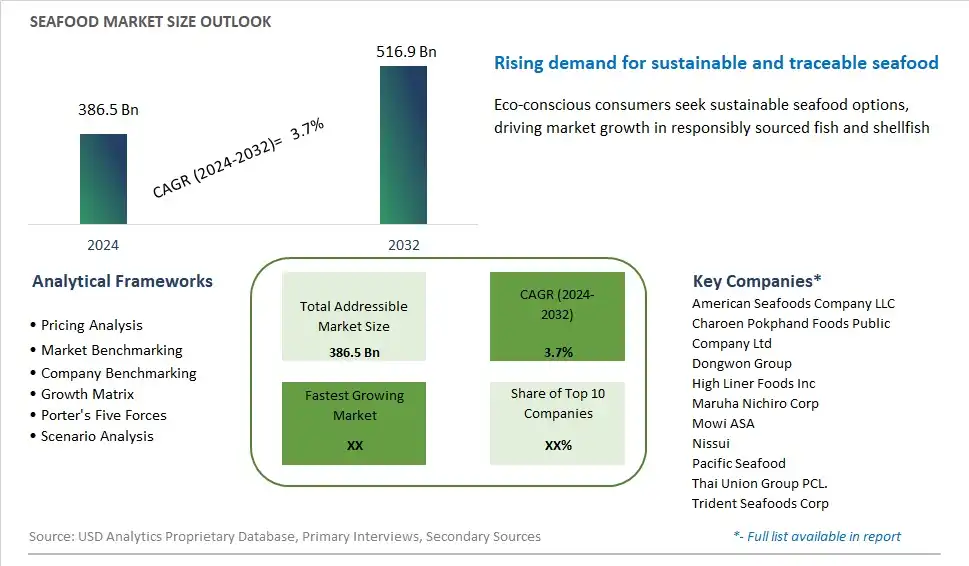
Global Seafood Market Size is valued at $386.5 Billion in 2024 and is forecast to register a growth rate (CAGR) of 3.7% to reach $516.9 Billion by 2032.
The global Seafood Market Comprehensive Study analyzes and forecasts the market size across 6 regions and 24 countries for diverse segments -By Type (Fish, Crustaceans, Mollusca, Lobsters, Crabs, Others), By Form (Fresh, Processed), By Distribution Channel (Supermarkets and Hypermarkets, Specialty Stores, Online Retail, Others)
An Introduction to Seafood Market
The seafood market in 2024 is witnessing dynamic shifts driven by changing consumer preferences, sustainability concerns, and technological advancements in aquaculture and fisheries. With increasing awareness of the health benefits of seafood consumption, there is a growing demand for diverse and sustainably sourced seafood products. From wild-caught fish to aquaculture-produced shrimp and salmon, consumers are seeking high-quality seafood options that meet their ethical and environmental standards. As seafood consumption becomes more mainstream, manufacturers are innovating with value-added products, convenient packaging solutions, and seafood alternatives to cater to evolving dietary preferences and lifestyle choices.
Seafood Competitive Landscape
The market report analyses the leading companies in the industry including American Seafoods Company LLC, Charoen Pokphand Foods Public Company Ltd, Dongwon Group, High Liner Foods Inc, Maruha Nichiro Corp, Mowi ASA, Nissui, Pacific Seafood, Thai Union Group PCL., Trident Seafoods Corp, and Others.
Seafood Market Dynamics
Seafood Market Trend: Increasing Consumer Preference for Sustainable and Traceable Seafood
One prominent trend in the seafood market is the rising demand for sustainable and traceable seafood products. Consumers are becoming more aware of environmental issues related to overfishing, habitat destruction, and bycatch, leading to a growing preference for seafood sourced from sustainable fisheries and aquaculture operations. This trend is driven by concerns about the long-term health of marine ecosystems and the desire to support ethical and responsible fishing practices. As a result, seafood suppliers and retailers are increasingly emphasizing transparency and traceability in their supply chains, providing consumers with information about the origins and sustainability certifications of their seafood products.
Market Driver: Health Benefits and Nutritional Value of Seafood
The main driver behind the seafood market's growth is the recognition of the health benefits and nutritional value of seafood consumption. Seafood is an excellent source of high-quality protein, essential omega-3 fatty acids, vitamins, and minerals, making it an important component of a balanced and nutritious diet. Scientific research has shown that regular consumption of seafood can contribute to heart health, brain function, and overall well-being, driving consumer interest in incorporating more seafood into their diets. Additionally, seafood is perceived as a healthier protein option compared to red meat and processed meats, appealing to health-conscious consumers seeking alternatives to conventional protein sources.
Market Opportunity: Expansion of Value-Added Seafood Products and Online Retail Channels
One potential opportunity within the seafood market lies in the expansion of value-added seafood products and online retail channels. Brands and retailers can capitalize on consumer demand for convenient and innovative seafood offerings by introducing value-added products such as pre-marinated seafood fillets, ready-to-cook meal kits, and gourmet seafood sauces. These products cater to consumers' busy lifestyles and offer easy-to-prepare meal solutions without compromising on taste or quality. Moreover, leveraging online retail channels and direct-to-consumer e-commerce platforms can enhance accessibility and convenience for consumers, allowing them to purchase a wider selection of seafood products from the comfort of their homes. By embracing digital technology and e-commerce capabilities, seafood suppliers and retailers can reach a broader audience and create personalized shopping experiences tailored to individual preferences, driving growth and profitability in the seafood market.
Seafood Market Share Analysis: Fish held the dominant market share in 2024
In the segmented landscape of the Seafood Market categorized by Type, the Fish segment is the largest and most prevalent, driven by several key factors. Fish is a widely consumed protein source globally, prized for its nutritional benefits, versatility in culinary applications, and diverse flavor profiles. Whether grilled, baked, fried, or incorporated into soups and stews, fish offers consumers a lean and healthy protein option rich in essential omega-3 fatty acids, vitamins, and minerals. Further, the abundance and variety of fish species available in both freshwater and saltwater environments contribute to its widespread popularity. Additionally, fish is integral to many cultural cuisines and culinary traditions worldwide, further driving its demand. While other segments such as crustaceans and mollusks also hold significance in the seafood market, the dominance of the Fish segment persists due to its widespread consumption and culinary versatility. As consumer preferences continue to prioritize healthy and sustainable food choices, the Fish segment is expected to maintain its dominance in the Seafood Market, driving overall market sales and growth.
Seafood Market Share Analysis: Processed market is poised to register the fastest growth rae over the forecast period to 2032
In the dynamic landscape of the Seafood Market segmented by Form, the Processed segment is the fastest-growing player, propelled by several key factors. Processed seafood products offer consumers convenient and ready-to-use options that require minimal preparation time compared to fresh seafood. Additionally, advancements in food processing and packaging technologies have improved the shelf life and safety of processed seafood, appealing to consumers seeking longer-lasting and convenient food options. Further, the growing demand for value-added seafood products such as pre-marinated fillets, breaded fish portions, and ready-to-eat seafood snacks contributes to the rapid growth of the Processed segment. Furthermore, the increasing popularity of processed seafood in the foodservice industry, including restaurants, hotels, and catering services, further drives the demand for these products. As consumers continue to prioritize convenience and efficiency in their seafood purchases, the Processed segment is expected to sustain its rapid growth trajectory in the Seafood Market, reshaping the way seafood is consumed and enjoyed.
Seafood Market Share Analysis: Supermarkets and Hypermarkets held the dominant market share in 2024
In the segmented landscape of the Seafood Market categorized by Distribution Channel, the Supermarkets and Hypermarkets segment emerge as the largest and most prevalent, driven by several key factors. Supermarkets and hypermarkets offer consumers a wide range of seafood options under one roof, providing convenience and accessibility. These retail giants have established supply chains and extensive distribution networks, ensuring consistent availability of fresh and frozen seafood products. Further, supermarkets and hypermarkets often invest in cold storage facilities and stringent quality control measures to maintain the freshness and safety of seafood products, instilling trust among consumers. Additionally, the visibility and strategic placement of seafood displays within these stores encourage impulse purchases and consumer engagement. While other distribution channels such as specialty stores and online retail platforms cater to niche markets, the dominance of Supermarkets and Hypermarkets persists due to their widespread presence and consumer appeal. As consumers continue to prioritize convenience and variety in their seafood purchases, the Supermarkets and Hypermarkets segment is expected to maintain its dominance in the Seafood Market, driving overall market sales and growth.
Seafood Market Segmentation
By Type
Fish
Crustaceans
Mollusca
Lobsters
Crabs
Others
By Form
Fresh
Processed
By Distribution Channel
Supermarkets and Hypermarkets
Specialty Stores
Online Retail
Others
Countries Analyzed
North America (US, Canada, Mexico)
Europe (Germany, UK, France, Spain, Italy, Russia, Rest of Europe)
Asia Pacific (China, India, Japan, South Korea, Australia, South East Asia, Rest of Asia)
South America (Brazil, Argentina, Rest of South America)
Middle East and Africa (Saudi Arabia, UAE, Rest of Middle East, South Africa, Egypt, Rest of Africa)
Seafood Companies Profiled in the Study
American Seafoods Company LLC
Charoen Pokphand Foods Public Company Ltd
Dongwon Group
High Liner Foods Inc
Maruha Nichiro Corp
Mowi ASA
Nissui
Pacific Seafood
Thai Union Group PCL.
Trident Seafoods Corp
*- List Not Exhaustive
Chapter 1. TABLE OF CONTENTS
Chapter 2. Introduction to Seafood Market
2.1. Market Overview
2.2. Key Statistics and Report Highlights
2.3. Scope of the Comprehensive Study
2.3.1. Market Definition
2.3.2 Countries and Regions Covered
2.3.3 Research Objective
2.3.4 Units, Currency, and Conversions
2.3.5 Industry Value Chain
2.4. Key Market Segments
2.5. Key Companies
2.6. Study Period
Chapter 3. Strategic Analysis Review
3.1. Seafood Pricing Analysis and Forecast
3.2. Porter’s Five Forces
3.3. Market Ecosystem
3.4. SWOT Analysis
3.5. Regulatory Scenario
3.3. Effects of Inflation, Russia-Ukraine War, moderating economic growth, and other macroeconomic factors
Chapter 4. Competitive Landscape
4.1. Market Share Analysis
4.1.1. Global Seafood Market Share by Company, 2023
4.1.2. Product Offerings of Leading Seafood Companies
4.2. Market Entropy
4.2.1. New Product Launches in the Industry
4.2.2. Mergers, Acquisitions, Joint ventures, and Partnerships
4.3. Key Strategies and Best Practices
Chapter 5. Global Market Projections: Best, Reference, and Low Case Scenarios
5.1. Growth Analysis- Case Scenario Definitions
5.2. Low Growth Case Scenario Forecasts
5.3. Reference Growth Case Scenario Forecasts
5.4. High Growth Case Scenario Forecasts
Chapter 6. Market Dynamics
6.1. Seafood Market Drivers
6.2. Seafood Market Challenges
6.6. Seafood Market Opportunities
6.4. Seafood Market Trends
Chapter 7. Global Seafood Market Outlook Trends
7.1. Global Seafood Revenue (USD Million) and CAGR (%) by Type (2021-2032)
7.2. Global Seafood Revenue (USD Million) and CAGR (%) by Application (2021-2032)
7.3. Global Seafood Revenue (USD Million) and CAGR (%) by Product (2021-2032)
By Type
Fish
Crustaceans
Mollusca
Lobsters
Crabs
Others
By Form
Fresh
Processed
By Distribution Channel
Supermarkets and Hypermarkets
Specialty Stores
Online Retail
Others
Chapter 8. Global Seafood Regional Analysis and Outlook
8.1. Global Seafood Revenue (USD Million) By Regions (2021- 2032)
8.2. North America Seafood Revenue (USD Million) by Country (2021-2032)
8.2.1. United States Seafood Regional Analysis and Outlook
8.2.2. Canada Seafood Regional Analysis and Outlook
8.2.3. Mexico Seafood Regional Analysis and Outlook
8.3. Europe Seafood Revenue (USD Million), by Country (2021-2032)
8.3.1. Germany Seafood Regional Analysis and Outlook
8.3.2. France Seafood Regional Analysis and Outlook
8.3.3. United Kingdom Seafood Regional Analysis and Outlook
8.3.4. Spain Seafood Regional Analysis and Outlook
8.3.5. Italy Seafood Regional Analysis and Outlook
8.3.6. Russia Seafood Regional Analysis and Outlook
8.3.7. Rest of Europe Seafood Regional Analysis and Outlook
8.4. Asia Pacific Seafood Revenue (USD Million) by Country (2021-2032)
8.4.1. China Seafood Regional Analysis and Outlook
8.4.2. Japan Seafood Regional Analysis and Outlook
8.4.3. India Seafood Regional Analysis and Outlook
8.4.4. South Korea Seafood Regional Analysis and Outlook
8.4.5. Australia Seafood Regional Analysis and Outlook
8.4.6. South East Asia Seafood Regional Analysis and Outlook
8.4.7. Rest of Asia Pacific Seafood Regional Analysis and Outlook
8.5. South America Seafood Revenue (USD Million), by Country (2021-2032)
8.5.1. Brazil Seafood Regional Analysis and Outlook
8.5.2. Argentina Seafood Regional Analysis and Outlook
8.5.3. Rest of South America Seafood Regional Analysis and Outlook
8.6. Middle East and Africa Seafood Revenue (USD Million) by Country (2021-2032)
8.6.1. Middle East Seafood Regional Analysis and Outlook
8.6.2. Africa Seafood Regional Analysis and Outlook
Chapter 9. North America Seafood Analysis and Outlook
9.1. North America Seafood Revenue (USD Million) by Segments (2021-2032)
9.1.1. North America Seafood Revenue (USD Million) by Type (2021-2032)
9.1.2. North America Seafood Revenue (USD Million) by Application (2021-2032)
9.1.3. North America Seafood Revenue (USD Million) by Product (2021-2032)
By Type
Fish
Crustaceans
Mollusca
Lobsters
Crabs
Others
By Form
Fresh
Processed
By Distribution Channel
Supermarkets and Hypermarkets
Specialty Stores
Online Retail
Others
Chapter 10. Europe Seafood Analysis and Outlook
10.1. Europe Seafood Revenue (USD Million), by Segments (USD Million) (2021-2032)
10.1.1. Europe Seafood Revenue (USD Million) by Type (2021-2032)
10.1.2. Europe Seafood Revenue (USD Million) by Application (2021-2032)
10.1.3. Europe Seafood Revenue (USD Million) by Product (2021-2032)
By Type
Fish
Crustaceans
Mollusca
Lobsters
Crabs
Others
By Form
Fresh
Processed
By Distribution Channel
Supermarkets and Hypermarkets
Specialty Stores
Online Retail
Others
Chapter 11. Asia Pacific Seafood Analysis and Outlook
11.1. Asia Pacific Seafood Revenue (USD Million), and Revenue (USD Million) by Segments (2021-2032)
11.1.1. Asia Pacific Seafood Revenue (USD Million) by Type (2021-2032)
11.1.2. Asia Pacific Seafood Revenue (USD Million) by Application (2021-2032)
11.1.3. Asia Pacific Seafood Revenue (USD Million) by Product (2021-2032)
By Type
Fish
Crustaceans
Mollusca
Lobsters
Crabs
Others
By Form
Fresh
Processed
By Distribution Channel
Supermarkets and Hypermarkets
Specialty Stores
Online Retail
Others
Chapter 12. South America Seafood Analysis and Outlook
12.1. South America Seafood Revenue (USD Million), by Segments (2021-2032)
12.1.1. South America Seafood Revenue (USD Million) by Type (2021-2032)
12.1.2. South America Seafood Revenue (USD Million) by Application (2021-2032)
12.1.3. South America Seafood Revenue (USD Million) by Product (2021-2032)
By Type
Fish
Crustaceans
Mollusca
Lobsters
Crabs
Others
By Form
Fresh
Processed
By Distribution Channel
Supermarkets and Hypermarkets
Specialty Stores
Online Retail
Others
Chapter 13. Middle East and Africa Seafood Analysis and Outlook
13.1. Middle East and Africa Seafood Revenue (USD Million), by Segments (2021-2032)
13.1.1. Middle East and Africa Seafood Revenue (USD Million) by Type (2021-2032)
13.1.2. Middle East and Africa Seafood Revenue (USD Million) by Application (2021-2032)
13.1.3. Middle East and Africa Seafood Revenue (USD Million) by Product (2021-2032)
By Type
Fish
Crustaceans
Mollusca
Lobsters
Crabs
Others
By Form
Fresh
Processed
By Distribution Channel
Supermarkets and Hypermarkets
Specialty Stores
Online Retail
Others
Chapter 14. Seafood Company Profiles
14.1 Business Overview
14.2 Product Profiles
14.3 SWOT Profiles
14.5 Recent Developments
14.6 Financial Profile
List of Companies
American Seafoods Company LLC
Charoen Pokphand Foods Public Company Ltd
Dongwon Group
High Liner Foods Inc
Maruha Nichiro Corp
Mowi ASA
Nissui
Pacific Seafood
Thai Union Group PCL.
Trident Seafoods Corp
15. Methodology and Data Sources
15.1 Customization Offerings
15.2 Subscription Services
15.3 Related Reports
15.4 Publisher Expertise
LIST OF TABLES
Table 1 Market Segmentation Analysis
Table 2 Global Seafood Market Share of Leading Companies, 2023
Table 3 Product Offerings of Leading Companies
Table 4 Low Growth Scenario Forecasts
Table 5 Reference Case Growth Scenario
Table 6 High Growth Case Scenario
Table 7 Global Seafood Revenue (USD Million) And CAGR (%) By Type (2021-2032)
Table 8 Global Seafood Revenue (USD Million) And CAGR (%) By Application (2021-2032)
Table 9 Global Seafood Revenue (USD Million) And CAGR (%) By Product (2021-2032)
Table 10 Global Seafood Market Revenue (USD Million) By Regions (2021-2032)
Table 11 Global Seafood Market Share (%) By Regions (2021-2032)
Table 12 North America Seafood Revenue (USD Million) By Country (2021-2032)
Table 13 Europe Seafood Revenue (USD Million) By Country (2021-2032)
Table 14 Asia Pacific Seafood Revenue (USD Million) By Country (2021-2032)
Table 15 South America Seafood Revenue (USD Million) By Country (2021-2032)
Table 16 Middle East and Africa Seafood Revenue (USD Million) By Region (2021-2032)
Table 17 North America Seafood Revenue (USD Million) By Type (2021-2032)
Table 18 North America Seafood Revenue (USD Million) By Application (2021-2032)
Table 19 North America Seafood Revenue (USD Million) By Product (2021-2032)
Table 20 Europe Seafood Revenue (USD Million) By Type (2021-2032)
Table 21 Europe Seafood Revenue (USD Million) By Application (2021-2032)
Table 22 Europe Seafood Revenue (USD Million) By Product (2021-2032)
Table 23 Asia Pacific Seafood Revenue (USD Million) By Type (2021-2032)
Table 24 Asia Pacific Seafood Revenue (USD Million) By Application (2021-2032)
Table 25 Asia Pacific Seafood Revenue (USD Million) By Product (2021-2032)
Table 26 South America Seafood Revenue (USD Million) By Type (2021-2032)
Table 27 South America Seafood Revenue (USD Million) By Application (2021-2032)
Table 28 South America Seafood Revenue (USD Million) By Product (2021-2032)
Table 29 Middle East and Africa Seafood Revenue (USD Million) By Type (2021-2032)
Table 30 Middle East and Africa Seafood Revenue (USD Million) By Application (2021-2032)
Table 31 Middle East and Africa Seafood Revenue (USD Million) By Product (2021-2032)
LIST OF FIGURES
Figure 1. Market Scope
Figure 2. Pricing Forecasts Per Unit, 2023- 2032
Figure 3. Porter’s Five Forces
Figure 4. Global Seafood Market Revenue (USD Million) By Regions (2021-2032)
Figure 5. Global Seafood Market Share (%) By Regions (2023)
Figure 6. North America Seafood Revenue (USD Million) By Country (2021-2032)
Figure 7. United States Seafood Revenue (USD Million) By Country (2021-2032)
Figure 8. Canada Seafood Revenue (USD Million) By Country (2021-2032)
Figure 9. Mexico Seafood Revenue (USD Million) By Country (2021-2032)
Figure 10. Europe Seafood Revenue (USD Million) By Country (2021-2032)
Figure 11. Germany Seafood Revenue (USD Million) By Country (2021-2032)
Figure 12. France Seafood Revenue (USD Million) By Country (2021-2032)
Figure 13. United Kingdom Seafood Revenue (USD Million) By Country (2021-2032)
Figure 14. Spain Seafood Revenue (USD Million) By Country (2021-2032)
Figure 15. Italy Seafood Revenue (USD Million) By Country (2021-2032)
Figure 16. Russia Seafood Revenue (USD Million) By Country (2021-2032)
Figure 17. Rest of Europe Seafood Revenue (USD Million) By Country (2021-2032)
Figure 11. Asia Pacific Seafood Revenue (USD Million) By Country (2021-2032)
Figure 12. China Seafood Revenue (USD Million) By Country (2021-2032)
Figure 13. Japan Seafood Revenue (USD Million) By Country (2021-2032)
Figure 14. India Seafood Revenue (USD Million) By Country (2021-2032)
Figure 15. South Korea Seafood Revenue (USD Million) By Country (2021-2032)
Figure 16. Australia Seafood Revenue (USD Million) By Country (2021-2032)
Figure 17. South East Asia Seafood Revenue (USD Million) By Country (2021-2032)
Figure 18. South America Seafood Revenue (USD Million) By Country (2021-2032)
Figure 19. Brazil Seafood Revenue (USD Million) By Country (2021-2032)
Figure 20. Argentina Seafood Revenue (USD Million) By Country (2021-2032)
Figure 21. Rest of Asia Pacific Seafood Revenue (USD Million) By Country (2021-2032)
Figure 22. Middle East and Africa Seafood Revenue (USD Million) By Region (2021-2032)
Figure 23. Saudi Arabia Seafood Revenue (USD Million) By Region (2021-2032)
Figure 24. The UAE Seafood Revenue (USD Million) By Region (2021-2032)
Figure 25. Rest of Middle East Seafood Revenue (USD Million) By Region (2021-2032)
Figure 26. South Africa Seafood Revenue (USD Million) By Region (2021-2032)
Figure 27. Africa Seafood Revenue (USD Million) By Region (2021-2032)
Figure 28. North America Seafood Revenue (USD Million) By Type (2021-2032)
Figure 29. North America Seafood Revenue (USD Million) By Application (2021-2032)
Figure 30. North America Seafood Revenue (USD Million) By Product (2021-2032)
Figure 31. Europe Seafood Revenue (USD Million) By Type (2021-2032)
Figure 32. Europe Seafood Revenue (USD Million) By Application (2021-2032)
Figure 33. Europe Seafood Revenue (USD Million) By Product (2021-2032)
Figure 34. Asia Pacific Seafood Revenue (USD Million) By Type (2021-2032)
Figure 35. Asia Pacific Seafood Revenue (USD Million) By Application (2021-2032)
Figure 36. Asia Pacific Seafood Revenue (USD Million) By Product (2021-2032)
Figure 37. South America Seafood Revenue (USD Million) By Type (2021-2032)
Figure 38. South America Seafood Revenue (USD Million) By Application (2021-2032)
Figure 39. South America Seafood Revenue (USD Million) By Product (2021-2032)
Figure 40. Middle East and Africa Seafood Revenue (USD Million) By Type (2021-2032)
Figure 41. Middle East and Africa Seafood Revenue (USD Million) By Application (2021-2032)
Figure 42. Middle East and Africa Seafood Revenue (USD Million) By Product (2021-2032)
By Type
Fish
Crustaceans
Mollusca
Lobsters
Crabs
Others
By Form
Fresh
Processed
By Distribution Channel
Supermarkets and Hypermarkets
Specialty Stores
Online Retail
Others
Countries Analyzed
North America (US, Canada, Mexico)
Europe (Germany, UK, France, Spain, Italy, Russia, Rest of Europe)
Asia Pacific (China, India, Japan, South Korea, Australia, South East Asia, Rest of Asia)
South America (Brazil, Argentina, Rest of South America)
Middle East and Africa (Saudi Arabia, UAE, Rest of Middle East, South Africa, Egypt, Rest of Africa)
