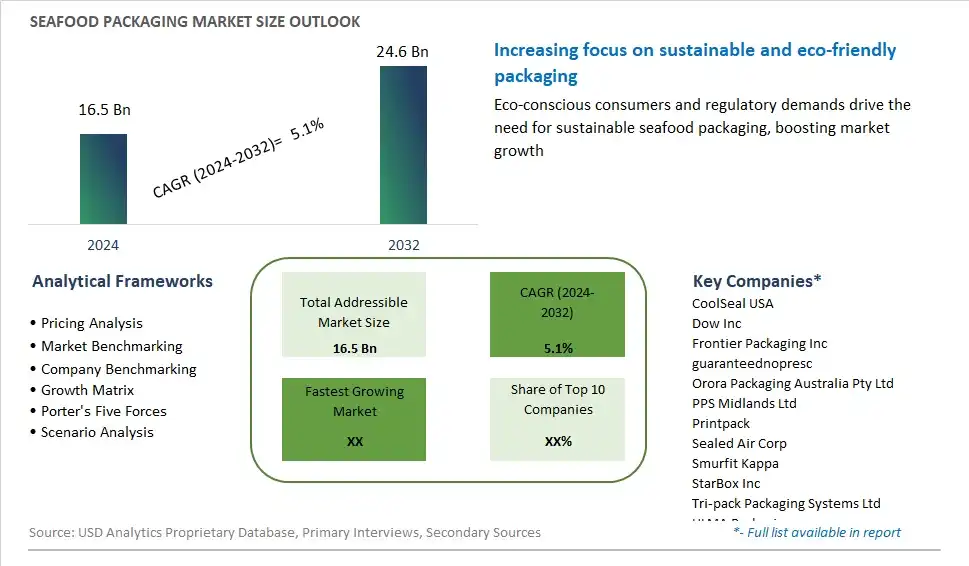
Global Seafood Packaging Market Size is valued at $16.5 Billion in 2024 and is forecast to register a growth rate (CAGR) of 5.1% to reach $24.6 Billion by 2032.
The global Seafood Packaging Market Comprehensive Study analyzes and forecasts the market size across 6 regions and 24 countries for diverse segments -By Product (Flexible, Rigid), By Technology (Modified Atmosphere Packaging, Vacuum Packaging, Others), By Material (Plastic, Paper & Paperboard), By Application (Fresh and Frozen Products, Processed Products, Ready-To-Eat Products)
An Introduction to Seafood Packaging Market
In 2024, the seafood packaging market is evolving to meet the dual challenges of preserving product freshness and ensuring sustainability throughout the supply chain. Seafood, being highly perishable, requires specialized packaging solutions to maintain quality, extend shelf life, and minimize food waste from catch to consumption. Advanced packaging technologies such as modified atmosphere packaging (MAP), vacuum packaging, and active packaging systems are increasingly utilized to control moisture, oxygen levels, and microbial growth, thereby prolonging the shelf life of seafood products while preserving their sensory attributes. Moreover, sustainable packaging materials such as biodegradable films, compostable trays, and recycled content packaging are gaining traction as consumers and regulatory agencies demand environmentally friendly alternatives to traditional plastics. Additionally, smart packaging innovations incorporating sensors and indicators for real-time monitoring of temperature, freshness, and integrity are enhancing transparency and traceability across the seafood supply chain. As the seafood industry embraces digitalization, sustainability, and consumer-centric approaches, the seafood packaging market is poised for continued innovation and growth, driven by the imperative to deliver safe, high-quality seafood products to discerning consumers worldwide.
Seafood Packaging Competitive Landscape
The market report analyses the leading companies in the industry including CoolSeal USA, Dow Inc, Frontier Packaging Inc, guaranteednopresc, Orora Packaging Australia Pty Ltd, PPS Midlands Ltd, Printpack, Sealed Air Corp, Smurfit Kappa, StarBox Inc, Tri-pack Packaging Systems Ltd, ULMA Packaging, Wipak Oy, WestRock Company, and Others.
Seafood Packaging Market Dynamics
Seafood Packaging Market Trend: Sustainable Packaging Solutions in Seafood Industry
The market for Seafood Packaging is witnessing a prominent trend towards sustainable packaging solutions in the seafood industry. With growing environmental concerns and increasing consumer awareness about plastic pollution in oceans, there's a significant push towards eco-friendly packaging options. Seafood companies are increasingly adopting biodegradable, compostable, and recyclable packaging materials to reduce their environmental footprint and meet consumer demands for sustainable products. This trend aligns with the industry's commitment to responsible sourcing and environmental stewardship, driving the adoption of innovative packaging solutions that minimize waste and promote a circular economy.
Market Driver: Demand for Freshness and Quality Assurance
The market for Seafood Packaging is primarily driven by the demand for freshness and quality assurance in seafood products. Packaging plays a crucial role in preserving the freshness, flavor, and safety of seafood during storage, transportation, and display. Consumers expect seafood to be delivered in packaging that maintains product integrity, extends shelf life, and prevents contamination. As seafood retailers, processors, and distributors strive to meet these expectations, there's a growing need for packaging solutions that offer effective moisture and oxygen barriers, temperature control features, and tamper-evident seals. This driver underscores the importance of packaging innovation in ensuring product quality and safety throughout the seafood supply chain.
Market Opportunity: Customized Packaging Solutions and Brand Differentiation
The market for Seafood Packaging presents a significant opportunity for customized packaging solutions and brand differentiation. Seafood companies can capitalize on consumer preferences and market trends by offering packaging options tailored to specific product categories, such as fresh fish, shellfish, smoked seafood, and frozen seafood. Additionally, there are opportunities to enhance brand visibility and recognition through distinctive packaging designs, logos, and labeling that communicate product attributes, origin, and sustainability credentials. By investing in innovative packaging technologies, such as modified atmosphere packaging (MAP), vacuum skin packaging (VSP), and smart packaging solutions, seafood companies can differentiate their products, build consumer trust, and capture market share in the competitive seafood industry.
Seafood Packaging Market Share Analysis: Flexible held the dominant market share in 2024
In the Seafood Packaging market, the "Flexible" segment is the largest, commanding significant prominence for several compelling reasons. Flexible packaging offers numerous advantages, including lightweight construction, space efficiency, and versatility in design and customization. These qualities make flexible packaging ideal for a wide range of seafood products, including fresh fish, frozen shrimp, and seafood snacks. Further, flexible packaging materials such as plastic films and pouches provide excellent barrier properties, preserving the freshness and quality of seafood products during storage and transportation. Additionally, the flexibility of these packaging solutions allows for easy handling and portioning, enhancing convenience for both consumers and retailers. With its widespread adoption across the seafood industry and continuous innovation in materials and technologies, the Flexible segment maintains its dominance in the Seafood Packaging market, shaping the landscape of packaging solutions for seafood products.
Seafood Packaging Market Share Analysis: Modified Atmosphere Packaging (MAP) market is poised to register the fastest growth rae over the forecast period to 2032
Among the segments delineated in the Seafood Packaging market, the "Modified Atmosphere Packaging (MAP)" segment is the fastest-growing, driven by several key factors. MAP technology involves modifying the composition of the atmosphere surrounding packaged seafood to extend shelf life and preserve freshness. This method creates an optimal gas mixture, typically consisting of nitrogen, carbon dioxide, and oxygen, tailored to the specific requirements of seafood products. MAP packaging effectively inhibits microbial growth, delays oxidation, and minimizes spoilage, thereby prolonging the product's freshness and maintaining its quality. Further, MAP packaging enhances the visual appeal of seafood products by preserving their natural color, texture, and flavor, improving consumer satisfaction and reducing food waste. Additionally, the growing demand for convenience, sustainability, and food safety drives the adoption of MAP technology by seafood processors and retailers seeking to meet consumer expectations and regulatory standards. With its proven efficacy in extending shelf life and enhancing product quality, the MAP segment is poised to sustain its rapid growth, reshaping the landscape of the Seafood Packaging market towards advanced preservation solutions.
Seafood Packaging Market Share Analysis: Plastic held the dominant market share in 2024
In the Seafood Packaging market, the "Plastic" segment is the largest, commanding significant prominence for several compelling reasons. Plastic packaging offers a combination of durability, flexibility, and cost-effectiveness, making it a preferred choice for packaging various seafood products. Plastic materials such as polyethylene (PE), polypropylene (PP), and polyethylene terephthalate (PET) provide excellent barrier properties, effectively protecting seafood from moisture, oxygen, and contaminants during storage and transportation. Further, plastic packaging solutions are lightweight and versatile, allowing for efficient packaging design and customization to meet the specific requirements of different seafood products. Additionally, plastic packaging extends the shelf life of seafood by preventing spoilage and maintaining product freshness, thereby reducing food waste and enhancing overall product quality. With its widespread adoption across the seafood industry and continuous innovation in materials and technologies, the Plastic segment maintains its dominance in the Seafood Packaging market, shaping the landscape of packaging solutions for seafood products.
Seafood Packaging Market Segmentation
By Product
Flexible
Rigid
By Technology
Modified Atmosphere Packaging
Vacuum Packaging
Others
By Material
Plastic
Paper & Paperboard
By Application
Fresh and Frozen Products
Processed Products
Ready-To-Eat Products
Countries Analyzed
North America (US, Canada, Mexico)
Europe (Germany, UK, France, Spain, Italy, Russia, Rest of Europe)
Asia Pacific (China, India, Japan, South Korea, Australia, South East Asia, Rest of Asia)
South America (Brazil, Argentina, Rest of South America)
Middle East and Africa (Saudi Arabia, UAE, Rest of Middle East, South Africa, Egypt, Rest of Africa)
Seafood Packaging Companies Profiled in the Study
CoolSeal USA
Dow Inc
Frontier Packaging Inc
guaranteednopresc
Orora Packaging Australia Pty Ltd
PPS Midlands Ltd
Printpack
Sealed Air Corp
Smurfit Kappa
StarBox Inc
Tri-pack Packaging Systems Ltd
ULMA Packaging
Wipak Oy
WestRock Company
*- List Not Exhaustive
Chapter 1. TABLE OF CONTENTS
Chapter 2. Introduction to Seafood Packaging Market
2.1. Market Overview
2.2. Key Statistics and Report Highlights
2.3. Scope of the Comprehensive Study
2.3.1. Market Definition
2.3.2 Countries and Regions Covered
2.3.3 Research Objective
2.3.4 Units, Currency, and Conversions
2.3.5 Industry Value Chain
2.4. Key Market Segments
2.5. Key Companies
2.6. Study Period
Chapter 3. Strategic Analysis Review
3.1. Seafood Packaging Pricing Analysis and Forecast
3.2. Porter’s Five Forces
3.3. Market Ecosystem
3.4. SWOT Analysis
3.5. Regulatory Scenario
3.3. Effects of Inflation, Russia-Ukraine War, moderating economic growth, and other macroeconomic factors
Chapter 4. Competitive Landscape
4.1. Market Share Analysis
4.1.1. Global Seafood Packaging Market Share by Company, 2023
4.1.2. Product Offerings of Leading Seafood Packaging Companies
4.2. Market Entropy
4.2.1. New Product Launches in the Industry
4.2.2. Mergers, Acquisitions, Joint ventures, and Partnerships
4.3. Key Strategies and Best Practices
Chapter 5. Global Market Projections: Best, Reference, and Low Case Scenarios
5.1. Growth Analysis- Case Scenario Definitions
5.2. Low Growth Case Scenario Forecasts
5.3. Reference Growth Case Scenario Forecasts
5.4. High Growth Case Scenario Forecasts
Chapter 6. Market Dynamics
6.1. Seafood Packaging Market Drivers
6.2. Seafood Packaging Market Challenges
6.6. Seafood Packaging Market Opportunities
6.4. Seafood Packaging Market Trends
Chapter 7. Global Seafood Packaging Market Outlook Trends
7.1. Global Seafood Packaging Revenue (USD Million) and CAGR (%) by Type (2021-2032)
7.2. Global Seafood Packaging Revenue (USD Million) and CAGR (%) by Application (2021-2032)
7.3. Global Seafood Packaging Revenue (USD Million) and CAGR (%) by Product (2021-2032)
By Product
Flexible
Rigid
By Technology
Modified Atmosphere Packaging
Vacuum Packaging
Others
By Material
Plastic
Paper & Paperboard
By Application
Fresh and Frozen Products
Processed Products
Ready-To-Eat Products
Chapter 8. Global Seafood Packaging Regional Analysis and Outlook
8.1. Global Seafood Packaging Revenue (USD Million) By Regions (2021- 2032)
8.2. North America Seafood Packaging Revenue (USD Million) by Country (2021-2032)
8.2.1. United States Seafood Packaging Regional Analysis and Outlook
8.2.2. Canada Seafood Packaging Regional Analysis and Outlook
8.2.3. Mexico Seafood Packaging Regional Analysis and Outlook
8.3. Europe Seafood Packaging Revenue (USD Million), by Country (2021-2032)
8.3.1. Germany Seafood Packaging Regional Analysis and Outlook
8.3.2. France Seafood Packaging Regional Analysis and Outlook
8.3.3. United Kingdom Seafood Packaging Regional Analysis and Outlook
8.3.4. Spain Seafood Packaging Regional Analysis and Outlook
8.3.5. Italy Seafood Packaging Regional Analysis and Outlook
8.3.6. Russia Seafood Packaging Regional Analysis and Outlook
8.3.7. Rest of Europe Seafood Packaging Regional Analysis and Outlook
8.4. Asia Pacific Seafood Packaging Revenue (USD Million) by Country (2021-2032)
8.4.1. China Seafood Packaging Regional Analysis and Outlook
8.4.2. Japan Seafood Packaging Regional Analysis and Outlook
8.4.3. India Seafood Packaging Regional Analysis and Outlook
8.4.4. South Korea Seafood Packaging Regional Analysis and Outlook
8.4.5. Australia Seafood Packaging Regional Analysis and Outlook
8.4.6. South East Asia Seafood Packaging Regional Analysis and Outlook
8.4.7. Rest of Asia Pacific Seafood Packaging Regional Analysis and Outlook
8.5. South America Seafood Packaging Revenue (USD Million), by Country (2021-2032)
8.5.1. Brazil Seafood Packaging Regional Analysis and Outlook
8.5.2. Argentina Seafood Packaging Regional Analysis and Outlook
8.5.3. Rest of South America Seafood Packaging Regional Analysis and Outlook
8.6. Middle East and Africa Seafood Packaging Revenue (USD Million) by Country (2021-2032)
8.6.1. Middle East Seafood Packaging Regional Analysis and Outlook
8.6.2. Africa Seafood Packaging Regional Analysis and Outlook
Chapter 9. North America Seafood Packaging Analysis and Outlook
9.1. North America Seafood Packaging Revenue (USD Million) by Segments (2021-2032)
9.1.1. North America Seafood Packaging Revenue (USD Million) by Type (2021-2032)
9.1.2. North America Seafood Packaging Revenue (USD Million) by Application (2021-2032)
9.1.3. North America Seafood Packaging Revenue (USD Million) by Product (2021-2032)
By Product
Flexible
Rigid
By Technology
Modified Atmosphere Packaging
Vacuum Packaging
Others
By Material
Plastic
Paper & Paperboard
By Application
Fresh and Frozen Products
Processed Products
Ready-To-Eat Products
Chapter 10. Europe Seafood Packaging Analysis and Outlook
10.1. Europe Seafood Packaging Revenue (USD Million), by Segments (USD Million) (2021-2032)
10.1.1. Europe Seafood Packaging Revenue (USD Million) by Type (2021-2032)
10.1.2. Europe Seafood Packaging Revenue (USD Million) by Application (2021-2032)
10.1.3. Europe Seafood Packaging Revenue (USD Million) by Product (2021-2032)
By Product
Flexible
Rigid
By Technology
Modified Atmosphere Packaging
Vacuum Packaging
Others
By Material
Plastic
Paper & Paperboard
By Application
Fresh and Frozen Products
Processed Products
Ready-To-Eat Products
Chapter 11. Asia Pacific Seafood Packaging Analysis and Outlook
11.1. Asia Pacific Seafood Packaging Revenue (USD Million), and Revenue (USD Million) by Segments (2021-2032)
11.1.1. Asia Pacific Seafood Packaging Revenue (USD Million) by Type (2021-2032)
11.1.2. Asia Pacific Seafood Packaging Revenue (USD Million) by Application (2021-2032)
11.1.3. Asia Pacific Seafood Packaging Revenue (USD Million) by Product (2021-2032)
By Product
Flexible
Rigid
By Technology
Modified Atmosphere Packaging
Vacuum Packaging
Others
By Material
Plastic
Paper & Paperboard
By Application
Fresh and Frozen Products
Processed Products
Ready-To-Eat Products
Chapter 12. South America Seafood Packaging Analysis and Outlook
12.1. South America Seafood Packaging Revenue (USD Million), by Segments (2021-2032)
12.1.1. South America Seafood Packaging Revenue (USD Million) by Type (2021-2032)
12.1.2. South America Seafood Packaging Revenue (USD Million) by Application (2021-2032)
12.1.3. South America Seafood Packaging Revenue (USD Million) by Product (2021-2032)
By Product
Flexible
Rigid
By Technology
Modified Atmosphere Packaging
Vacuum Packaging
Others
By Material
Plastic
Paper & Paperboard
By Application
Fresh and Frozen Products
Processed Products
Ready-To-Eat Products
Chapter 13. Middle East and Africa Seafood Packaging Analysis and Outlook
13.1. Middle East and Africa Seafood Packaging Revenue (USD Million), by Segments (2021-2032)
13.1.1. Middle East and Africa Seafood Packaging Revenue (USD Million) by Type (2021-2032)
13.1.2. Middle East and Africa Seafood Packaging Revenue (USD Million) by Application (2021-2032)
13.1.3. Middle East and Africa Seafood Packaging Revenue (USD Million) by Product (2021-2032)
By Product
Flexible
Rigid
By Technology
Modified Atmosphere Packaging
Vacuum Packaging
Others
By Material
Plastic
Paper & Paperboard
By Application
Fresh and Frozen Products
Processed Products
Ready-To-Eat Products
Chapter 14. Seafood Packaging Company Profiles
14.1 Business Overview
14.2 Product Profiles
14.3 SWOT Profiles
14.5 Recent Developments
14.6 Financial Profile
List of Companies
CoolSeal USA
Dow Inc
Frontier Packaging Inc
guaranteednopresc
Orora Packaging Australia Pty Ltd
PPS Midlands Ltd
Printpack
Sealed Air Corp
Smurfit Kappa
StarBox Inc
Tri-pack Packaging Systems Ltd
ULMA Packaging
Wipak Oy
WestRock Company
15. Methodology and Data Sources
15.1 Customization Offerings
15.2 Subscription Services
15.3 Related Reports
15.4 Publisher Expertise
LIST OF TABLES
Table 1 Market Segmentation Analysis
Table 2 Global Seafood Packaging Market Share of Leading Companies, 2023
Table 3 Product Offerings of Leading Companies
Table 4 Low Growth Scenario Forecasts
Table 5 Reference Case Growth Scenario
Table 6 High Growth Case Scenario
Table 7 Global Seafood Packaging Revenue (USD Million) And CAGR (%) By Type (2021-2032)
Table 8 Global Seafood Packaging Revenue (USD Million) And CAGR (%) By Application (2021-2032)
Table 9 Global Seafood Packaging Revenue (USD Million) And CAGR (%) By Product (2021-2032)
Table 10 Global Seafood Packaging Market Revenue (USD Million) By Regions (2021-2032)
Table 11 Global Seafood Packaging Market Share (%) By Regions (2021-2032)
Table 12 North America Seafood Packaging Revenue (USD Million) By Country (2021-2032)
Table 13 Europe Seafood Packaging Revenue (USD Million) By Country (2021-2032)
Table 14 Asia Pacific Seafood Packaging Revenue (USD Million) By Country (2021-2032)
Table 15 South America Seafood Packaging Revenue (USD Million) By Country (2021-2032)
Table 16 Middle East and Africa Seafood Packaging Revenue (USD Million) By Region (2021-2032)
Table 17 North America Seafood Packaging Revenue (USD Million) By Type (2021-2032)
Table 18 North America Seafood Packaging Revenue (USD Million) By Application (2021-2032)
Table 19 North America Seafood Packaging Revenue (USD Million) By Product (2021-2032)
Table 20 Europe Seafood Packaging Revenue (USD Million) By Type (2021-2032)
Table 21 Europe Seafood Packaging Revenue (USD Million) By Application (2021-2032)
Table 22 Europe Seafood Packaging Revenue (USD Million) By Product (2021-2032)
Table 23 Asia Pacific Seafood Packaging Revenue (USD Million) By Type (2021-2032)
Table 24 Asia Pacific Seafood Packaging Revenue (USD Million) By Application (2021-2032)
Table 25 Asia Pacific Seafood Packaging Revenue (USD Million) By Product (2021-2032)
Table 26 South America Seafood Packaging Revenue (USD Million) By Type (2021-2032)
Table 27 South America Seafood Packaging Revenue (USD Million) By Application (2021-2032)
Table 28 South America Seafood Packaging Revenue (USD Million) By Product (2021-2032)
Table 29 Middle East and Africa Seafood Packaging Revenue (USD Million) By Type (2021-2032)
Table 30 Middle East and Africa Seafood Packaging Revenue (USD Million) By Application (2021-2032)
Table 31 Middle East and Africa Seafood Packaging Revenue (USD Million) By Product (2021-2032)
LIST OF FIGURES
Figure 1. Market Scope
Figure 2. Pricing Forecasts Per Unit, 2023- 2032
Figure 3. Porter’s Five Forces
Figure 4. Global Seafood Packaging Market Revenue (USD Million) By Regions (2021-2032)
Figure 5. Global Seafood Packaging Market Share (%) By Regions (2023)
Figure 6. North America Seafood Packaging Revenue (USD Million) By Country (2021-2032)
Figure 7. United States Seafood Packaging Revenue (USD Million) By Country (2021-2032)
Figure 8. Canada Seafood Packaging Revenue (USD Million) By Country (2021-2032)
Figure 9. Mexico Seafood Packaging Revenue (USD Million) By Country (2021-2032)
Figure 10. Europe Seafood Packaging Revenue (USD Million) By Country (2021-2032)
Figure 11. Germany Seafood Packaging Revenue (USD Million) By Country (2021-2032)
Figure 12. France Seafood Packaging Revenue (USD Million) By Country (2021-2032)
Figure 13. United Kingdom Seafood Packaging Revenue (USD Million) By Country (2021-2032)
Figure 14. Spain Seafood Packaging Revenue (USD Million) By Country (2021-2032)
Figure 15. Italy Seafood Packaging Revenue (USD Million) By Country (2021-2032)
Figure 16. Russia Seafood Packaging Revenue (USD Million) By Country (2021-2032)
Figure 17. Rest of Europe Seafood Packaging Revenue (USD Million) By Country (2021-2032)
Figure 11. Asia Pacific Seafood Packaging Revenue (USD Million) By Country (2021-2032)
Figure 12. China Seafood Packaging Revenue (USD Million) By Country (2021-2032)
Figure 13. Japan Seafood Packaging Revenue (USD Million) By Country (2021-2032)
Figure 14. India Seafood Packaging Revenue (USD Million) By Country (2021-2032)
Figure 15. South Korea Seafood Packaging Revenue (USD Million) By Country (2021-2032)
Figure 16. Australia Seafood Packaging Revenue (USD Million) By Country (2021-2032)
Figure 17. South East Asia Seafood Packaging Revenue (USD Million) By Country (2021-2032)
Figure 18. South America Seafood Packaging Revenue (USD Million) By Country (2021-2032)
Figure 19. Brazil Seafood Packaging Revenue (USD Million) By Country (2021-2032)
Figure 20. Argentina Seafood Packaging Revenue (USD Million) By Country (2021-2032)
Figure 21. Rest of Asia Pacific Seafood Packaging Revenue (USD Million) By Country (2021-2032)
Figure 22. Middle East and Africa Seafood Packaging Revenue (USD Million) By Region (2021-2032)
Figure 23. Saudi Arabia Seafood Packaging Revenue (USD Million) By Region (2021-2032)
Figure 24. The UAE Seafood Packaging Revenue (USD Million) By Region (2021-2032)
Figure 25. Rest of Middle East Seafood Packaging Revenue (USD Million) By Region (2021-2032)
Figure 26. South Africa Seafood Packaging Revenue (USD Million) By Region (2021-2032)
Figure 27. Africa Seafood Packaging Revenue (USD Million) By Region (2021-2032)
Figure 28. North America Seafood Packaging Revenue (USD Million) By Type (2021-2032)
Figure 29. North America Seafood Packaging Revenue (USD Million) By Application (2021-2032)
Figure 30. North America Seafood Packaging Revenue (USD Million) By Product (2021-2032)
Figure 31. Europe Seafood Packaging Revenue (USD Million) By Type (2021-2032)
Figure 32. Europe Seafood Packaging Revenue (USD Million) By Application (2021-2032)
Figure 33. Europe Seafood Packaging Revenue (USD Million) By Product (2021-2032)
Figure 34. Asia Pacific Seafood Packaging Revenue (USD Million) By Type (2021-2032)
Figure 35. Asia Pacific Seafood Packaging Revenue (USD Million) By Application (2021-2032)
Figure 36. Asia Pacific Seafood Packaging Revenue (USD Million) By Product (2021-2032)
Figure 37. South America Seafood Packaging Revenue (USD Million) By Type (2021-2032)
Figure 38. South America Seafood Packaging Revenue (USD Million) By Application (2021-2032)
Figure 39. South America Seafood Packaging Revenue (USD Million) By Product (2021-2032)
Figure 40. Middle East and Africa Seafood Packaging Revenue (USD Million) By Type (2021-2032)
Figure 41. Middle East and Africa Seafood Packaging Revenue (USD Million) By Application (2021-2032)
Figure 42. Middle East and Africa Seafood Packaging Revenue (USD Million) By Product (2021-2032)
By Product
Flexible
Rigid
By Technology
Modified Atmosphere Packaging
Vacuum Packaging
Others
By Material
Plastic
Paper & Paperboard
By Application
Fresh and Frozen Products
Processed Products
Ready-To-Eat Products
Countries Analyzed
North America (US, Canada, Mexico)
Europe (Germany, UK, France, Spain, Italy, Russia, Rest of Europe)
Asia Pacific (China, India, Japan, South Korea, Australia, South East Asia, Rest of Asia)
South America (Brazil, Argentina, Rest of South America)
Middle East and Africa (Saudi Arabia, UAE, Rest of Middle East, South Africa, Egypt, Rest of Africa)
