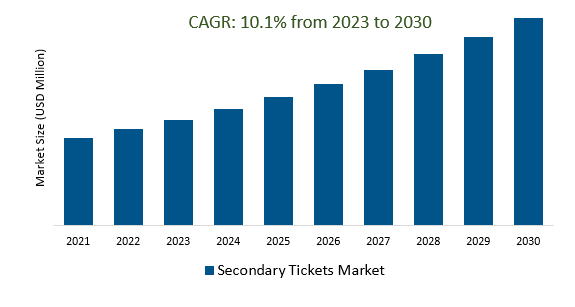
The Global Secondary Ticket Market Size is estimated to register 10.1% growth over the forecast period from 2023 to 2030.
The Secondary Ticket Market, also known as the ticket resale market, is influenced by factors such as high demand for popular events, scarcity of premium seats, last-minute purchases, ticket reselling as a business, and government regulations. Trends include digitalization, dynamic pricing, blockchain, and marketplace competition. Digitalization has made it easier for buyers and sellers to connect, while dynamic pricing allows prices to fluctuate with market conditions. Blockchain technology is being explored to enhance security and combat fraud. Marketplace competition is intense, with platforms like StubHub, Ticketmaster Resale, and Seat Geek offering different features. Increased scrutiny has led to calls for transparency and consumer protections. Fan-friendly policies are also being implemented. The COVID-19 pandemic has accelerated digital and contactless ticketing trends, and sustainability considerations are becoming more important in the ticketing industry.
Surging Demand for Sold-Out Events Spurs Secondary Market Growth.
The surging demand for sold-out events has ignited remarkable growth within the secondary ticket market. This trend is primarily driven by the insatiable desire of fans to secure tickets to highly sought-after concerts, sports events, and entertainment spectacles. Secondary market platforms have emerged as a lucrative solution, allowing individuals to buy and sell tickets, often at premium prices, in the absence of official availability. The online platforms have witnessed a substantial uptick in activity, fostering a thriving ecosystem for ticket reselling. This surge can be attributed to the intersection of passionate fans and the digital age, which has made ticket reselling easier and more accessible, creating significant economic opportunities for both sellers and buyers. The secondary market growth can be further attributed to the scarcity of tickets for popular events, leading to the emergence of a vibrant resale market. Scalpers and ticket brokers are increasingly leveraging technology and sophisticated pricing strategies to maximize their returns. The secondary ticket market has evolved into a sophisticated industry with its own set of challenges and regulations aimed at ensuring fair pricing and preventing fraudulent activities. Overall, the rising demand for sold-out events is a driving force behind the growth of the secondary tickets market, offering a dynamic and often contentious marketplace for event access.
The Scarcity of Premium Seats Fuels Secondary Market Demand.
The increasing scarcity of premium seats for various entertainment events, including concerts, sports games, and theatre performances, has led to a surge in demand within the secondary tickets market. As consumers seek exclusive experiences and prime viewing locations, they are willing to pay a premium for these coveted seats. This growing demand has given rise to a thriving secondary market, where individuals and ticket resellers offer premium seats at higher prices. Scalpers, online ticket platforms, and even fan-to-fan exchanges have capitalized on this trend, contributing to the secondary market's expansion. The scarcity of premium seats has become a key driver for the resale of event tickets, creating a dynamic and competitive landscape within the secondary tickets market. This trend reflects the strong consumer desire for exceptional live event experiences, despite the challenges associated with obtaining these limited, sought-after seats.
Profiting from Bulk Ticket Acquisition and Price Differences is boosting the market.
The Secondary Tickets Market is experiencing remarkable growth as businesses and individuals alike are profiting from bulk ticket acquisition and price differences. This flourishing industry is a direct result of savvy ticket resellers leveraging opportunities in the market. By buying tickets in large quantities, these entrepreneurs can secure them at lower prices, taking advantage of volume discounts and early-bird sales. They then capitalize on discrepancies between their acquisition costs and the prevailing market price, making substantial profits. This phenomenon has led to the growth of a dynamic and competitive secondary ticket market, catering to the demands of event-goers seeking affordable options and those seeking to turn a profit by capitalizing on these opportunities. The increasing popularity of secondary ticket platforms further fuels this trend, creating a win-win scenario for buyers and sellers alike. As a result, the Secondary Tickets Market continues to thrive and expand, driven by the pursuit of economic gains.
Market Share Analysis:
Sporting events have emerged as the cornerstone of the secondary tickets market, capturing the attention of avid fans and enthusiasts alike.
This dominance is driven by the allure of witnessing live sports action, from thrilling football matches to exhilarating basketball games and beyond. The secondary ticket market thrives on the passionate following that major sports events command, offering fans a chance to secure coveted seats even after official ticket sales have closed. The demand for these tickets is a testament to the excitement and camaraderie that sports events foster, making them a prime attraction for resellers and buyers alike. The secondary market's prevalence for sporting events underscores the enduring appeal of these spectacles, as fans eagerly seize the opportunity to be a part of the action, contributing to the continuous growth and prominence of this market segment.
Online platforms have established themselves as the undisputed leaders in the secondary tickets market.
In recent years, the digital realm has completely transformed the way consumers buy and sell tickets for various events, from concerts and sports games to theatre performances. These platforms provide unparalleled convenience, allowing users to browse, purchase, and resell tickets with just a few clicks. They offer a vast marketplace for ticket transactions, connecting buyers and sellers from around the world. This online dominance has not only streamlined the ticket-buying process but has also given rise to increased transparency, ensuring that customers can access real-time pricing information and choose from a wide range of options. Furthermore, it has significantly reduced the risk of fraud by implementing secure transaction methods and ticket verification processes. As technology continues to advance, online platforms are likely to remain at the forefront of the secondary ticket market, offering efficiency and accessibility to both buyers and sellers.
North America has emerged as the undisputed leader in the secondary tickets market, showcasing its dominance in the industry.
This region boasts a thriving ecosystem of ticket resellers, online marketplaces, and platforms dedicated to facilitating the exchange of event tickets. The prevalence of major sporting events, concerts, and cultural attractions in North America contributes significantly to the robust secondary ticket market. Major cities like New York, Los Angeles, and Chicago play a pivotal role in driving this dominance, offering a vast array of entertainment options. Furthermore, technological advancements and the increasing popularity of e-commerce have further propelled North America's leadership in this sector, with various online platforms streamlining ticket transactions for consumers. The region's extensive network of sellers, buyers, and brokers cements its position as the primary hub for secondary ticket transactions, making it a focal point for ticket reselling activities on a global scale.
Secondary Ticket Market Segmentation
By Event Type
- Sports Event
- Concerts
- Performing arts
- Movies
- Others
By Platform
By Region
- North America (United States, Canada, Mexico)
- Europe (Germany, France, United Kingdom, Spain, Italy, Others)
- Asia Pacific (China, India, Japan, South Korea, Australia, Others)
- Latin America (Brazil, Argentina, Others)
- Middle East and Africa (Saudi Arabia, UAE, Kuwait, Other Middle East, South Africa, Nigeria, Other Africa)
Secondary Ticket Market Companies
- StubHub (United States)
- TickPick (United States)
- Ticketmaster (United States)
- Viagogo (United Kingdom)
- Seatgeek (United States)
- Razor Gator (United States)
- Rozorgator (United States)
- Ticketcity (United States)
- Coast to Coast Tickets (United States)
- Tickpick (United States)
*List not exhaustive
Secondary Ticket Market Outlook 2023
1 Market Overview
1.1 Introduction to the Secondary Ticket Market
1.2 Scope of the Study
1.3 Research Objective
1.3.1 Key Market Scope and Segments
1.3.2 Players Covered
1.3.3 Years Considered
2 Executive Summary
2.1 2023 Secondary Ticket Industry- Market Statistics
3 Market Dynamics
3.1 Market Drivers
3.2 Market Challenges
3.3 Market Opportunities
3.4 Market Trends
4 Market Factor Analysis
4.1 Porter’s Five Forces
4.2 Market Entropy
4.2.1 Global Secondary Ticket Market Companies with Area Served
4.2.2 Products Offerings Global Secondary Ticket Market
5 COVID-19 Impact Analysis and Outlook Scenarios
5.1.1 Covid-19 Impact Analysis
5.1.2 post-COVID-19 Scenario- Low Growth Case
5.1.3 post-COVID-19 Scenario- Reference Growth Case
5.1.4 post-COVID-19 Scenario- Low Growth Case
6 Global Secondary Ticket Market Trends
6.1 Global Secondary Ticket Revenue (USD Million) and CAGR (%) by Type (2018-2030)
6.2 Global Secondary Ticket Revenue (USD Million) and CAGR (%) by Applications (2018-2030)
6.3 Global Secondary Ticket Revenue (USD Million) and CAGR (%) by regions (2018-2030)
7 Global Secondary Ticket Market Revenue (USD Million) by Type, and Applications (2018-2022)
7.1 Global Secondary Ticket Revenue (USD Million) by Type (2018-2022)
7.1.1 Global Secondary Ticket Revenue (USD Million), Market Share (%) by Type (2018-2022)
7.2 Global Secondary Ticket Revenue (USD Million) by Applications (2018-2022)
7.2.1 Global Secondary Ticket Revenue (USD Million), Market Share (%) by Applications (2018-2022)
8 Global Secondary Ticket Development Regional Status and Outlook
8.1 Global Secondary Ticket Revenue (USD Million) By Regions (2018-2022)
8.2 North America Secondary Ticket Revenue (USD Million) by Type, and Application (2018-2022)
8.2.1 North America Secondary Ticket Revenue (USD Million) by Country (2018-2022)
8.2.2 North America Secondary Ticket Revenue (USD Million) by Type (2018-2022)
8.2.3 North America Secondary Ticket Revenue (USD Million) by Applications (2018-2022)
8.3 Europe Secondary Ticket Revenue (USD Million), by Type, and Applications (USD Million) (2018-2022)
8.3.1 Europe Secondary Ticket Revenue (USD Million), by Country (2018-2022)
8.3.2 Europe Secondary Ticket Revenue (USD Million) by Type (2018-2022)
8.3.3 Europe Secondary Ticket Revenue (USD Million) by Applications (2018-2022)
8.4 Asia Pacific Secondary Ticket Revenue (USD Million), and Revenue (USD Million) by Type, and Applications (2018-2022)
8.4.1 Asia Pacific Secondary Ticket Revenue (USD Million) by Country (2018-2022)
8.4.2 Asia Pacific Secondary Ticket Revenue (USD Million) by Type (2018-2022)
8.4.3 Asia Pacific Secondary Ticket Revenue (USD Million) by Applications (2018-2022)
8.5 South America Secondary Ticket Revenue (USD Million), by Type, and Applications (2018-2022)
8.5.1 South America Secondary Ticket Revenue (USD Million), by Country (2018-2022)
8.5.2 South America Secondary Ticket Revenue (USD Million) by Type (2018-2022)
8.5.3 South America Secondary Ticket Revenue (USD Million) by Applications (2018-2022)
8.6 Middle East and Africa Secondary Ticket Revenue (USD Million), by Type, Technology, Application, Thickness (2018-2022)
8.6.1 Middle East and Africa Secondary Ticket Revenue (USD Million) by Country (2018-2022)
8.6.2 Middle East and Africa Secondary Ticket Revenue (USD Million) by Type (2018-2022)
8.6.3 Middle East and Africa Secondary Ticket Revenue (USD Million) by Applications (2018-2022)
9 Company Profiles
10 Global Secondary Ticket Market Revenue (USD Million), by Type, and Applications (2023-2030)
10.1 Global Secondary Ticket Revenue (USD Million) and Market Share (%) by Type (2023-2030)
10.1.1 Global Secondary Ticket Revenue (USD Million), and Market Share (%) by Type (2023-2030)
10.2 Global Secondary Ticket Revenue (USD Million) and Market Share (%) by Applications (2023-2030)
10.2.1 Global Secondary Ticket Revenue (USD Million), and Market Share (%) by Applications (2023-2030)
11 Global Secondary Ticket Development Regional Status and Outlook Forecast
11.1 Global Secondary Ticket Revenue (USD Million) By Regions (2023-2030)
11.2 North America Secondary Ticket Revenue (USD Million) by Type, and Applications (2023-2030)
11.2.1 North America Secondary Ticket Revenue (USD) Million by Country (2023-2030)
11.2.2 North America Secondary Ticket Revenue (USD Million), by Type (2023-2030)
11.2.3 North America Secondary Ticket Revenue (USD Million), Market Share (%) by Applications (2023-2030)
11.3 Europe Secondary Ticket Revenue (USD Million), by Type, and Applications (2023-2030)
11.3.1 Europe Secondary Ticket Revenue (USD Million), by Country (2023-2030)
11.3.2 Europe Secondary Ticket Revenue (USD Million), by Type (2023-2030)
11.3.3 Europe Secondary Ticket Revenue (USD Million), by Applications (2023-2030)
11.4 Asia Pacific Secondary Ticket Revenue (USD Million) by Type, and Applications (2023-2030)
11.4.1 Asia Pacific Secondary Ticket Revenue (USD Million), by Country (2023-2030)
11.4.2 Asia Pacific Secondary Ticket Revenue (USD Million), by Type (2023-2030)
11.4.3 Asia Pacific Secondary Ticket Revenue (USD Million), by Applications (2023-2030)
11.5 South America Secondary Ticket Revenue (USD Million), by Type, and Applications (2023-2030)
11.5.1 South America Secondary Ticket Revenue (USD Million), by Country (2023-2030)
11.5.2 South America Secondary Ticket Revenue (USD Million), by Type (2023-2030)
11.5.3 South America Secondary Ticket Revenue (USD Million), by Applications (2023-2030)
11.6 Middle East and Africa Secondary Ticket Revenue (USD Million), by Type, and Applications (2023-2030)
11.6.1 Middle East and Africa Secondary Ticket Revenue (USD Million), by region (2023-2030)
11.6.2 Middle East and Africa Secondary Ticket Revenue (USD Million), by Type (2023-2030)
11.6.3 Middle East and Africa Secondary Ticket Revenue (USD Million), by Applications (2023-2030)
12 Methodology and Data Sources
12.1 Methodology/Research Approach
12.1.1 Research Programs/Design
12.1.2 Market Size Estimation
12.1.3 Market Breakdown and Data Triangulation
12.2 Data Sources
12.2.1 Secondary Sources
12.2.2 Primary Sources
12.3 Disclaimer
List of Tables
Table 1 Market Segmentation Analysis
Table 2 Global Secondary Ticket Market Companies with Areas Served
Table 3 Products Offerings Global Secondary Ticket Market
Table 4 Low Growth Scenario Forecasts
Table 5 Reference Case Growth Scenario
Table 6 High Growth Case Scenario
Table 7 Global Secondary Ticket Revenue (USD Million) And CAGR (%) By Type (2018-2030)
Table 8 Global Secondary Ticket Revenue (USD Million) And CAGR (%) By Applications (2018-2030)
Table 9 Global Secondary Ticket Revenue (USD Million) And CAGR (%) By Regions (2018-2030)
Table 10 Global Secondary Ticket Revenue (USD Million) By Type (2018-2022)
Table 11 Global Secondary Ticket Revenue Market Share (%) By Type (2018-2022)
Table 12 Global Secondary Ticket Revenue (USD Million) By Applications (2018-2022)
Table 13 Global Secondary Ticket Revenue Market Share (%) By Applications (2018-2022)
Table 14 Global Secondary Ticket Market Revenue (USD Million) By Regions (2018-2022)
Table 15 Global Secondary Ticket Market Share (%) By Regions (2018-2022)
Table 16 North America Secondary Ticket Revenue (USD Million) By Country (2018-2022)
Table 17 North America Secondary Ticket Revenue (USD Million) By Type (2018-2022)
Table 18 North America Secondary Ticket Revenue (USD Million) By Applications (2018-2022)
Table 19 Europe Secondary Ticket Revenue (USD Million) By Country (2018-2022)
Table 20 Europe Secondary Ticket Revenue (USD Million) By Type (2018-2022)
Table 21 Europe Secondary Ticket Revenue (USD Million) By Applications (2018-2022)
Table 22 Asia Pacific Secondary Ticket Revenue (USD Million) By Country (2018-2022)
Table 23 Asia Pacific Secondary Ticket Revenue (USD Million) By Type (2018-2022)
Table 24 Asia Pacific Secondary Ticket Revenue (USD Million) By Applications (2018-2022)
Table 25 South America Secondary Ticket Revenue (USD Million) By Country (2018-2022)
Table 26 South America Secondary Ticket Revenue (USD Million) By Type (2018-2022)
Table 27 South America Secondary Ticket Revenue (USD Million) By Applications (2018-2022)
Table 28 Middle East and Africa Secondary Ticket Revenue (USD Million) By Region (2018-2022)
Table 29 Middle East and Africa Secondary Ticket Revenue (USD Million) By Type (2018-2022)
Table 30 Middle East and Africa Secondary Ticket Revenue (USD Million) By Applications (2018-2022)
Table 31 Financial Analysis
Table 32 Global Secondary Ticket Revenue (USD Million) By Type (2023-2030)
Table 33 Global Secondary Ticket Revenue Market Share (%) By Type (2023-2030)
Table 34 Global Secondary Ticket Revenue (USD Million) By Applications (2023-2030)
Table 35 Global Secondary Ticket Revenue Market Share (%) By Applications (2023-2030)
Table 36 Global Secondary Ticket Market Revenue (USD Million), And Revenue (USD Million) By Regions (2023-2030)
Table 37 North America Secondary Ticket Revenue (USD)By Country (2023-2030)
Table 38 North America Secondary Ticket Revenue (USD Million) By Type (2023-2030)
Table 39 North America Secondary Ticket Revenue (USD Million) By Applications (2023-2030)
Table 40 Europe Secondary Ticket Revenue (USD Million) By Country (2023-2030)
Table 41 Europe Secondary Ticket Revenue (USD Million) By Type (2023-2030)
Table 42 Europe Secondary Ticket Revenue (USD Million) By Applications (2023-2030)
Table 43 Asia Pacific Secondary Ticket Revenue (USD Million) By Country (2023-2030)
Table 44 Asia Pacific Secondary Ticket Revenue (USD Million) By Type (2023-2030)
Table 45 Asia Pacific Secondary Ticket Revenue (USD Million) By Applications (2023-2030)
Table 46 South America Secondary Ticket Revenue (USD Million) By Country (2023-2030)
Table 47 South America Secondary Ticket Revenue (USD Million) By Type (2023-2030)
Table 48 South America Secondary Ticket Revenue (USD Million) By Applications (2023-2030)
Table 49 Middle East and Africa Secondary Ticket Revenue (USD Million) By Region (2023-2030)
Table 50 Middle East and Africa Secondary Ticket Revenue (USD Million) By Region (2023-2030)
Table 51 Middle East and Africa Secondary Ticket Revenue (USD Million) By Type (2023-2030)
Table 52 Middle East and Africa Secondary Ticket Revenue (USD Million) By Applications (2023-2030)
Table 53 Research Programs/Design for This Report
Table 54 Key Data Information from Secondary Sources
Table 55 Key Data Information from Primary Sources
List of Figures
Figure 1 Market Scope
Figure 2 Porter’s Five Forces
Figure 3 Global Secondary Ticket Revenue (USD Million) By Type (2018-2022)
Figure 4 Global Secondary Ticket Revenue Market Share (%) By Type (2022)
Figure 5 Global Secondary Ticket Revenue (USD Million) By Applications (2018-2022)
Figure 6 Global Secondary Ticket Revenue Market Share (%) By Applications (2022)
Figure 7 Global Secondary Ticket Market Revenue (USD Million) By Regions (2018-2022)
Figure 8 Global Secondary Ticket Market Share (%) By Regions (2022)
Figure 9 North America Secondary Ticket Revenue (USD Million) By Country (2018-2022)
Figure 10 North America Secondary Ticket Revenue (USD Million) By Type (2018-2022)
Figure 11 North America Secondary Ticket Revenue (USD Million) By Applications (2018-2022)
Figure 12 Europe Secondary Ticket Revenue (USD Million) By Country (2018-2022)
Figure 13 Europe Secondary Ticket Revenue (USD Million) By Type (2018-2022)
Figure 14 Europe Secondary Ticket Revenue (USD Million) By Applications (2018-2022)
Figure 15 Asia Pacific Secondary Ticket Revenue (USD Million) By Country (2018-2022)
Figure 16 Asia Pacific Secondary Ticket Revenue (USD Million) By Type (2018-2022)
Figure 17 Asia Pacific Secondary Ticket Revenue (USD Million) By Applications (2018-2022)
Figure 18 South America Secondary Ticket Revenue (USD Million) By Country (2018-2022)
Figure 19 South America Secondary Ticket Revenue (USD Million) By Type (2018-2022)
Figure 20 South America Secondary Ticket Revenue (USD Million) By Applications (2018-2022)
Figure 21 Middle East and Africa Secondary Ticket Revenue (USD Million) By Region (2018-2022)
Figure 22 Middle East and Africa Secondary Ticket Revenue (USD Million) By Type (2018-2022)
Figure 23 Middle East and Africa Secondary Ticket Revenue (USD Million) By Applications (2018-2022)
Figure 24 Global Secondary Ticket Revenue (USD Million) By Type (2023-2030)
Figure 25 Global Secondary Ticket Revenue Market Share (%) By Type (2030)
Figure 26 Global Secondary Ticket Revenue (USD Million) By Applications (2023-2030)
Figure 27 Global Secondary Ticket Revenue Market Share (%) By Applications (2030)
Figure 28 Global Secondary Ticket Market Revenue (USD Million) By Regions (2023-2030)
Figure 29 North America Secondary Ticket Revenue (USD Million) By Country (2023-2030)
Figure 30 North America Secondary Ticket Revenue (USD Million) By Type (2023-2030)
Figure 31 North America Secondary Ticket Revenue (USD Million) By Applications (2023-2030)
Figure 32 Europe Secondary Ticket Revenue (USD Million) By Country (2023-2030)
Figure 33 Europe Secondary Ticket Revenue (USD Million) By Type (2023-2030)
Figure 34 Europe Secondary Ticket Revenue (USD Million) By Applications (2023-2030)
Figure 35 Asia Pacific Secondary Ticket Revenue (USD Million) By Country (2023-2030)
Figure 36 Asia Pacific Secondary Ticket Revenue (USD Million) By Type (2023-2030)
Figure 37 Asia Pacific Secondary Ticket Revenue (USD Million) By Applications (2023-2030)
Figure 38 South America Secondary Ticket Revenue (USD Million) By Country (2023-2030)
Figure 39 South America Secondary Ticket Revenue (USD Million) By Type (2023-2030)
Figure 40 South America Secondary Ticket Revenue (USD Million) By Applications (2023-2030)
Figure 41 Middle East and Africa Secondary Ticket Revenue (USD Million) By Region (2023-2030)
Figure 42 Middle East and Africa Secondary Ticket Revenue (USD Million) By Region (2023-2030)
Figure 43 Middle East and Africa Secondary Ticket Revenue (USD Million) By Type (2023-2030)
Figure 44 Middle East and Africa Secondary Ticket Revenue (USD Million) By Applications (2023-2030)
Figure 45 Bottom-Up and Top-Down Approaches for This Report
Figure 46 Data Triangulation
