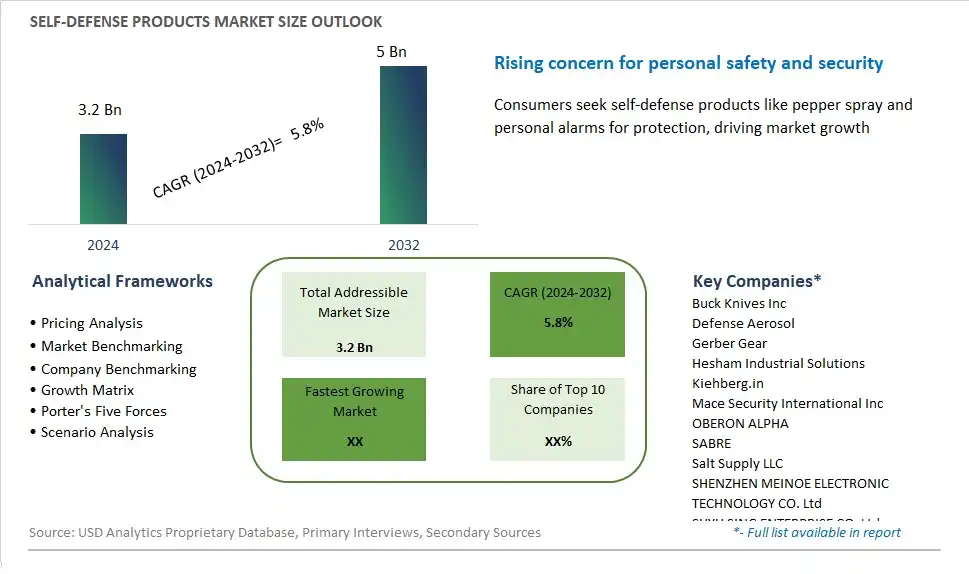
Global Self-Defense Products Market Size is valued at $3.2 Billion in 2024 and is forecast to register a growth rate (CAGR) of 5.8% to reach $5 Billion by 2032.
The global Self-Defense Products Market Comprehensive Study analyzes and forecasts the market size across 6 regions and 24 countries for diverse segments -By Product (Folding knives, Tactical gloves, Pepper sprays, Stun guns, Others), By Distribution Channel (Offline, Online)
An Introduction to Self-Defense Products Market
The Self-Defense Products Market focuses on the production and sale of personal safety and security products designed to protect individuals from harm. These include pepper sprays, stun guns, personal alarms, and self-defense training tools. The market is driven by increasing concerns about personal safety, rising awareness about self-defense, and growing demand for portable and easy-to-use safety products. Additionally, innovations in product design and materials support market growth.
Self Defense Products Competitive Landscape
The market report analyses the leading companies in the industry including Buck Knives Inc, Defense Aerosol, Gerber Gear, Hesham Industrial Solutions, Kiehberg.in, Mace Security International Inc, OBERON ALPHA, SABRE, Salt Supply LLC, SHENZHEN MEINOE ELECTRONIC TECHNOLOGY CO. Ltd, SHYH SING ENTERPRISE CO. Ltd, Unisafe Services, Victorinox AG, Zaira Enterprises, and Others.
Self Defense Products Market Dynamics
Market Trend: Increased Focus on Personal Safety
The most prominent trend in the Self-Defense Products Market is the increased focus on personal safety. As concerns about personal security rise, more individuals are seeking self-defense products to protect themselves in potentially dangerous situations. This trend is driven by heightened awareness of crime rates, the desire for empowerment, and the growing availability of self-defense training programs
Market Driver: Advancements in Self-Defense Technology
Advancements in self-defense technology are major drivers of the Self-Defense Products Market. Innovations such as compact and easily concealable devices, wearable self-defense gadgets, and non-lethal options like pepper spray and stun guns are enhancing the effectiveness and accessibility of self-defense products. These technological advancements are making self-defense tools more user-friendly and appealing to a wider audience
Market Opportunity: Expansion into Women’s Self-Defense Products
A significant opportunity in the Self-Defense Products Market lies in the expansion into women’s self-defense products. As women become more conscious of their personal safety, there is a growing demand for self-defense tools specifically designed for female users. Companies can capitalize on this opportunity by developing and marketing products that cater to women’s needs, such as lightweight, stylish, and easy-to-use self-defense devices
Self-Defense Products Market Share Analysis: Pepper Sprays is the Fastest Growing Segment to 2032
Pepper sprays are anticipated to be the fastest-growing segment in the Self-Defense Products Market by product to 2032. The demand for pepper sprays is driven by the increasing awareness of personal safety and the need for effective, non-lethal self-defense solutions. Pepper sprays are popular due to their ease of use, affordability, and effectiveness in temporarily incapacitating an attacker. Additionally, the growing availability of pepper sprays in various forms, such as keychain attachments and discreet designs, further boosts their popularity. The expansion of distribution channels, including online platforms and retail stores, supports the rapid growth of the pepper sprays segment.
Self-Defense Products Market Share Analysis: Online is the Fastest Growing Distribution Channel to 2032
The online distribution channel is expected to be the fastest-growing segment in the Self-Defense Products Market by distribution channel to 2032. The convenience and accessibility of online shopping, combined with the growing consumer preference for e-commerce, drive the rapid growth of this segment. Online platforms offer a wide variety of self-defense products, detailed product descriptions, and customer reviews, making it easier for consumers to make informed purchasing decisions. The COVID-19 pandemic has further accelerated the shift towards online shopping, as consumers seek contactless and convenient ways to purchase their preferred self-defense products. Subscription services and direct-to-consumer models also contribute to the segment's expansion.
Self Defense Products Market Segmentation
By Product
Folding knives
Tactical gloves
Pepper sprays
Stun guns
Others
By Distribution Channel
Offline
Online
Countries Analyzed
North America (US, Canada, Mexico)
Europe (Germany, UK, France, Spain, Italy, Russia, Rest of Europe)
Asia Pacific (China, India, Japan, South Korea, Australia, South East Asia, Rest of Asia)
South America (Brazil, Argentina, Rest of South America)
Middle East and Africa (Saudi Arabia, UAE, Rest of Middle East, South Africa, Egypt, Rest of Africa)
Self Defense Products Companies Profiled in the Study
Buck Knives Inc
Defense Aerosol
Gerber Gear
Hesham Industrial Solutions
Kiehberg.in
Mace Security International Inc
OBERON ALPHA
SABRE
Salt Supply LLC
SHENZHEN MEINOE ELECTRONIC TECHNOLOGY CO. Ltd
SHYH SING ENTERPRISE CO. Ltd
Unisafe Services
Victorinox AG
Zaira Enterprises
*- List Not Exhaustive
Chapter 1. TABLE OF CONTENTS
Chapter 2. Introduction to Self Defense Products Market
2.1. Market Overview
2.2. Key Statistics and Report Highlights
2.3. Scope of the Comprehensive Study
2.3.1. Market Definition
2.3.2 Countries and Regions Covered
2.3.3 Research Objective
2.3.4 Units, Currency, and Conversions
2.3.5 Industry Value Chain
2.4. Key Market Segments
2.5. Key Companies
2.6. Study Period
Chapter 3. Strategic Analysis Review
3.1. Self Defense Products Pricing Analysis and Forecast
3.2. Porter’s Five Forces
3.3. Market Ecosystem
3.4. SWOT Analysis
3.5. Regulatory Scenario
3.3. Effects of Inflation, Russia-Ukraine War, moderating economic growth, and other macroeconomic factors
Chapter 4. Competitive Landscape
4.1. Market Share Analysis
4.1.1. Global Self Defense Products Market Share by Company, 2023
4.1.2. Product Offerings of Leading Self Defense Products Companies
4.2. Market Entropy
4.2.1. New Product Launches in the Industry
4.2.2. Mergers, Acquisitions, Joint ventures, and Partnerships
4.3. Key Strategies and Best Practices
Chapter 5. Global Market Projections: Best, Reference, and Low Case Scenarios
5.1. Growth Analysis- Case Scenario Definitions
5.2. Low Growth Case Scenario Forecasts
5.3. Reference Growth Case Scenario Forecasts
5.4. High Growth Case Scenario Forecasts
Chapter 6. Market Dynamics
6.1. Self Defense Products Market Drivers
6.2. Self Defense Products Market Challenges
6.6. Self Defense Products Market Opportunities
6.4. Self Defense Products Market Trends
Chapter 7. Global Self Defense Products Market Outlook Trends
7.1. Global Self Defense Products Revenue (USD Million) and CAGR (%) by Type (2021-2032)
7.2. Global Self Defense Products Revenue (USD Million) and CAGR (%) by Application (2021-2032)
7.3. Global Self Defense Products Revenue (USD Million) and CAGR (%) by Product (2021-2032)
By Product
Folding knives
Tactical gloves
Pepper sprays
Stun guns
Others
By Distribution Channel
Offline
Online
Chapter 8. Global Self Defense Products Regional Analysis and Outlook
8.1. Global Self Defense Products Revenue (USD Million) By Regions (2021- 2032)
8.2. North America Self Defense Products Revenue (USD Million) by Country (2021-2032)
8.2.1. United States Self Defense Products Regional Analysis and Outlook
8.2.2. Canada Self Defense Products Regional Analysis and Outlook
8.2.3. Mexico Self Defense Products Regional Analysis and Outlook
8.3. Europe Self Defense Products Revenue (USD Million), by Country (2021-2032)
8.3.1. Germany Self Defense Products Regional Analysis and Outlook
8.3.2. France Self Defense Products Regional Analysis and Outlook
8.3.3. United Kingdom Self Defense Products Regional Analysis and Outlook
8.3.4. Spain Self Defense Products Regional Analysis and Outlook
8.3.5. Italy Self Defense Products Regional Analysis and Outlook
8.3.6. Russia Self Defense Products Regional Analysis and Outlook
8.3.7. Rest of Europe Self Defense Products Regional Analysis and Outlook
8.4. Asia Pacific Self Defense Products Revenue (USD Million) by Country (2021-2032)
8.4.1. China Self Defense Products Regional Analysis and Outlook
8.4.2. Japan Self Defense Products Regional Analysis and Outlook
8.4.3. India Self Defense Products Regional Analysis and Outlook
8.4.4. South Korea Self Defense Products Regional Analysis and Outlook
8.4.5. Australia Self Defense Products Regional Analysis and Outlook
8.4.6. South East Asia Self Defense Products Regional Analysis and Outlook
8.4.7. Rest of Asia Pacific Self Defense Products Regional Analysis and Outlook
8.5. South America Self Defense Products Revenue (USD Million), by Country (2021-2032)
8.5.1. Brazil Self Defense Products Regional Analysis and Outlook
8.5.2. Argentina Self Defense Products Regional Analysis and Outlook
8.5.3. Rest of South America Self Defense Products Regional Analysis and Outlook
8.6. Middle East and Africa Self Defense Products Revenue (USD Million) by Country (2021-2032)
8.6.1. Middle East Self Defense Products Regional Analysis and Outlook
8.6.2. Africa Self Defense Products Regional Analysis and Outlook
Chapter 9. North America Self Defense Products Analysis and Outlook
9.1. North America Self Defense Products Revenue (USD Million) by Segments (2021-2032)
9.1.1. North America Self Defense Products Revenue (USD Million) by Type (2021-2032)
9.1.2. North America Self Defense Products Revenue (USD Million) by Application (2021-2032)
9.1.3. North America Self Defense Products Revenue (USD Million) by Product (2021-2032)
By Product
Folding knives
Tactical gloves
Pepper sprays
Stun guns
Others
By Distribution Channel
Offline
Online
Chapter 10. Europe Self Defense Products Analysis and Outlook
10.1. Europe Self Defense Products Revenue (USD Million), by Segments (USD Million) (2021-2032)
10.1.1. Europe Self Defense Products Revenue (USD Million) by Type (2021-2032)
10.1.2. Europe Self Defense Products Revenue (USD Million) by Application (2021-2032)
10.1.3. Europe Self Defense Products Revenue (USD Million) by Product (2021-2032)
By Product
Folding knives
Tactical gloves
Pepper sprays
Stun guns
Others
By Distribution Channel
Offline
Online
Chapter 11. Asia Pacific Self Defense Products Analysis and Outlook
11.1. Asia Pacific Self Defense Products Revenue (USD Million), and Revenue (USD Million) by Segments (2021-2032)
11.1.1. Asia Pacific Self Defense Products Revenue (USD Million) by Type (2021-2032)
11.1.2. Asia Pacific Self Defense Products Revenue (USD Million) by Application (2021-2032)
11.1.3. Asia Pacific Self Defense Products Revenue (USD Million) by Product (2021-2032)
By Product
Folding knives
Tactical gloves
Pepper sprays
Stun guns
Others
By Distribution Channel
Offline
Online
Chapter 12. South America Self Defense Products Analysis and Outlook
12.1. South America Self Defense Products Revenue (USD Million), by Segments (2021-2032)
12.1.1. South America Self Defense Products Revenue (USD Million) by Type (2021-2032)
12.1.2. South America Self Defense Products Revenue (USD Million) by Application (2021-2032)
12.1.3. South America Self Defense Products Revenue (USD Million) by Product (2021-2032)
By Product
Folding knives
Tactical gloves
Pepper sprays
Stun guns
Others
By Distribution Channel
Offline
Online
Chapter 13. Middle East and Africa Self Defense Products Analysis and Outlook
13.1. Middle East and Africa Self Defense Products Revenue (USD Million), by Segments (2021-2032)
13.1.1. Middle East and Africa Self Defense Products Revenue (USD Million) by Type (2021-2032)
13.1.2. Middle East and Africa Self Defense Products Revenue (USD Million) by Application (2021-2032)
13.1.3. Middle East and Africa Self Defense Products Revenue (USD Million) by Product (2021-2032)
By Product
Folding knives
Tactical gloves
Pepper sprays
Stun guns
Others
By Distribution Channel
Offline
Online
Chapter 14. Self Defense Products Company Profiles
14.1 Business Overview
14.2 Product Profiles
14.3 SWOT Profiles
14.5 Recent Developments
14.6 Financial Profile
List of Companies
Buck Knives Inc
Defense Aerosol
Gerber Gear
Hesham Industrial Solutions
Kiehberg.in
Mace Security International Inc
OBERON ALPHA
SABRE
Salt Supply LLC
SHENZHEN MEINOE ELECTRONIC TECHNOLOGY CO. Ltd
SHYH SING ENTERPRISE CO. Ltd
Unisafe Services
Victorinox AG
Zaira Enterprises
15. Methodology and Data Sources
15.1 Customization Offerings
15.2 Subscription Services
15.3 Related Reports
15.4 Publisher Expertise
LIST OF TABLES
Table 1 Market Segmentation Analysis
Table 2 Global Self Defense Products Market Share of Leading Companies, 2023
Table 3 Product Offerings of Leading Companies
Table 4 Low Growth Scenario Forecasts
Table 5 Reference Case Growth Scenario
Table 6 High Growth Case Scenario
Table 7 Global Self Defense Products Revenue (USD Million) And CAGR (%) By Type (2021-2032)
Table 8 Global Self Defense Products Revenue (USD Million) And CAGR (%) By Application (2021-2032)
Table 9 Global Self Defense Products Revenue (USD Million) And CAGR (%) By Product (2021-2032)
Table 10 Global Self Defense Products Market Revenue (USD Million) By Regions (2021-2032)
Table 11 Global Self Defense Products Market Share (%) By Regions (2021-2032)
Table 12 North America Self Defense Products Revenue (USD Million) By Country (2021-2032)
Table 13 Europe Self Defense Products Revenue (USD Million) By Country (2021-2032)
Table 14 Asia Pacific Self Defense Products Revenue (USD Million) By Country (2021-2032)
Table 15 South America Self Defense Products Revenue (USD Million) By Country (2021-2032)
Table 16 Middle East and Africa Self Defense Products Revenue (USD Million) By Region (2021-2032)
Table 17 North America Self Defense Products Revenue (USD Million) By Type (2021-2032)
Table 18 North America Self Defense Products Revenue (USD Million) By Application (2021-2032)
Table 19 North America Self Defense Products Revenue (USD Million) By Product (2021-2032)
Table 20 Europe Self Defense Products Revenue (USD Million) By Type (2021-2032)
Table 21 Europe Self Defense Products Revenue (USD Million) By Application (2021-2032)
Table 22 Europe Self Defense Products Revenue (USD Million) By Product (2021-2032)
Table 23 Asia Pacific Self Defense Products Revenue (USD Million) By Type (2021-2032)
Table 24 Asia Pacific Self Defense Products Revenue (USD Million) By Application (2021-2032)
Table 25 Asia Pacific Self Defense Products Revenue (USD Million) By Product (2021-2032)
Table 26 South America Self Defense Products Revenue (USD Million) By Type (2021-2032)
Table 27 South America Self Defense Products Revenue (USD Million) By Application (2021-2032)
Table 28 South America Self Defense Products Revenue (USD Million) By Product (2021-2032)
Table 29 Middle East and Africa Self Defense Products Revenue (USD Million) By Type (2021-2032)
Table 30 Middle East and Africa Self Defense Products Revenue (USD Million) By Application (2021-2032)
Table 31 Middle East and Africa Self Defense Products Revenue (USD Million) By Product (2021-2032)
LIST OF FIGURES
Figure 1. Market Scope
Figure 2. Pricing Forecasts Per Unit, 2023- 2032
Figure 3. Porter’s Five Forces
Figure 4. Global Self Defense Products Market Revenue (USD Million) By Regions (2021-2032)
Figure 5. Global Self Defense Products Market Share (%) By Regions (2023)
Figure 6. North America Self Defense Products Revenue (USD Million) By Country (2021-2032)
Figure 7. United States Self Defense Products Revenue (USD Million) By Country (2021-2032)
Figure 8. Canada Self Defense Products Revenue (USD Million) By Country (2021-2032)
Figure 9. Mexico Self Defense Products Revenue (USD Million) By Country (2021-2032)
Figure 10. Europe Self Defense Products Revenue (USD Million) By Country (2021-2032)
Figure 11. Germany Self Defense Products Revenue (USD Million) By Country (2021-2032)
Figure 12. France Self Defense Products Revenue (USD Million) By Country (2021-2032)
Figure 13. United Kingdom Self Defense Products Revenue (USD Million) By Country (2021-2032)
Figure 14. Spain Self Defense Products Revenue (USD Million) By Country (2021-2032)
Figure 15. Italy Self Defense Products Revenue (USD Million) By Country (2021-2032)
Figure 16. Russia Self Defense Products Revenue (USD Million) By Country (2021-2032)
Figure 17. Rest of Europe Self Defense Products Revenue (USD Million) By Country (2021-2032)
Figure 11. Asia Pacific Self Defense Products Revenue (USD Million) By Country (2021-2032)
Figure 12. China Self Defense Products Revenue (USD Million) By Country (2021-2032)
Figure 13. Japan Self Defense Products Revenue (USD Million) By Country (2021-2032)
Figure 14. India Self Defense Products Revenue (USD Million) By Country (2021-2032)
Figure 15. South Korea Self Defense Products Revenue (USD Million) By Country (2021-2032)
Figure 16. Australia Self Defense Products Revenue (USD Million) By Country (2021-2032)
Figure 17. South East Asia Self Defense Products Revenue (USD Million) By Country (2021-2032)
Figure 18. South America Self Defense Products Revenue (USD Million) By Country (2021-2032)
Figure 19. Brazil Self Defense Products Revenue (USD Million) By Country (2021-2032)
Figure 20. Argentina Self Defense Products Revenue (USD Million) By Country (2021-2032)
Figure 21. Rest of Asia Pacific Self Defense Products Revenue (USD Million) By Country (2021-2032)
Figure 22. Middle East and Africa Self Defense Products Revenue (USD Million) By Region (2021-2032)
Figure 23. Saudi Arabia Self Defense Products Revenue (USD Million) By Region (2021-2032)
Figure 24. The UAE Self Defense Products Revenue (USD Million) By Region (2021-2032)
Figure 25. Rest of Middle East Self Defense Products Revenue (USD Million) By Region (2021-2032)
Figure 26. South Africa Self Defense Products Revenue (USD Million) By Region (2021-2032)
Figure 27. Africa Self Defense Products Revenue (USD Million) By Region (2021-2032)
Figure 28. North America Self Defense Products Revenue (USD Million) By Type (2021-2032)
Figure 29. North America Self Defense Products Revenue (USD Million) By Application (2021-2032)
Figure 30. North America Self Defense Products Revenue (USD Million) By Product (2021-2032)
Figure 31. Europe Self Defense Products Revenue (USD Million) By Type (2021-2032)
Figure 32. Europe Self Defense Products Revenue (USD Million) By Application (2021-2032)
Figure 33. Europe Self Defense Products Revenue (USD Million) By Product (2021-2032)
Figure 34. Asia Pacific Self Defense Products Revenue (USD Million) By Type (2021-2032)
Figure 35. Asia Pacific Self Defense Products Revenue (USD Million) By Application (2021-2032)
Figure 36. Asia Pacific Self Defense Products Revenue (USD Million) By Product (2021-2032)
Figure 37. South America Self Defense Products Revenue (USD Million) By Type (2021-2032)
Figure 38. South America Self Defense Products Revenue (USD Million) By Application (2021-2032)
Figure 39. South America Self Defense Products Revenue (USD Million) By Product (2021-2032)
Figure 40. Middle East and Africa Self Defense Products Revenue (USD Million) By Type (2021-2032)
Figure 41. Middle East and Africa Self Defense Products Revenue (USD Million) By Application (2021-2032)
Figure 42. Middle East and Africa Self Defense Products Revenue (USD Million) By Product (2021-2032)
By Product
Folding knives
Tactical gloves
Pepper sprays
Stun guns
Others
By Distribution Channel
Offline
Online
Countries Analyzed
North America (US, Canada, Mexico)
Europe (Germany, UK, France, Spain, Italy, Russia, Rest of Europe)
Asia Pacific (China, India, Japan, South Korea, Australia, South East Asia, Rest of Asia)
South America (Brazil, Argentina, Rest of South America)
Middle East and Africa (Saudi Arabia, UAE, Rest of Middle East, South Africa, Egypt, Rest of Africa)
