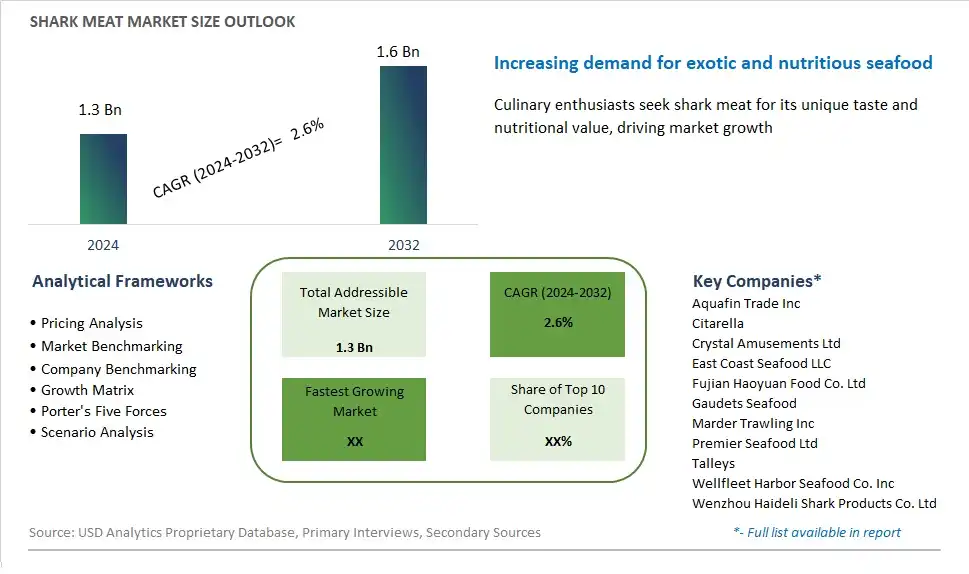
Global Shark Meat Market Size is valued at $1.3 Billion in 2024 and is forecast to register a growth rate (CAGR) of 2.6% to reach $1.6 Billion by 2032.
The global Shark Meat Market Comprehensive Study analyzes and forecasts the market size across 6 regions and 24 countries for diverse segments -By Product (Shark meat, Shark fin), By End-User (Commercial, Residential)
An Introduction to Shark Meat Market
In 2024, the shark meat market is witnessing niche growth, driven by demand in specific culinary traditions and gourmet markets. Shark meat, prized for its unique texture and flavor, is consumed in various forms, including steaks, fillets, and dried products. The market is influenced by sustainable fishing practices and regulatory frameworks aimed at preserving shark populations. Innovations in processing and preparation are enhancing the safety and appeal of shark meat. Key markets in Asia, where shark meat is a traditional delicacy, are focusing on responsible sourcing and culinary innovation. Additionally, consumer education about sustainable seafood choices is shaping market trends.
Shark Meat Competitive Landscape
The market report analyses the leading companies in the industry including Aquafin Trade Inc, Citarella, Crystal Amusements Ltd, East Coast Seafood LLC, Fujian Haoyuan Food Co. Ltd, Gaudets Seafood, Marder Trawling Inc, Premier Seafood Ltd, Talleys, Wellfleet Harbor Seafood Co. Inc , Wenzhou Haideli Shark Products Co. Ltd, and Others.
Shark Meat Market Dynamics
Shark Meat Market Trend: Sustainable and Ethical Consumption Practices in Seafood Industry
A prominent market trend in the shark meat segment is the growing emphasis on sustainable and ethical consumption practices in the seafood industry. Concerns about overfishing, habitat destruction, and the decline of shark populations have led to increased awareness among consumers about the environmental impact of shark fishing and trade. As a result, there is a rising demand for sustainably sourced and responsibly harvested shark meat products. This trend is driven by consumer preferences for ethically sourced seafood, as well as initiatives by seafood retailers, restaurants, and conservation organizations to promote sustainable fishing practices, traceability, and marine conservation efforts. Additionally, regulatory measures and certification programs aimed at ensuring the sustainability of shark fisheries and the responsible management of shark populations further contribute to this trend.
Market Driver: Cultural and Culinary Diversity in Seafood Consumption
The market driver for shark meat is the cultural and culinary diversity in seafood consumption. Shark meat is consumed in various cultures and cuisines around the world, valued for its unique taste, texture, and nutritional qualities. In some regions, shark meat is considered a delicacy and an integral part of traditional dishes and culinary heritage. Cultural preferences, dietary habits, and local fishing practices influence the demand for shark meat products in different markets. This driver is reinforced by factors such as globalization, migration, and tourism, which contribute to the exchange of culinary traditions and the availability of diverse seafood options in international markets. Moreover, the increasing popularity of seafood-based cuisines, culinary tourism, and adventurous eating experiences drive consumer interest in exploring new and exotic seafood products, including shark meat.
Market Opportunity: Development of Alternative Seafood Options and Byproducts
One potential opportunity for the shark meat market lies in the development of alternative seafood options and byproducts. Given concerns about the sustainability and conservation status of shark populations, there is an opportunity to explore alternative sources of seafood protein and innovative uses for shark byproducts. This includes promoting sustainable seafood substitutes, such as plant-based seafood analogs or alternative fish species with similar taste and texture profiles to shark meat. Additionally, there is potential to utilize shark byproducts such as fins, cartilage, and liver oil for non-food applications, including pharmaceuticals, cosmetics, and biomedical research. By diversifying product offerings and exploring value-added uses for shark resources, seafood companies can address sustainability concerns, meet consumer demand for ethical seafood choices, and create new revenue streams in the market.
Shark Meat Market Share Analysis: Shark Meat Segment held the dominant market share in 2024
In the Shark Meat Market, the shark meat segment is the largest, driven by its widespread culinary use and growing consumer demand for seafood products. Shark meat, known for its firm texture and mild flavor, is a popular ingredient in various cuisines worldwide, particularly in coastal regions where it is consumed fresh, grilled, or used in traditional dishes. Additionally, shark meat is valued for its nutritional profile, being rich in protein, vitamins, and minerals. While shark fin has historically been prized in certain cultures for its perceived medicinal properties and status symbol, increasing awareness of environmental conservation and animal welfare concerns has led to a decline in demand for shark fin products. As consumers increasingly prioritize sustainable seafood choices, the shark meat segment maintains its dominance in the market, poised for continued growth in the foreseeable future.
Shark Meat Market Share Analysis: Residential Segment market is poised to register the fastest growth rae over the forecast period to 2032
In the Shark Meat Market, the residential segment is the fastest growing, driven by the increasing popularity of shark meat consumption among individual consumers for home cooking and culinary experimentation. As culinary trends evolve and consumers seek unique and adventurous dining experiences, shark meat has gained traction as a novel protein option. Additionally, the growing availability of shark meat through specialty seafood markets, online retailers, and direct-to-consumer channels has made it more accessible to residential consumers seeking to diversify their diets. Further, the rising interest in sustainable seafood choices and the desire to support local fisheries further fuel the growth of the residential segment as consumers seek out responsibly sourced shark meat options. As home cooks continue to explore new flavors and ingredients, the residential segment of the shark meat market is poised for rapid expansion in the coming years.
Shark Meat Market Segmentation
By Product
Shark meat
Shark fin
By End-User
Commercial
Residential
Countries Analyzed
North America (US, Canada, Mexico)
Europe (Germany, UK, France, Spain, Italy, Russia, Rest of Europe)
Asia Pacific (China, India, Japan, South Korea, Australia, South East Asia, Rest of Asia)
South America (Brazil, Argentina, Rest of South America)
Middle East and Africa (Saudi Arabia, UAE, Rest of Middle East, South Africa, Egypt, Rest of Africa)
Shark Meat Companies Profiled in the Study
Aquafin Trade Inc
Citarella
Crystal Amusements Ltd
East Coast Seafood LLC
Fujian Haoyuan Food Co. Ltd
Gaudets Seafood
Marder Trawling Inc
Premier Seafood Ltd
Talleys
Wellfleet Harbor Seafood Co. Inc
Wenzhou Haideli Shark Products Co. Ltd
*- List Not Exhaustive
Chapter 1. TABLE OF CONTENTS
Chapter 2. Introduction to Shark Meat Market
2.1. Market Overview
2.2. Key Statistics and Report Highlights
2.3. Scope of the Comprehensive Study
2.3.1. Market Definition
2.3.2 Countries and Regions Covered
2.3.3 Research Objective
2.3.4 Units, Currency, and Conversions
2.3.5 Industry Value Chain
2.4. Key Market Segments
2.5. Key Companies
2.6. Study Period
Chapter 3. Strategic Analysis Review
3.1. Shark Meat Pricing Analysis and Forecast
3.2. Porter’s Five Forces
3.3. Market Ecosystem
3.4. SWOT Analysis
3.5. Regulatory Scenario
3.3. Effects of Inflation, Russia-Ukraine War, moderating economic growth, and other macroeconomic factors
Chapter 4. Competitive Landscape
4.1. Market Share Analysis
4.1.1. Global Shark Meat Market Share by Company, 2023
4.1.2. Product Offerings of Leading Shark Meat Companies
4.2. Market Entropy
4.2.1. New Product Launches in the Industry
4.2.2. Mergers, Acquisitions, Joint ventures, and Partnerships
4.3. Key Strategies and Best Practices
Chapter 5. Global Market Projections: Best, Reference, and Low Case Scenarios
5.1. Growth Analysis- Case Scenario Definitions
5.2. Low Growth Case Scenario Forecasts
5.3. Reference Growth Case Scenario Forecasts
5.4. High Growth Case Scenario Forecasts
Chapter 6. Market Dynamics
6.1. Shark Meat Market Drivers
6.2. Shark Meat Market Challenges
6.6. Shark Meat Market Opportunities
6.4. Shark Meat Market Trends
Chapter 7. Global Shark Meat Market Outlook Trends
7.1. Global Shark Meat Revenue (USD Million) and CAGR (%) by Type (2021-2032)
7.2. Global Shark Meat Revenue (USD Million) and CAGR (%) by Application (2021-2032)
7.3. Global Shark Meat Revenue (USD Million) and CAGR (%) by Product (2021-2032)
By Product
Shark meat
Shark fin
By End-User
Commercial
Residential
Chapter 8. Global Shark Meat Regional Analysis and Outlook
8.1. Global Shark Meat Revenue (USD Million) By Regions (2021- 2032)
8.2. North America Shark Meat Revenue (USD Million) by Country (2021-2032)
8.2.1. United States Shark Meat Regional Analysis and Outlook
8.2.2. Canada Shark Meat Regional Analysis and Outlook
8.2.3. Mexico Shark Meat Regional Analysis and Outlook
8.3. Europe Shark Meat Revenue (USD Million), by Country (2021-2032)
8.3.1. Germany Shark Meat Regional Analysis and Outlook
8.3.2. France Shark Meat Regional Analysis and Outlook
8.3.3. United Kingdom Shark Meat Regional Analysis and Outlook
8.3.4. Spain Shark Meat Regional Analysis and Outlook
8.3.5. Italy Shark Meat Regional Analysis and Outlook
8.3.6. Russia Shark Meat Regional Analysis and Outlook
8.3.7. Rest of Europe Shark Meat Regional Analysis and Outlook
8.4. Asia Pacific Shark Meat Revenue (USD Million) by Country (2021-2032)
8.4.1. China Shark Meat Regional Analysis and Outlook
8.4.2. Japan Shark Meat Regional Analysis and Outlook
8.4.3. India Shark Meat Regional Analysis and Outlook
8.4.4. South Korea Shark Meat Regional Analysis and Outlook
8.4.5. Australia Shark Meat Regional Analysis and Outlook
8.4.6. South East Asia Shark Meat Regional Analysis and Outlook
8.4.7. Rest of Asia Pacific Shark Meat Regional Analysis and Outlook
8.5. South America Shark Meat Revenue (USD Million), by Country (2021-2032)
8.5.1. Brazil Shark Meat Regional Analysis and Outlook
8.5.2. Argentina Shark Meat Regional Analysis and Outlook
8.5.3. Rest of South America Shark Meat Regional Analysis and Outlook
8.6. Middle East and Africa Shark Meat Revenue (USD Million) by Country (2021-2032)
8.6.1. Middle East Shark Meat Regional Analysis and Outlook
8.6.2. Africa Shark Meat Regional Analysis and Outlook
Chapter 9. North America Shark Meat Analysis and Outlook
9.1. North America Shark Meat Revenue (USD Million) by Segments (2021-2032)
9.1.1. North America Shark Meat Revenue (USD Million) by Type (2021-2032)
9.1.2. North America Shark Meat Revenue (USD Million) by Application (2021-2032)
9.1.3. North America Shark Meat Revenue (USD Million) by Product (2021-2032)
By Product
Shark meat
Shark fin
By End-User
Commercial
Residential
Chapter 10. Europe Shark Meat Analysis and Outlook
10.1. Europe Shark Meat Revenue (USD Million), by Segments (USD Million) (2021-2032)
10.1.1. Europe Shark Meat Revenue (USD Million) by Type (2021-2032)
10.1.2. Europe Shark Meat Revenue (USD Million) by Application (2021-2032)
10.1.3. Europe Shark Meat Revenue (USD Million) by Product (2021-2032)
By Product
Shark meat
Shark fin
By End-User
Commercial
Residential
Chapter 11. Asia Pacific Shark Meat Analysis and Outlook
11.1. Asia Pacific Shark Meat Revenue (USD Million), and Revenue (USD Million) by Segments (2021-2032)
11.1.1. Asia Pacific Shark Meat Revenue (USD Million) by Type (2021-2032)
11.1.2. Asia Pacific Shark Meat Revenue (USD Million) by Application (2021-2032)
11.1.3. Asia Pacific Shark Meat Revenue (USD Million) by Product (2021-2032)
By Product
Shark meat
Shark fin
By End-User
Commercial
Residential
Chapter 12. South America Shark Meat Analysis and Outlook
12.1. South America Shark Meat Revenue (USD Million), by Segments (2021-2032)
12.1.1. South America Shark Meat Revenue (USD Million) by Type (2021-2032)
12.1.2. South America Shark Meat Revenue (USD Million) by Application (2021-2032)
12.1.3. South America Shark Meat Revenue (USD Million) by Product (2021-2032)
By Product
Shark meat
Shark fin
By End-User
Commercial
Residential
Chapter 13. Middle East and Africa Shark Meat Analysis and Outlook
13.1. Middle East and Africa Shark Meat Revenue (USD Million), by Segments (2021-2032)
13.1.1. Middle East and Africa Shark Meat Revenue (USD Million) by Type (2021-2032)
13.1.2. Middle East and Africa Shark Meat Revenue (USD Million) by Application (2021-2032)
13.1.3. Middle East and Africa Shark Meat Revenue (USD Million) by Product (2021-2032)
By Product
Shark meat
Shark fin
By End-User
Commercial
Residential
Chapter 14. Shark Meat Company Profiles
14.1 Business Overview
14.2 Product Profiles
14.3 SWOT Profiles
14.5 Recent Developments
14.6 Financial Profile
List of Companies
Aquafin Trade Inc
Citarella
Crystal Amusements Ltd
East Coast Seafood LLC
Fujian Haoyuan Food Co. Ltd
Gaudets Seafood
Marder Trawling Inc
Premier Seafood Ltd
Talleys
Wellfleet Harbor Seafood Co. Inc
Wenzhou Haideli Shark Products Co. Ltd
15. Methodology and Data Sources
15.1 Customization Offerings
15.2 Subscription Services
15.3 Related Reports
15.4 Publisher Expertise
LIST OF TABLES
Table 1 Market Segmentation Analysis
Table 2 Global Shark Meat Market Share of Leading Companies, 2023
Table 3 Product Offerings of Leading Companies
Table 4 Low Growth Scenario Forecasts
Table 5 Reference Case Growth Scenario
Table 6 High Growth Case Scenario
Table 7 Global Shark Meat Revenue (USD Million) And CAGR (%) By Type (2021-2032)
Table 8 Global Shark Meat Revenue (USD Million) And CAGR (%) By Application (2021-2032)
Table 9 Global Shark Meat Revenue (USD Million) And CAGR (%) By Product (2021-2032)
Table 10 Global Shark Meat Market Revenue (USD Million) By Regions (2021-2032)
Table 11 Global Shark Meat Market Share (%) By Regions (2021-2032)
Table 12 North America Shark Meat Revenue (USD Million) By Country (2021-2032)
Table 13 Europe Shark Meat Revenue (USD Million) By Country (2021-2032)
Table 14 Asia Pacific Shark Meat Revenue (USD Million) By Country (2021-2032)
Table 15 South America Shark Meat Revenue (USD Million) By Country (2021-2032)
Table 16 Middle East and Africa Shark Meat Revenue (USD Million) By Region (2021-2032)
Table 17 North America Shark Meat Revenue (USD Million) By Type (2021-2032)
Table 18 North America Shark Meat Revenue (USD Million) By Application (2021-2032)
Table 19 North America Shark Meat Revenue (USD Million) By Product (2021-2032)
Table 20 Europe Shark Meat Revenue (USD Million) By Type (2021-2032)
Table 21 Europe Shark Meat Revenue (USD Million) By Application (2021-2032)
Table 22 Europe Shark Meat Revenue (USD Million) By Product (2021-2032)
Table 23 Asia Pacific Shark Meat Revenue (USD Million) By Type (2021-2032)
Table 24 Asia Pacific Shark Meat Revenue (USD Million) By Application (2021-2032)
Table 25 Asia Pacific Shark Meat Revenue (USD Million) By Product (2021-2032)
Table 26 South America Shark Meat Revenue (USD Million) By Type (2021-2032)
Table 27 South America Shark Meat Revenue (USD Million) By Application (2021-2032)
Table 28 South America Shark Meat Revenue (USD Million) By Product (2021-2032)
Table 29 Middle East and Africa Shark Meat Revenue (USD Million) By Type (2021-2032)
Table 30 Middle East and Africa Shark Meat Revenue (USD Million) By Application (2021-2032)
Table 31 Middle East and Africa Shark Meat Revenue (USD Million) By Product (2021-2032)
LIST OF FIGURES
Figure 1. Market Scope
Figure 2. Pricing Forecasts Per Unit, 2023- 2032
Figure 3. Porter’s Five Forces
Figure 4. Global Shark Meat Market Revenue (USD Million) By Regions (2021-2032)
Figure 5. Global Shark Meat Market Share (%) By Regions (2023)
Figure 6. North America Shark Meat Revenue (USD Million) By Country (2021-2032)
Figure 7. United States Shark Meat Revenue (USD Million) By Country (2021-2032)
Figure 8. Canada Shark Meat Revenue (USD Million) By Country (2021-2032)
Figure 9. Mexico Shark Meat Revenue (USD Million) By Country (2021-2032)
Figure 10. Europe Shark Meat Revenue (USD Million) By Country (2021-2032)
Figure 11. Germany Shark Meat Revenue (USD Million) By Country (2021-2032)
Figure 12. France Shark Meat Revenue (USD Million) By Country (2021-2032)
Figure 13. United Kingdom Shark Meat Revenue (USD Million) By Country (2021-2032)
Figure 14. Spain Shark Meat Revenue (USD Million) By Country (2021-2032)
Figure 15. Italy Shark Meat Revenue (USD Million) By Country (2021-2032)
Figure 16. Russia Shark Meat Revenue (USD Million) By Country (2021-2032)
Figure 17. Rest of Europe Shark Meat Revenue (USD Million) By Country (2021-2032)
Figure 11. Asia Pacific Shark Meat Revenue (USD Million) By Country (2021-2032)
Figure 12. China Shark Meat Revenue (USD Million) By Country (2021-2032)
Figure 13. Japan Shark Meat Revenue (USD Million) By Country (2021-2032)
Figure 14. India Shark Meat Revenue (USD Million) By Country (2021-2032)
Figure 15. South Korea Shark Meat Revenue (USD Million) By Country (2021-2032)
Figure 16. Australia Shark Meat Revenue (USD Million) By Country (2021-2032)
Figure 17. South East Asia Shark Meat Revenue (USD Million) By Country (2021-2032)
Figure 18. South America Shark Meat Revenue (USD Million) By Country (2021-2032)
Figure 19. Brazil Shark Meat Revenue (USD Million) By Country (2021-2032)
Figure 20. Argentina Shark Meat Revenue (USD Million) By Country (2021-2032)
Figure 21. Rest of Asia Pacific Shark Meat Revenue (USD Million) By Country (2021-2032)
Figure 22. Middle East and Africa Shark Meat Revenue (USD Million) By Region (2021-2032)
Figure 23. Saudi Arabia Shark Meat Revenue (USD Million) By Region (2021-2032)
Figure 24. The UAE Shark Meat Revenue (USD Million) By Region (2021-2032)
Figure 25. Rest of Middle East Shark Meat Revenue (USD Million) By Region (2021-2032)
Figure 26. South Africa Shark Meat Revenue (USD Million) By Region (2021-2032)
Figure 27. Africa Shark Meat Revenue (USD Million) By Region (2021-2032)
Figure 28. North America Shark Meat Revenue (USD Million) By Type (2021-2032)
Figure 29. North America Shark Meat Revenue (USD Million) By Application (2021-2032)
Figure 30. North America Shark Meat Revenue (USD Million) By Product (2021-2032)
Figure 31. Europe Shark Meat Revenue (USD Million) By Type (2021-2032)
Figure 32. Europe Shark Meat Revenue (USD Million) By Application (2021-2032)
Figure 33. Europe Shark Meat Revenue (USD Million) By Product (2021-2032)
Figure 34. Asia Pacific Shark Meat Revenue (USD Million) By Type (2021-2032)
Figure 35. Asia Pacific Shark Meat Revenue (USD Million) By Application (2021-2032)
Figure 36. Asia Pacific Shark Meat Revenue (USD Million) By Product (2021-2032)
Figure 37. South America Shark Meat Revenue (USD Million) By Type (2021-2032)
Figure 38. South America Shark Meat Revenue (USD Million) By Application (2021-2032)
Figure 39. South America Shark Meat Revenue (USD Million) By Product (2021-2032)
Figure 40. Middle East and Africa Shark Meat Revenue (USD Million) By Type (2021-2032)
Figure 41. Middle East and Africa Shark Meat Revenue (USD Million) By Application (2021-2032)
Figure 42. Middle East and Africa Shark Meat Revenue (USD Million) By Product (2021-2032)
By Product
Shark meat
Shark fin
By End-User
Commercial
Residential
Countries Analyzed
North America (US, Canada, Mexico)
Europe (Germany, UK, France, Spain, Italy, Russia, Rest of Europe)
Asia Pacific (China, India, Japan, South Korea, Australia, South East Asia, Rest of Asia)
South America (Brazil, Argentina, Rest of South America)
Middle East and Africa (Saudi Arabia, UAE, Rest of Middle East, South Africa, Egypt, Rest of Africa)
