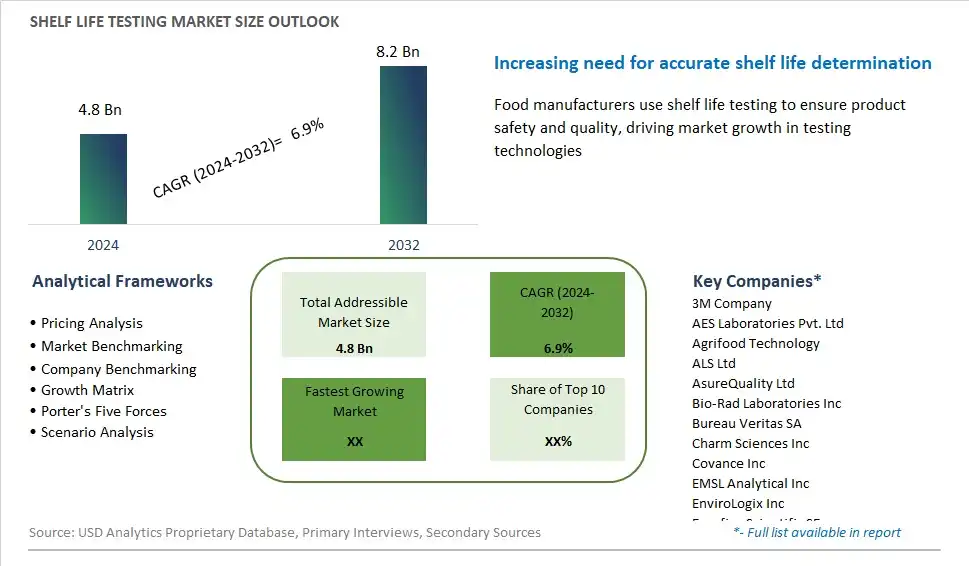
Global Shelf Life Testing Market Size is valued at $4.8 Billion in 2024 and is forecast to register a growth rate (CAGR) of 6.9% to reach $8.2 Billion by 2032.
The global Shelf Life Testing Market Comprehensive Study analyzes and forecasts the market size across 6 regions and 24 countries for diverse segments -By Technology (Equipment And Kit-Based, Manual Tests), By Parameter (Microbial Contamination, Rancidity, Nutrient Stability, Organoleptic Properties, Others), By Method (Real-Time Shelf-Life Testing, Accelerated Shelf-Life Testing), By Food Tested (Packaged Food, Beverages, Bakery And Confectionery Products, Meat And Meat Products, Dairy Products and Desserts, Processed Fruits and Vegetables, Others)
An Introduction to Shelf Life Testing Market
The Shelf Life Testing Market focuses on services and technologies used to determine the shelf life of food and beverage products. These tests ensure that products remain safe and of high quality for consumption until the end of their stated shelf life. The market is driven by stringent food safety regulations, increasing demand for packaged and convenience foods, and growing consumer awareness about food quality and safety. Additionally, advancements in testing methodologies and the expansion of the food and beverage industry support market growth.
Shelf life Testing Competitive Landscape
The market report analyses the leading companies in the industry including 3M Company, AES Laboratories Pvt. Ltd, Agrifood Technology, ALS Ltd, AsureQuality Ltd, Bio-Rad Laboratories Inc, Bureau Veritas SA, Charm Sciences Inc, Covance Inc, EMSL Analytical Inc, EnviroLogix Inc, Eurofins Scientific SE, Food Safety Net Services, Genevac Ltd, Intertek Group PLC, Medallion Labs, Mérieux NutriSciences Corp, Microbac Laboratories Inc, MilliporeSigma, Neogen Corp, NSF International, Premium Analytical Services, Q Laboratories Inc, R-Biopharm AG, RJ Hill Laboratories, Romer Labs, SCS Global Services, SGS SA, Silliker Inc, Symbio Laboratories, Thermo Fisher Scientific Inc, TÜV NORD GROUP, and Others.
Shelf life Testing Market Dynamics
Shelf life Testing Market Trend: Growing Emphasis on Food Safety and Quality Assurance
One prominent market trend in shelf life testing is the growing emphasis on food safety and quality assurance across the food industry. With increasing consumer awareness and regulatory scrutiny, there is a heightened focus on ensuring the safety, freshness, and longevity of food products throughout their shelf life. As a result, food manufacturers, retailers, and regulatory agencies are investing in comprehensive shelf life testing protocols to accurately assess the stability and durability of various food products under different storage conditions. This trend reflects a proactive approach to maintaining product integrity, reducing food waste, and meeting stringent quality standards to enhance consumer trust and satisfaction.
Market Driver: Regulatory Compliance and Industry Standards
A key driver propelling the market for shelf life testing is the need for regulatory compliance and adherence to industry standards. Government regulations, such as food labeling requirements and food safety regulations, mandate accurate shelf life dating and product labeling to ensure consumer safety and prevent misleading claims. Additionally, industry-specific standards and guidelines set by organizations like the FDA, USDA, and ISO establish criteria for shelf life determination, packaging materials, storage conditions, and shelf life testing methodologies. Compliance with these regulations and standards drives the demand for reliable shelf life testing services and technologies, as companies seek to demonstrate product quality, uphold regulatory compliance, and mitigate the risk of product recalls and liability issues.
Market Opportunity: Adoption of Advanced Analytical Technologies and Predictive Models
An opportunity within the shelf life testing market lies in the adoption of advanced analytical technologies and predictive models to enhance efficiency, accuracy, and predictive capabilities in shelf life assessment. Innovations in analytical techniques, such as chromatography, spectroscopy, microbial analysis, and accelerated aging studies, enable more precise determination of product stability, spoilage mechanisms, and degradation pathways. Furthermore, the integration of predictive modeling software and artificial intelligence algorithms allows for real-time monitoring of product quality parameters and the development of predictive models to forecast shelf life based on environmental factors, formulation characteristics, and storage conditions. By leveraging these advanced technologies and predictive tools, food manufacturers and testing laboratories can streamline shelf life testing processes, optimize product formulations, and extend the shelf life of perishable goods, thereby reducing waste and improving profitability.
Shelf Life Testing Market Share Analysis: Equipment and Kit-Based held the dominant market share in 2024
The equipment and kit-based segment dominate the shelf life testing market due to its efficiency, accuracy, and scalability in assessing the quality and stability of food, pharmaceuticals, and other perishable products. This segment involves the use of specialized equipment, instrumentation, and test kits designed to analyze various parameters such as microbial growth, oxidation, pH, moisture content, and sensory attributes to determine product shelf life and quality. Equipment-based methods, such as chromatography, spectrophotometry, and molecular testing, offer high-throughput capabilities and automation, enabling rapid and precise analysis of multiple samples simultaneously. Additionally, kit-based assays provide convenient and user-friendly solutions for on-site testing, enabling manufacturers, retailers, and regulatory agencies to monitor product quality throughout the supply chain efficiently. With increasing regulatory requirements, consumer expectations for product quality, and the need to minimize food waste, the demand for equipment and kit-based shelf life testing solutions is growing, driving the dominance of this segment in the market.
Shelf Life Testing Market Share Analysis: Microbial Contamination market is poised to register the fastest growth rae over the forecast period to 2032
The microbial contamination segment is experiencing rapid growth in the shelf life testing market due to increasing concerns over foodborne illnesses, product spoilage, and microbial safety. Microbial contamination poses significant risks to food, pharmaceuticals, and other perishable products, leading to quality deterioration, safety hazards, and economic losses. As a result, there is a growing emphasis on implementing stringent microbial testing protocols and monitoring microbial populations throughout the production, distribution, and storage stages to ensure product safety and compliance with regulatory standards. Additionally, advancements in molecular biology techniques, such as polymerase chain reaction (PCR) and next-generation sequencing (NGS), enable rapid and accurate detection and quantification of pathogenic and spoilage microorganisms, enhancing the efficiency and sensitivity of microbial testing methods. With increasing consumer demand for safe and high-quality products, driven by health consciousness and food safety awareness, the microbial contamination segment is expected to continue its rapid growth trajectory, offering opportunities for innovation and investment in microbial testing technologies and solutions in the shelf life testing market.
Shelf Life Testing Market Share Analysis: Accelerated Shelf-Life Testing held the dominant market share in 2024
Accelerated shelf-life testing dominates the shelf life testing market due to its efficiency, cost-effectiveness, and widespread adoption by industries for rapid assessment of product stability and shelf life under accelerated conditions. This method involves subjecting products to elevated temperatures, humidity, or other stress factors to simulate and accelerate the natural aging process, allowing manufacturers to predict product shelf life in a shorter time frame compared to real-time testing. Accelerated shelf-life testing enables manufacturers to expedite product development cycles, optimize formulations, and make informed decisions regarding packaging, storage, and distribution strategies. Further, accelerated testing provides valuable insights into potential product failures and quality defects, helping companies identify and mitigate risks early in the product lifecycle. As industries seek to meet consumer demand for fresher, longer-lasting products while minimizing time-to-market and production costs, the accelerated shelf-life testing segment continues to dominate the shelf life testing market, driving innovation and advancements in accelerated testing methodologies and technologies.
Shelf life Testing Market Segmentation
By Technology
Equipment And Kit-Based
Manual Tests
By Parameter
Microbial Contamination
Rancidity
Nutrient Stability
Organoleptic Properties
Others
By Method
Real-Time Shelf-Life Testing
Accelerated Shelf-Life Testing
By Food Tested
Packaged Food
Beverages
Bakery And Confectionery Products
Meat And Meat Products
Dairy Products and Desserts
Processed Fruits and Vegetables
Others
Countries Analyzed
North America (US, Canada, Mexico)
Europe (Germany, UK, France, Spain, Italy, Russia, Rest of Europe)
Asia Pacific (China, India, Japan, South Korea, Australia, South East Asia, Rest of Asia)
South America (Brazil, Argentina, Rest of South America)
Middle East and Africa (Saudi Arabia, UAE, Rest of Middle East, South Africa, Egypt, Rest of Africa)
Shelf life Testing Companies Profiled in the Study
3M Company
AES Laboratories Pvt. Ltd
Agrifood Technology
ALS Ltd
AsureQuality Ltd
Bio-Rad Laboratories Inc
Bureau Veritas SA
Charm Sciences Inc
Covance Inc
EMSL Analytical Inc
EnviroLogix Inc
Eurofins Scientific SE
Food Safety Net Services
Genevac Ltd
Intertek Group PLC
Medallion Labs
Mérieux NutriSciences Corp
Microbac Laboratories Inc
MilliporeSigma
Neogen Corp
NSF International
Premium Analytical Services
Q Laboratories Inc
R-Biopharm AG
RJ Hill Laboratories
Romer Labs
SCS Global Services
SGS SA
Silliker Inc
Symbio Laboratories
Thermo Fisher Scientific Inc
TÜV NORD GROUP
*- List Not Exhaustive
Chapter 1. TABLE OF CONTENTS
Chapter 2. Introduction to Shelf life Testing Market
2.1. Market Overview
2.2. Key Statistics and Report Highlights
2.3. Scope of the Comprehensive Study
2.3.1. Market Definition
2.3.2 Countries and Regions Covered
2.3.3 Research Objective
2.3.4 Units, Currency, and Conversions
2.3.5 Industry Value Chain
2.4. Key Market Segments
2.5. Key Companies
2.6. Study Period
Chapter 3. Strategic Analysis Review
3.1. Shelf life Testing Pricing Analysis and Forecast
3.2. Porter’s Five Forces
3.3. Market Ecosystem
3.4. SWOT Analysis
3.5. Regulatory Scenario
3.3. Effects of Inflation, Russia-Ukraine War, moderating economic growth, and other macroeconomic factors
Chapter 4. Competitive Landscape
4.1. Market Share Analysis
4.1.1. Global Shelf life Testing Market Share by Company, 2023
4.1.2. Product Offerings of Leading Shelf life Testing Companies
4.2. Market Entropy
4.2.1. New Product Launches in the Industry
4.2.2. Mergers, Acquisitions, Joint ventures, and Partnerships
4.3. Key Strategies and Best Practices
Chapter 5. Global Market Projections: Best, Reference, and Low Case Scenarios
5.1. Growth Analysis- Case Scenario Definitions
5.2. Low Growth Case Scenario Forecasts
5.3. Reference Growth Case Scenario Forecasts
5.4. High Growth Case Scenario Forecasts
Chapter 6. Market Dynamics
6.1. Shelf life Testing Market Drivers
6.2. Shelf life Testing Market Challenges
6.6. Shelf life Testing Market Opportunities
6.4. Shelf life Testing Market Trends
Chapter 7. Global Shelf life Testing Market Outlook Trends
7.1. Global Shelf life Testing Revenue (USD Million) and CAGR (%) by Type (2021-2032)
7.2. Global Shelf life Testing Revenue (USD Million) and CAGR (%) by Application (2021-2032)
7.3. Global Shelf life Testing Revenue (USD Million) and CAGR (%) by Product (2021-2032)
By Technology
Equipment And Kit-Based
Manual Tests
By Parameter
Microbial Contamination
Rancidity
Nutrient Stability
Organoleptic Properties
Others
By Method
Real-Time Shelf-Life Testing
Accelerated Shelf-Life Testing
By Food Tested
Packaged Food
Beverages
Bakery And Confectionery Products
Meat And Meat Products
Dairy Products and Desserts
Processed Fruits and Vegetables
Others
Chapter 8. Global Shelf life Testing Regional Analysis and Outlook
8.1. Global Shelf life Testing Revenue (USD Million) By Regions (2021- 2032)
8.2. North America Shelf life Testing Revenue (USD Million) by Country (2021-2032)
8.2.1. United States Shelf life Testing Regional Analysis and Outlook
8.2.2. Canada Shelf life Testing Regional Analysis and Outlook
8.2.3. Mexico Shelf life Testing Regional Analysis and Outlook
8.3. Europe Shelf life Testing Revenue (USD Million), by Country (2021-2032)
8.3.1. Germany Shelf life Testing Regional Analysis and Outlook
8.3.2. France Shelf life Testing Regional Analysis and Outlook
8.3.3. United Kingdom Shelf life Testing Regional Analysis and Outlook
8.3.4. Spain Shelf life Testing Regional Analysis and Outlook
8.3.5. Italy Shelf life Testing Regional Analysis and Outlook
8.3.6. Russia Shelf life Testing Regional Analysis and Outlook
8.3.7. Rest of Europe Shelf life Testing Regional Analysis and Outlook
8.4. Asia Pacific Shelf life Testing Revenue (USD Million) by Country (2021-2032)
8.4.1. China Shelf life Testing Regional Analysis and Outlook
8.4.2. Japan Shelf life Testing Regional Analysis and Outlook
8.4.3. India Shelf life Testing Regional Analysis and Outlook
8.4.4. South Korea Shelf life Testing Regional Analysis and Outlook
8.4.5. Australia Shelf life Testing Regional Analysis and Outlook
8.4.6. South East Asia Shelf life Testing Regional Analysis and Outlook
8.4.7. Rest of Asia Pacific Shelf life Testing Regional Analysis and Outlook
8.5. South America Shelf life Testing Revenue (USD Million), by Country (2021-2032)
8.5.1. Brazil Shelf life Testing Regional Analysis and Outlook
8.5.2. Argentina Shelf life Testing Regional Analysis and Outlook
8.5.3. Rest of South America Shelf life Testing Regional Analysis and Outlook
8.6. Middle East and Africa Shelf life Testing Revenue (USD Million) by Country (2021-2032)
8.6.1. Middle East Shelf life Testing Regional Analysis and Outlook
8.6.2. Africa Shelf life Testing Regional Analysis and Outlook
Chapter 9. North America Shelf life Testing Analysis and Outlook
9.1. North America Shelf life Testing Revenue (USD Million) by Segments (2021-2032)
9.1.1. North America Shelf life Testing Revenue (USD Million) by Type (2021-2032)
9.1.2. North America Shelf life Testing Revenue (USD Million) by Application (2021-2032)
9.1.3. North America Shelf life Testing Revenue (USD Million) by Product (2021-2032)
By Technology
Equipment And Kit-Based
Manual Tests
By Parameter
Microbial Contamination
Rancidity
Nutrient Stability
Organoleptic Properties
Others
By Method
Real-Time Shelf-Life Testing
Accelerated Shelf-Life Testing
By Food Tested
Packaged Food
Beverages
Bakery And Confectionery Products
Meat And Meat Products
Dairy Products and Desserts
Processed Fruits and Vegetables
Others
Chapter 10. Europe Shelf life Testing Analysis and Outlook
10.1. Europe Shelf life Testing Revenue (USD Million), by Segments (USD Million) (2021-2032)
10.1.1. Europe Shelf life Testing Revenue (USD Million) by Type (2021-2032)
10.1.2. Europe Shelf life Testing Revenue (USD Million) by Application (2021-2032)
10.1.3. Europe Shelf life Testing Revenue (USD Million) by Product (2021-2032)
By Technology
Equipment And Kit-Based
Manual Tests
By Parameter
Microbial Contamination
Rancidity
Nutrient Stability
Organoleptic Properties
Others
By Method
Real-Time Shelf-Life Testing
Accelerated Shelf-Life Testing
By Food Tested
Packaged Food
Beverages
Bakery And Confectionery Products
Meat And Meat Products
Dairy Products and Desserts
Processed Fruits and Vegetables
Others
Chapter 11. Asia Pacific Shelf life Testing Analysis and Outlook
11.1. Asia Pacific Shelf life Testing Revenue (USD Million), and Revenue (USD Million) by Segments (2021-2032)
11.1.1. Asia Pacific Shelf life Testing Revenue (USD Million) by Type (2021-2032)
11.1.2. Asia Pacific Shelf life Testing Revenue (USD Million) by Application (2021-2032)
11.1.3. Asia Pacific Shelf life Testing Revenue (USD Million) by Product (2021-2032)
By Technology
Equipment And Kit-Based
Manual Tests
By Parameter
Microbial Contamination
Rancidity
Nutrient Stability
Organoleptic Properties
Others
By Method
Real-Time Shelf-Life Testing
Accelerated Shelf-Life Testing
By Food Tested
Packaged Food
Beverages
Bakery And Confectionery Products
Meat And Meat Products
Dairy Products and Desserts
Processed Fruits and Vegetables
Others
Chapter 12. South America Shelf life Testing Analysis and Outlook
12.1. South America Shelf life Testing Revenue (USD Million), by Segments (2021-2032)
12.1.1. South America Shelf life Testing Revenue (USD Million) by Type (2021-2032)
12.1.2. South America Shelf life Testing Revenue (USD Million) by Application (2021-2032)
12.1.3. South America Shelf life Testing Revenue (USD Million) by Product (2021-2032)
By Technology
Equipment And Kit-Based
Manual Tests
By Parameter
Microbial Contamination
Rancidity
Nutrient Stability
Organoleptic Properties
Others
By Method
Real-Time Shelf-Life Testing
Accelerated Shelf-Life Testing
By Food Tested
Packaged Food
Beverages
Bakery And Confectionery Products
Meat And Meat Products
Dairy Products and Desserts
Processed Fruits and Vegetables
Others
Chapter 13. Middle East and Africa Shelf life Testing Analysis and Outlook
13.1. Middle East and Africa Shelf life Testing Revenue (USD Million), by Segments (2021-2032)
13.1.1. Middle East and Africa Shelf life Testing Revenue (USD Million) by Type (2021-2032)
13.1.2. Middle East and Africa Shelf life Testing Revenue (USD Million) by Application (2021-2032)
13.1.3. Middle East and Africa Shelf life Testing Revenue (USD Million) by Product (2021-2032)
By Technology
Equipment And Kit-Based
Manual Tests
By Parameter
Microbial Contamination
Rancidity
Nutrient Stability
Organoleptic Properties
Others
By Method
Real-Time Shelf-Life Testing
Accelerated Shelf-Life Testing
By Food Tested
Packaged Food
Beverages
Bakery And Confectionery Products
Meat And Meat Products
Dairy Products and Desserts
Processed Fruits and Vegetables
Others
Chapter 14. Shelf life Testing Company Profiles
14.1 Business Overview
14.2 Product Profiles
14.3 SWOT Profiles
14.5 Recent Developments
14.6 Financial Profile
List of Companies
3M Company
AES Laboratories Pvt. Ltd
Agrifood Technology
ALS Ltd
AsureQuality Ltd
Bio-Rad Laboratories Inc
Bureau Veritas SA
Charm Sciences Inc
Covance Inc
EMSL Analytical Inc
EnviroLogix Inc
Eurofins Scientific SE
Food Safety Net Services
Genevac Ltd
Intertek Group PLC
Medallion Labs
Mérieux NutriSciences Corp
Microbac Laboratories Inc
MilliporeSigma
Neogen Corp
NSF International
Premium Analytical Services
Q Laboratories Inc
R-Biopharm AG
RJ Hill Laboratories
Romer Labs
SCS Global Services
SGS SA
Silliker Inc
Symbio Laboratories
Thermo Fisher Scientific Inc
TÜV NORD GROUP
15. Methodology and Data Sources
15.1 Customization Offerings
15.2 Subscription Services
15.3 Related Reports
15.4 Publisher Expertise
LIST OF TABLES
Table 1 Market Segmentation Analysis
Table 2 Global Shelf life Testing Market Share of Leading Companies, 2023
Table 3 Product Offerings of Leading Companies
Table 4 Low Growth Scenario Forecasts
Table 5 Reference Case Growth Scenario
Table 6 High Growth Case Scenario
Table 7 Global Shelf life Testing Revenue (USD Million) And CAGR (%) By Type (2021-2032)
Table 8 Global Shelf life Testing Revenue (USD Million) And CAGR (%) By Application (2021-2032)
Table 9 Global Shelf life Testing Revenue (USD Million) And CAGR (%) By Product (2021-2032)
Table 10 Global Shelf life Testing Market Revenue (USD Million) By Regions (2021-2032)
Table 11 Global Shelf life Testing Market Share (%) By Regions (2021-2032)
Table 12 North America Shelf life Testing Revenue (USD Million) By Country (2021-2032)
Table 13 Europe Shelf life Testing Revenue (USD Million) By Country (2021-2032)
Table 14 Asia Pacific Shelf life Testing Revenue (USD Million) By Country (2021-2032)
Table 15 South America Shelf life Testing Revenue (USD Million) By Country (2021-2032)
Table 16 Middle East and Africa Shelf life Testing Revenue (USD Million) By Region (2021-2032)
Table 17 North America Shelf life Testing Revenue (USD Million) By Type (2021-2032)
Table 18 North America Shelf life Testing Revenue (USD Million) By Application (2021-2032)
Table 19 North America Shelf life Testing Revenue (USD Million) By Product (2021-2032)
Table 20 Europe Shelf life Testing Revenue (USD Million) By Type (2021-2032)
Table 21 Europe Shelf life Testing Revenue (USD Million) By Application (2021-2032)
Table 22 Europe Shelf life Testing Revenue (USD Million) By Product (2021-2032)
Table 23 Asia Pacific Shelf life Testing Revenue (USD Million) By Type (2021-2032)
Table 24 Asia Pacific Shelf life Testing Revenue (USD Million) By Application (2021-2032)
Table 25 Asia Pacific Shelf life Testing Revenue (USD Million) By Product (2021-2032)
Table 26 South America Shelf life Testing Revenue (USD Million) By Type (2021-2032)
Table 27 South America Shelf life Testing Revenue (USD Million) By Application (2021-2032)
Table 28 South America Shelf life Testing Revenue (USD Million) By Product (2021-2032)
Table 29 Middle East and Africa Shelf life Testing Revenue (USD Million) By Type (2021-2032)
Table 30 Middle East and Africa Shelf life Testing Revenue (USD Million) By Application (2021-2032)
Table 31 Middle East and Africa Shelf life Testing Revenue (USD Million) By Product (2021-2032)
LIST OF FIGURES
Figure 1. Market Scope
Figure 2. Pricing Forecasts Per Unit, 2023- 2032
Figure 3. Porter’s Five Forces
Figure 4. Global Shelf life Testing Market Revenue (USD Million) By Regions (2021-2032)
Figure 5. Global Shelf life Testing Market Share (%) By Regions (2023)
Figure 6. North America Shelf life Testing Revenue (USD Million) By Country (2021-2032)
Figure 7. United States Shelf life Testing Revenue (USD Million) By Country (2021-2032)
Figure 8. Canada Shelf life Testing Revenue (USD Million) By Country (2021-2032)
Figure 9. Mexico Shelf life Testing Revenue (USD Million) By Country (2021-2032)
Figure 10. Europe Shelf life Testing Revenue (USD Million) By Country (2021-2032)
Figure 11. Germany Shelf life Testing Revenue (USD Million) By Country (2021-2032)
Figure 12. France Shelf life Testing Revenue (USD Million) By Country (2021-2032)
Figure 13. United Kingdom Shelf life Testing Revenue (USD Million) By Country (2021-2032)
Figure 14. Spain Shelf life Testing Revenue (USD Million) By Country (2021-2032)
Figure 15. Italy Shelf life Testing Revenue (USD Million) By Country (2021-2032)
Figure 16. Russia Shelf life Testing Revenue (USD Million) By Country (2021-2032)
Figure 17. Rest of Europe Shelf life Testing Revenue (USD Million) By Country (2021-2032)
Figure 11. Asia Pacific Shelf life Testing Revenue (USD Million) By Country (2021-2032)
Figure 12. China Shelf life Testing Revenue (USD Million) By Country (2021-2032)
Figure 13. Japan Shelf life Testing Revenue (USD Million) By Country (2021-2032)
Figure 14. India Shelf life Testing Revenue (USD Million) By Country (2021-2032)
Figure 15. South Korea Shelf life Testing Revenue (USD Million) By Country (2021-2032)
Figure 16. Australia Shelf life Testing Revenue (USD Million) By Country (2021-2032)
Figure 17. South East Asia Shelf life Testing Revenue (USD Million) By Country (2021-2032)
Figure 18. South America Shelf life Testing Revenue (USD Million) By Country (2021-2032)
Figure 19. Brazil Shelf life Testing Revenue (USD Million) By Country (2021-2032)
Figure 20. Argentina Shelf life Testing Revenue (USD Million) By Country (2021-2032)
Figure 21. Rest of Asia Pacific Shelf life Testing Revenue (USD Million) By Country (2021-2032)
Figure 22. Middle East and Africa Shelf life Testing Revenue (USD Million) By Region (2021-2032)
Figure 23. Saudi Arabia Shelf life Testing Revenue (USD Million) By Region (2021-2032)
Figure 24. The UAE Shelf life Testing Revenue (USD Million) By Region (2021-2032)
Figure 25. Rest of Middle East Shelf life Testing Revenue (USD Million) By Region (2021-2032)
Figure 26. South Africa Shelf life Testing Revenue (USD Million) By Region (2021-2032)
Figure 27. Africa Shelf life Testing Revenue (USD Million) By Region (2021-2032)
Figure 28. North America Shelf life Testing Revenue (USD Million) By Type (2021-2032)
Figure 29. North America Shelf life Testing Revenue (USD Million) By Application (2021-2032)
Figure 30. North America Shelf life Testing Revenue (USD Million) By Product (2021-2032)
Figure 31. Europe Shelf life Testing Revenue (USD Million) By Type (2021-2032)
Figure 32. Europe Shelf life Testing Revenue (USD Million) By Application (2021-2032)
Figure 33. Europe Shelf life Testing Revenue (USD Million) By Product (2021-2032)
Figure 34. Asia Pacific Shelf life Testing Revenue (USD Million) By Type (2021-2032)
Figure 35. Asia Pacific Shelf life Testing Revenue (USD Million) By Application (2021-2032)
Figure 36. Asia Pacific Shelf life Testing Revenue (USD Million) By Product (2021-2032)
Figure 37. South America Shelf life Testing Revenue (USD Million) By Type (2021-2032)
Figure 38. South America Shelf life Testing Revenue (USD Million) By Application (2021-2032)
Figure 39. South America Shelf life Testing Revenue (USD Million) By Product (2021-2032)
Figure 40. Middle East and Africa Shelf life Testing Revenue (USD Million) By Type (2021-2032)
Figure 41. Middle East and Africa Shelf life Testing Revenue (USD Million) By Application (2021-2032)
Figure 42. Middle East and Africa Shelf life Testing Revenue (USD Million) By Product (2021-2032)
By Technology
Equipment And Kit-Based
Manual Tests
By Parameter
Microbial Contamination
Rancidity
Nutrient Stability
Organoleptic Properties
Others
By Method
Real-Time Shelf-Life Testing
Accelerated Shelf-Life Testing
By Food Tested
Packaged Food
Beverages
Bakery And Confectionery Products
Meat And Meat Products
Dairy Products and Desserts
Processed Fruits and Vegetables
Others
Countries Analyzed
North America (US, Canada, Mexico)
Europe (Germany, UK, France, Spain, Italy, Russia, Rest of Europe)
Asia Pacific (China, India, Japan, South Korea, Australia, South East Asia, Rest of Asia)
South America (Brazil, Argentina, Rest of South America)
Middle East and Africa (Saudi Arabia, UAE, Rest of Middle East, South Africa, Egypt, Rest of Africa)
