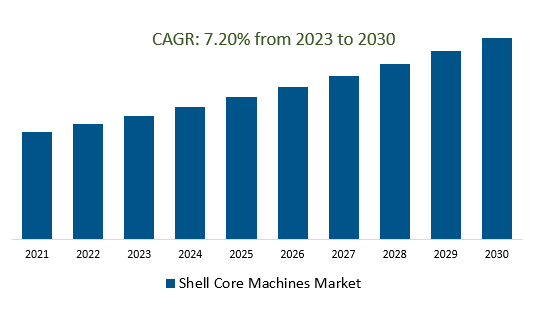
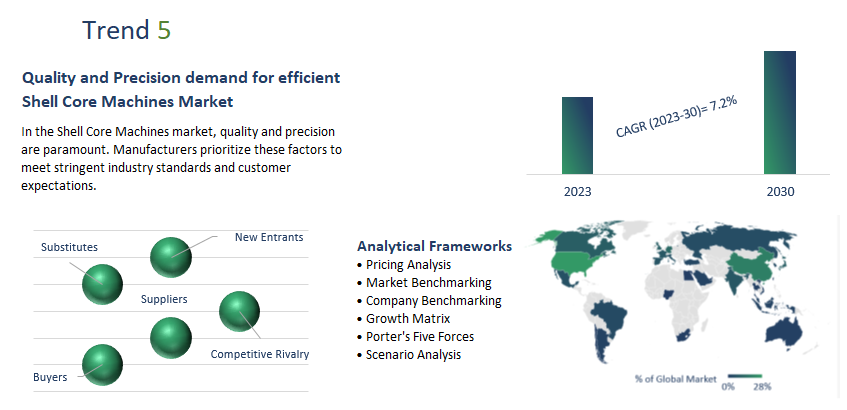
The global Shell Core Machines Market Size is estimated to register 7.2% growth over the forecast period from 2023 to 2030.
The market growth is driven by the manufacturing industry has been increasingly adopting automation and Industry technologies to enhance efficiency and productivity. Shell core machines could be integrated into automated production lines, enabling real-time data exchange and remote monitoring, leading to optimized production processes. Leading companies are focusing on Advanced Automation and Robotics, Smart Manufacturing and Industry 4.0, Green and Sustainable Solutions, Materials Innovation, Global Manufacturing Trends, Integration of AI and Machine Learning, and others to boost market shares in the industry.
Market Overview
The Shell Core Machines market involves the production and distribution of machinery used in manufacturing shell cores for metal casting in industries like automotive and aerospace. These cores are crucial for creating intricate and precise cast components. Key drivers include industrial growth, product complexity, and quality standards, while challenges involve environmental concerns and the need for skilled labor. Trends include automation, sustainability, customization, additive manufacturing, and global market expansion.
Market Trends- Companies are launching Digital Twin Technology to attract a consumer base
Digital twin technology in the Shell Core Machines market involves creating virtual replicas of physical Shell Core machines and their processes. These digital twins use real-time data from sensors and simulations to provide insights into machine performance, maintenance needs, and process optimization. By connecting physical and digital aspects, manufacturers can enhance efficiency, predict maintenance issues, and fine-tune production parameters for improved shell core quality. This technology facilitates proactive decision-making, reduces downtime, and contributes to the overall advancement of smart manufacturing practices in the industry.
In the Shell Core Machines market, quality and precision are paramount. Manufacturers prioritize these factors to meet stringent industry standards and customer expectations. Advanced technologies and engineering ensure the accurate creation of intricate shell cores, crucial for industries like aerospace and automotive. High-quality shell core machines minimize defects, leading to consistent and reliable cast components. This focus on quality and precision addresses the demands of modern manufacturing, where exacting standards and performance are essential for producing superior-end products.
Market Opportunity-Introduction of Research and Development
Research and development (R&D) play a pivotal role in the Shell Core Machines market, driving innovation and competitiveness. Manufacturers invest in R&D to enhance machine efficiency, core quality, and production processes. Ongoing research leads to the development of advanced models, incorporating automation, smart features, and sustainable practices. R&D efforts also explore novel materials and techniques to address industry challenges and evolving customer needs. By pushing technological boundaries, R&D contributes to the evolution of shell core machines, ensuring they remain at the forefront of precision casting and meet the demands of diverse industries.
Market Share Analysis - Dual Station Shell Core Machines will register the fastest growth
The global Shell Core Machines market is analyzed Dual Station across and on-premise types. Of these, Dual Station is poised to register the fastest growth. The Dual Station refers to a machine configuration designed to have two workstations or stations that can simultaneously perform core-making operations. Shell core machines are used in foundries to create sand cores, which are essential components in the casting process. Dual Station Shell Core Machine allows operators to work on two cores simultaneously, increasing efficiency and productivity. This configuration can lead to reduced cycle times and higher output, as it enables one station to be prepared while the other is in the core-making process. This setup is especially useful in high-demand foundry environments where optimizing production throughput is crucial.
Market Share Analysis- Mechanical Industry held a significant market share in 2023
The global Shell Core Machines market is analyzed across a wide range of applications including the Mechanical Industry, Steel Industry, and Others. Of these, individuals held a significant market share in 2023. In the mechanical industry, Shell Core Machines are specialized equipment used in foundries to produce shell cores, which are hollow, thin-walled structures made from sand and resin. These cores are used in metal casting processes to create complex and intricate shapes in the final metal products. The mechanical industry utilizes Shell Core Machines to manufacture core components that are integral to various mechanical and industrial applications, including automotive parts, machinery components, industrial valves, pumps, and other metal products. These machines automate the core-making process, enhancing precision, consistency, and production efficiency in the manufacturing of mechanical components.
Shell Core Machines Market Segmentation
By Type
By Application
- Mechanical Industry
- Steel Industry
- Others
By Region
- North America (United States, Canada, Mexico)
- Europe (Germany, France, United Kingdom, Spain, Italy, Others)
- Asia Pacific (China, India, Japan, South Korea, Australia, Others)
- Latin America (Brazil, Argentina, Others)
- Middle East and Africa (Saudi Arabia, UAE, Kuwait, Other Middle East, South Africa, Nigeria, Other Africa)
Shell Core Machines Market Companies
- Sinto America
- Equipment Manufacturers International
- CFM Engineers
- Redford-carver
- Bright Tech
- Saathi Foundry Solution
- Ganesh Quality Machines
- V.P. Foundry Equipment
- Alumco
- Durga Lakshmi Equipments
- Kelsons Engineers & Fabricators
- Foundry Automation
- Simpson
- B&P
- Kao Kuen Industrial
- Galaxy Machine
- Navdis Engineers
- Melling Engineered Aluminium Castings
Shell Core Machines Market Outlook 2023
1 Market Overview
1.1 Introduction to the Shell Core Machines Market
1.2 Scope of the Study
1.3 Research Objective
1.3.1 Key Market Scope and Segments
1.3.2 Players Covered
1.3.3 Years Considered
2 Executive Summary
2.1 2023 Shell Core Machines Industry- Market Statistics
3 Market Dynamics
3.1 Market Drivers
3.2 Market Challenges
3.3 Market Opportunities
3.4 Market Trends
4 Market Factor Analysis
4.1 Porter’s Five Forces
4.2 Market Entropy
4.2.1 Global Shell Core Machines Market Companies with Area Served
4.2.2 Products Offerings Global Shell Core Machines Market
5 COVID-19 Impact Analysis and Outlook Scenarios
5.1.1 Covid-19 Impact Analysis
5.1.2 Post-COVID-19 Scenario- Low Growth Case
5.1.3 Post-COVID-19 Scenario- Reference Growth Case
5.1.4 Post-COVID-19 Scenario- Low Growth Case
6 Global Shell Core Machines Market Trends
6.1 Global Shell Core Machines Revenue (USD Million) and CAGR (%) by Type (2018-2030)
6.2 Global Shell Core Machines Revenue (USD Million) and CAGR (%) by Applications (2018-2030)
6.3 Global Shell Core Machines Revenue (USD Million) and CAGR (%) by Regions (2018-2030)
7 Global Shell Core Machines Market Revenue (USD Million) by Type, and Applications (2018-2022)
7.1 Global Shell Core Machines Revenue (USD Million) by Type (2018-2022)
7.1.1 Global Shell Core Machines Revenue (USD Million), Market Share (%) by Type (2018-2022)
7.2 Global Shell Core Machines Revenue (USD Million) by Applications (2018-2022)
7.2.1 Global Shell Core Machines Revenue (USD Million), Market Share (%) by Applications (2018-2022)
8 Global Shell Core Machines Development Regional Status and Outlook
8.1 Global Shell Core Machines Revenue (USD Million) By Regions (2018-2022)
8.2 North America Shell Core Machines Revenue (USD Million) by Type, and Application (2018-2022)
8.2.1 North America Shell Core Machines Revenue (USD Million) by Country (2018-2022)
8.2.2 North America Shell Core Machines Revenue (USD Million) by Type (2018-2022)
8.2.3 North America Shell Core Machines Revenue (USD Million) by Applications (2018-2022)
8.3 Europe Shell Core Machines Revenue (USD Million), by Type, and Applications (USD Million) (2018-2022)
8.3.1 Europe Shell Core Machines Revenue (USD Million), by Country (2018-2022)
8.3.2 Europe Shell Core Machines Revenue (USD Million) by Type (2018-2022)
8.3.3 Europe Shell Core Machines Revenue (USD Million) by Applications (2018-2022)
8.4 Asia Pacific Shell Core Machines Revenue (USD Million), and Revenue (USD Million) by Type, and Applications (2018-2022)
8.4.1 Asia Pacific Shell Core Machines Revenue (USD Million) by Country (2018-2022)
8.4.2 Asia Pacific Shell Core Machines Revenue (USD Million) by Type (2018-2022)
8.4.3 Asia Pacific Shell Core Machines Revenue (USD Million) by Applications (2018-2022)
8.5 South America Shell Core Machines Revenue (USD Million), by Type, and Applications (2018-2022)
8.5.1 South America Shell Core Machines Revenue (USD Million), by Country (2018-2022)
8.5.2 South America Shell Core Machines Revenue (USD Million) by Type (2018-2022)
8.5.3 South America Shell Core Machines Revenue (USD Million) by Applications (2018-2022)
8.6 Middle East and Africa Shell Core Machines Revenue (USD Million), by Type, Technology, Application, Thickness (2018-2022)
8.6.1 Middle East and Africa Shell Core Machines Revenue (USD Million) by Country (2018-2022)
8.6.2 Middle East and Africa Shell Core Machines Revenue (USD Million) by Type (2018-2022)
8.6.3 Middle East and Africa Shell Core Machines Revenue (USD Million) by Applications (2018-2022)
9 Company Profiles
10 Global Shell Core Machines Market Revenue (USD Million), by Type, and Applications (2023-2030)
10.1 Global Shell Core Machines Revenue (USD Million) and Market Share (%) by Type (2023-2030)
10.1.1 Global Shell Core Machines Revenue (USD Million), and Market Share (%) by Type (2023-2030)
10.2 Global Shell Core Machines Revenue (USD Million) and Market Share (%) by Applications (2023-2030)
10.2.1 Global Shell Core Machines Revenue (USD Million), and Market Share (%) by Applications (2023-2030)
11 Global Shell Core Machines Development Regional Status and Outlook Forecast
11.1 Global Shell Core Machines Revenue (USD Million) By Regions (2023-2030)
11.2 North America Shell Core Machines Revenue (USD Million) by Type, and Applications (2023-2030)
11.2.1 North America Shell Core Machines Revenue (USD) Million by Country (2023-2030)
11.2.2 North America Shell Core Machines Revenue (USD Million), by Type (2023-2030)
11.2.3 North America Shell Core Machines Revenue (USD Million), Market Share (%) by Applications (2023-2030)
11.3 Europe Shell Core Machines Revenue (USD Million), by Type, and Applications (2023-2030)
11.3.1 Europe Shell Core Machines Revenue (USD Million), by Country (2023-2030)
11.3.2 Europe Shell Core Machines Revenue (USD Million), by Type (2023-2030)
11.3.3 Europe Shell Core Machines Revenue (USD Million), by Applications (2023-2030)
11.4 Asia Pacific Shell Core Machines Revenue (USD Million) by Type, and Applications (2023-2030)
11.4.1 Asia Pacific Shell Core Machines Revenue (USD Million), by Country (2023-2030)
11.4.2 Asia Pacific Shell Core Machines Revenue (USD Million), by Type (2023-2030)
11.4.3 Asia Pacific Shell Core Machines Revenue (USD Million), by Applications (2023-2030)
11.5 South America Shell Core Machines Revenue (USD Million), by Type, and Applications (2023-2030)
11.5.1 South America Shell Core Machines Revenue (USD Million), by Country (2023-2030)
11.5.2 South America Shell Core Machines Revenue (USD Million), by Type (2023-2030)
11.5.3 South America Shell Core Machines Revenue (USD Million), by Applications (2023-2030)
11.6 Middle East and Africa Shell Core Machines Revenue (USD Million), by Type, and Applications (2023-2030)
11.6.1 Middle East and Africa Shell Core Machines Revenue (USD Million), by Region (2023-2030)
11.6.2 Middle East and Africa Shell Core Machines Revenue (USD Million), by Type (2023-2030)
11.6.3 Middle East and Africa Shell Core Machines Revenue (USD Million), by Applications (2023-2030)
12 Methodology and Data Sources
12.1 Methodology/Research Approach
12.1.1 Research Programs/Design
12.1.2 Market Size Estimation
12.1.3 Market Breakdown and Data Triangulation
12.2 Data Sources
12.2.1 Secondary Sources
12.2.2 Primary Sources
12.3 Disclaimer
List of Tables
Table 1 Market Segmentation Analysis
Table 2 Global Shell Core Machines Market Companies with Areas Served
Table 3 Products Offerings Global Shell Core Machines Market
Table 4 Low Growth Scenario Forecasts
Table 5 Reference Case Growth Scenario
Table 6 High Growth Case Scenario
Table 7 Global Shell Core Machines Revenue (USD Million) And CAGR (%) By Type (2018-2030)
Table 8 Global Shell Core Machines Revenue (USD Million) And CAGR (%) By Applications (2018-2030)
Table 9 Global Shell Core Machines Revenue (USD Million) And CAGR (%) By Regions (2018-2030)
Table 10 Global Shell Core Machines Revenue (USD Million) By Type (2018-2022)
Table 11 Global Shell Core Machines Revenue Market Share (%) By Type (2018-2022)
Table 12 Global Shell Core Machines Revenue (USD Million) By Applications (2018-2022)
Table 13 Global Shell Core Machines Revenue Market Share (%) By Applications (2018-2022)
Table 14 Global Shell Core Machines Market Revenue (USD Million) By Regions (2018-2022)
Table 15 Global Shell Core Machines Market Share (%) By Regions (2018-2022)
Table 16 North America Shell Core Machines Revenue (USD Million) By Country (2018-2022)
Table 17 North America Shell Core Machines Revenue (USD Million) By Type (2018-2022)
Table 18 North America Shell Core Machines Revenue (USD Million) By Applications (2018-2022)
Table 19 Europe Shell Core Machines Revenue (USD Million) By Country (2018-2022)
Table 20 Europe Shell Core Machines Revenue (USD Million) By Type (2018-2022)
Table 21 Europe Shell Core Machines Revenue (USD Million) By Applications (2018-2022)
Table 22 Asia Pacific Shell Core Machines Revenue (USD Million) By Country (2018-2022)
Table 23 Asia Pacific Shell Core Machines Revenue (USD Million) By Type (2018-2022)
Table 24 Asia Pacific Shell Core Machines Revenue (USD Million) By Applications (2018-2022)
Table 25 South America Shell Core Machines Revenue (USD Million) By Country (2018-2022)
Table 26 South America Shell Core Machines Revenue (USD Million) By Type (2018-2022)
Table 27 South America Shell Core Machines Revenue (USD Million) By Applications (2018-2022)
Table 28 Middle East and Africa Shell Core Machines Revenue (USD Million) By Region (2018-2022)
Table 29 Middle East and Africa Shell Core Machines Revenue (USD Million) By Type (2018-2022)
Table 30 Middle East and Africa Shell Core Machines Revenue (USD Million) By Applications (2018-2022)
Table 31 Financial Analysis
Table 32 Global Shell Core Machines Revenue (USD Million) By Type (2023-2030)
Table 33 Global Shell Core Machines Revenue Market Share (%) By Type (2023-2030)
Table 34 Global Shell Core Machines Revenue (USD Million) By Applications (2023-2030)
Table 35 Global Shell Core Machines Revenue Market Share (%) By Applications (2023-2030)
Table 36 Global Shell Core Machines Market Revenue (USD Million), And Revenue (USD Million) By Regions (2023-2030)
Table 37 North America Shell Core Machines Revenue (USD)By Country (2023-2030)
Table 38 North America Shell Core Machines Revenue (USD Million) By Type (2023-2030)
Table 39 North America Shell Core Machines Revenue (USD Million) By Applications (2023-2030)
Table 40 Europe Shell Core Machines Revenue (USD Million) By Country (2023-2030)
Table 41 Europe Shell Core Machines Revenue (USD Million) By Type (2023-2030)
Table 42 Europe Shell Core Machines Revenue (USD Million) By Applications (2023-2030)
Table 43 Asia Pacific Shell Core Machines Revenue (USD Million) By Country (2023-2030)
Table 44 Asia Pacific Shell Core Machines Revenue (USD Million) By Type (2023-2030)
Table 45 Asia Pacific Shell Core Machines Revenue (USD Million) By Applications (2023-2030)
Table 46 South America Shell Core Machines Revenue (USD Million) By Country (2023-2030)
Table 47 South America Shell Core Machines Revenue (USD Million) By Type (2023-2030)
Table 48 South America Shell Core Machines Revenue (USD Million) By Applications (2023-2030)
Table 49 Middle East and Africa Shell Core Machines Revenue (USD Million) By Region (2023-2030)
Table 50 Middle East and Africa Shell Core Machines Revenue (USD Million) By Region (2023-2030)
Table 51 Middle East and Africa Shell Core Machines Revenue (USD Million) By Type (2023-2030)
Table 52 Middle East and Africa Shell Core Machines Revenue (USD Million) By Applications (2023-2030)
Table 53 Research Programs/Design for This Report
Table 54 Key Data Information from Secondary Sources
Table 55 Key Data Information from Primary Sources
List of Figures
Figure 1 Market Scope
Figure 2 Porter’s Five Forces
Figure 3 Global Shell Core Machines Revenue (USD Million) By Type (2018-2022)
Figure 4 Global Shell Core Machines Revenue Market Share (%) By Type (2022)
Figure 5 Global Shell Core Machines Revenue (USD Million) By Applications (2018-2022)
Figure 6 Global Shell Core Machines Revenue Market Share (%) By Applications (2022)
Figure 7 Global Shell Core Machines Market Revenue (USD Million) By Regions (2018-2022)
Figure 8 Global Shell Core Machines Market Share (%) By Regions (2022)
Figure 9 North America Shell Core Machines Revenue (USD Million) By Country (2018-2022)
Figure 10 North America Shell Core Machines Revenue (USD Million) By Type (2018-2022)
Figure 11 North America Shell Core Machines Revenue (USD Million) By Applications (2018-2022)
Figure 12 Europe Shell Core Machines Revenue (USD Million) By Country (2018-2022)
Figure 13 Europe Shell Core Machines Revenue (USD Million) By Type (2018-2022)
Figure 14 Europe Shell Core Machines Revenue (USD Million) By Applications (2018-2022)
Figure 15 Asia Pacific Shell Core Machines Revenue (USD Million) By Country (2018-2022)
Figure 16 Asia Pacific Shell Core Machines Revenue (USD Million) By Type (2018-2022)
Figure 17 Asia Pacific Shell Core Machines Revenue (USD Million) By Applications (2018-2022)
Figure 18 South America Shell Core Machines Revenue (USD Million) By Country (2018-2022)
Figure 19 South America Shell Core Machines Revenue (USD Million) By Type (2018-2022)
Figure 20 South America Shell Core Machines Revenue (USD Million) By Applications (2018-2022)
Figure 21 Middle East and Africa Shell Core Machines Revenue (USD Million) By Region (2018-2022)
Figure 22 Middle East and Africa Shell Core Machines Revenue (USD Million) By Type (2018-2022)
Figure 23 Middle East and Africa Shell Core Machines Revenue (USD Million) By Applications (2018-2022)
Figure 24 Global Shell Core Machines Revenue (USD Million) By Type (2023-2030)
Figure 25 Global Shell Core Machines Revenue Market Share (%) By Type (2030)
Figure 26 Global Shell Core Machines Revenue (USD Million) By Applications (2023-2030)
Figure 27 Global Shell Core Machines Revenue Market Share (%) By Applications (2030)
Figure 28 Global Shell Core Machines Market Revenue (USD Million) By Regions (2023-2030)
Figure 29 North America Shell Core Machines Revenue (USD Million) By Country (2023-2030)
Figure 30 North America Shell Core Machines Revenue (USD Million) By Type (2023-2030)
Figure 31 North America Shell Core Machines Revenue (USD Million) By Applications (2023-2030)
Figure 32 Europe Shell Core Machines Revenue (USD Million) By Country (2023-2030)
Figure 33 Europe Shell Core Machines Revenue (USD Million) By Type (2023-2030)
Figure 34 Europe Shell Core Machines Revenue (USD Million) By Applications (2023-2030)
Figure 35 Asia Pacific Shell Core Machines Revenue (USD Million) By Country (2023-2030)
Figure 36 Asia Pacific Shell Core Machines Revenue (USD Million) By Type (2023-2030)
Figure 37 Asia Pacific Shell Core Machines Revenue (USD Million) By Applications (2023-2030)
Figure 38 South America Shell Core Machines Revenue (USD Million) By Country (2023-2030)
Figure 39 South America Shell Core Machines Revenue (USD Million) By Type (2023-2030)
Figure 40 South America Shell Core Machines Revenue (USD Million) By Applications (2023-2030)
Figure 41 Middle East and Africa Shell Core Machines Revenue (USD Million) By Region (2023-2030)
Figure 42 Middle East and Africa Shell Core Machines Revenue (USD Million) By Region (2023-2030)
Figure 43 Middle East and Africa Shell Core Machines Revenue (USD Million) By Type (2023-2030)
Figure 44 Middle East and Africa Shell Core Machines Revenue (USD Million) By Applications (2023-2030)
Figure 45 Bottom-Up and Top-Down Approaches For This Report
Figure 46 Data Triangulation
