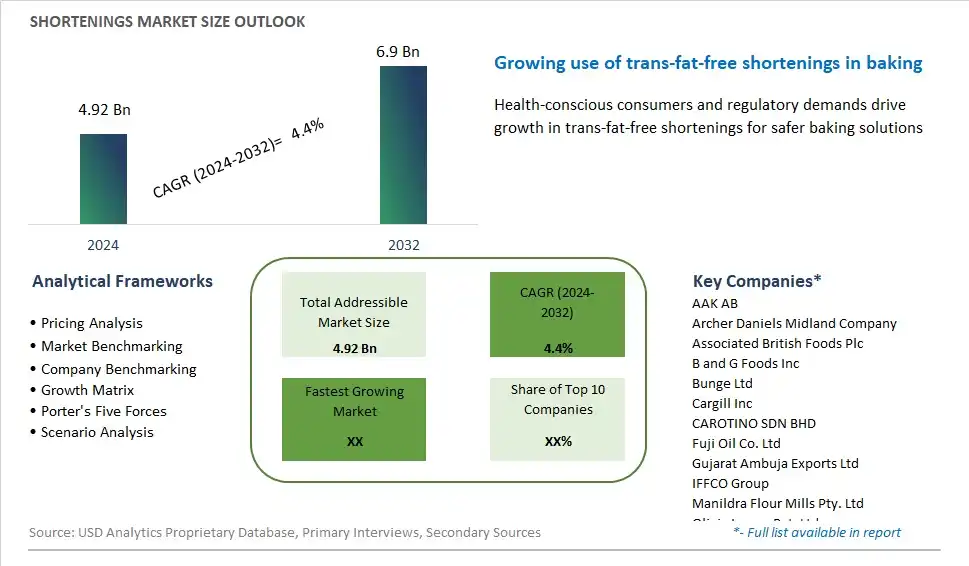
Global Shortenings Market Size is valued at $4.92 Billion in 2024 and is forecast to register a growth rate (CAGR) of 4.4% to reach $6.9 Billion by 2032.
The global Shortenings Market Comprehensive Study analyzes and forecasts the market size across 6 regions and 24 countries for diverse segments -By Ingredient (Oil, Butter, Tallow, Lard, Others), By Source (Vegetable, Animal), By Variant (Solid, Liquid, Cake/Icing, All-purpose, Others), By Application (Bakery products, Confectionery products, Snacks & savory products, Others)
An Introduction to Shortenings Market
Shortenings are fats used in baking and cooking to achieve desirable texture, mouthfeel, and flavor in 2024. Typically made from vegetable oils, shortenings are solid at room temperature and play a crucial role in creating tender and flaky pastries, cakes, biscuits, and fried foods. Shortenings provide structure to baked goods by coating flour particles and inhibiting gluten formation, resulting in a tender crumb and flaky texture. They also contribute to flavor and mouthfeel, imparting richness and moisture to finished products. With increasing demand for bakery products, fried foods, and plant-based alternatives, the market for shortenings is expanding, driven by innovations in fat blending, hydrogenation alternatives, and sustainability initiatives that offer manufacturers versatile, functional, and sustainable options to meet diverse culinary needs and consumer preferences.
Shortenings Competitive Landscape
The market report analyses the leading companies in the industry including AAK AB, Archer Daniels Midland Company, Associated British Foods Plc, B and G Foods Inc, Bunge Ltd, Cargill Inc, CAROTINO SDN BHD, Fuji Oil Co. Ltd, Gujarat Ambuja Exports Ltd, IFFCO Group, Manildra Flour Mills Pty. Ltd, Olivia Impex Pvt. Ltd, Palsgaard A/S, Premium Oils and Fats Sdn Bhd, Riken Vitamin Co. Ltd, S.S.D. Oil Mills Co. Ltd, Stratas Foods, Vantage Specialty Chemicals, Ventura Foods LLC, Wilmar International Ltd, and Others.
Shortenings Market Dynamics
Shortenings Market Trend: Shift Towards Healthier Alternatives and Clean Label Products
One prominent market trend in shortenings is the shift towards healthier alternatives and clean label products. As consumers become more health-conscious and demand transparency in food ingredients, there is a growing preference for shortenings made from natural and minimally processed ingredients. Manufacturers are responding to this trend by reformulating their shortenings to eliminate or reduce trans fats, hydrogenated oils, and artificial additives, while incorporating healthier fats such as palm oil, coconut oil, or sunflower oil. Additionally, there's an increasing focus on clean label declarations, with consumers seeking shortenings that contain recognizable, non-GMO, and sustainably sourced ingredients. This trend reflects the evolving consumer preferences towards healthier and more natural food options, driving innovation and reformulation efforts in the shortenings market.
Market Driver: Food Industry Demand for Versatile and Functional Fats
A key driver propelling the market for shortenings is the demand from the food industry for versatile and functional fats. Shortenings play a crucial role in various food applications, including baking, frying, confectionery, and pastry making, where they contribute to texture, mouthfeel, flavor, and shelf stability of the final products. The food industry relies on shortenings to achieve desired product characteristics such as flakiness in pastries, tenderness in cakes, and crispiness in fried foods. Moreover, shortenings offer functional benefits such as emulsification, aeration, and lubrication, making them essential ingredients in a wide range of food formulations. As food manufacturers seek to innovate and differentiate their products to meet consumer demands, the versatility and functionality of shortenings drive their continued use and demand across various food segments.
Market Opportunity: Development of Specialty and Customized Shortening Solutions
An opportunity within the shortenings market lies in the development of specialty and customized shortening solutions to cater to specific customer requirements and market needs. With the diversification of food products and the emergence of niche markets such as plant-based, gluten-free, and organic foods, there's a growing demand for tailor-made shortenings that can meet unique formulation and performance criteria. Manufacturers can capitalize on this opportunity by offering a range of specialty shortenings tailored to different applications, dietary preferences, and functional requirements. Additionally, there's potential for innovation in shortening technologies, such as high-stability formulations for extended shelf life, zero-trans-fat options for health-conscious consumers, and non-allergenic alternatives for those with dietary restrictions. By developing customized shortening solutions, manufacturers can address specific market niches, enhance product differentiation, and capture new opportunities in the evolving food industry landscape.
Shortenings Market Share Analysis: Oil held the dominant market share in 2024
The oil segment commands the largest share in the shortenings market due to its versatility, wide availability, and diverse applications in food processing and cooking. Vegetable oils, such as soybean oil, palm oil, and sunflower oil, are commonly used as key ingredients in shortenings due to their neutral flavor, high smoke point, and excellent emulsifying properties. Further, vegetable oils are preferred by health-conscious consumers and food manufacturers seeking healthier alternatives to animal-based fats, such as butter, tallow, and lard, as they contain lower levels of saturated fats and cholesterol. Additionally, vegetable oils offer cost advantages and stability benefits, making them suitable for various baking, frying, and confectionery applications. With increasing consumer demand for convenience foods, bakery products, and fried snacks, the oil segment continues to dominate the shortenings market, driving innovation and product development in the food industry.
Shortenings Market Share Analysis: Vegetable market is poised to register the fastest growth rae over the forecast period to 2032
The vegetable segment is experiencing rapid growth in the shortenings market due to shifting consumer preferences towards plant-based and healthier alternatives. Vegetable shortenings, derived from sources like soybean, palm, and sunflower oils, are gaining popularity among health-conscious consumers seeking products with lower levels of saturated fats and cholesterol. Additionally, vegetable shortenings are perceived as more sustainable and environmentally friendly compared to animal-based shortenings, aligning with the growing trend towards ethical and eco-conscious consumption. Furthermore, vegetable shortenings offer versatility and functionality in various cooking and baking applications, making them preferred by food manufacturers seeking cleaner label options and meeting dietary restrictions such as vegetarian and vegan diets. As consumer awareness of health and sustainability continues to rise, the vegetable segment is expected to sustain its rapid growth trajectory in the shortenings market, driving innovation and market expansion in the food industry.
Shortenings Market Share Analysis: Solid held the dominant market share in 2024
The solid variant commands the largest share in the shortenings market due to its widespread use across various baking and cooking applications. Solid shortenings, typically derived from vegetable oils like palm and soybean oil, are favored for their versatility, stability, and ability to impart desirable textures and flavors to baked goods, pastries, and fried foods. They are particularly valued in baking for their ability to create flaky and tender textures in pie crusts, biscuits, and pastries. Additionally, solid shortenings have a longer shelf life compared to liquid variants, making them convenient for storage and transportation. With the growing demand for convenience foods and bakery products worldwide, the solid variant remains a staple ingredient in commercial and home kitchens, driving its dominance in the shortenings market.
Shortenings Market Segmentation
By Ingredient
Oil
Butter
Tallow
Lard
Others
By Source
Vegetable
Animal
By Variant
Solid
Liquid
Cake/Icing
All-purpose
Others
By Application
Bakery products
Confectionery products
Snacks & savory products
Others
Countries Analyzed
North America (US, Canada, Mexico)
Europe (Germany, UK, France, Spain, Italy, Russia, Rest of Europe)
Asia Pacific (China, India, Japan, South Korea, Australia, South East Asia, Rest of Asia)
South America (Brazil, Argentina, Rest of South America)
Middle East and Africa (Saudi Arabia, UAE, Rest of Middle East, South Africa, Egypt, Rest of Africa)
Shortenings Companies Profiled in the Study
AAK AB
Archer Daniels Midland Company
Associated British Foods Plc
B and G Foods Inc
Bunge Ltd
Cargill Inc
CAROTINO SDN BHD
Fuji Oil Co. Ltd
Gujarat Ambuja Exports Ltd
IFFCO Group
Manildra Flour Mills Pty. Ltd
Olivia Impex Pvt. Ltd
Palsgaard A/S
Premium Oils and Fats Sdn Bhd
Riken Vitamin Co. Ltd
S.S.D. Oil Mills Co. Ltd
Stratas Foods
Vantage Specialty Chemicals
Ventura Foods LLC
Wilmar International Ltd
*- List Not Exhaustive
Chapter 1. TABLE OF CONTENTS
Chapter 2. Introduction to Shortenings Market
2.1. Market Overview
2.2. Key Statistics and Report Highlights
2.3. Scope of the Comprehensive Study
2.3.1. Market Definition
2.3.2 Countries and Regions Covered
2.3.3 Research Objective
2.3.4 Units, Currency, and Conversions
2.3.5 Industry Value Chain
2.4. Key Market Segments
2.5. Key Companies
2.6. Study Period
Chapter 3. Strategic Analysis Review
3.1. Shortenings Pricing Analysis and Forecast
3.2. Porter’s Five Forces
3.3. Market Ecosystem
3.4. SWOT Analysis
3.5. Regulatory Scenario
3.3. Effects of Inflation, Russia-Ukraine War, moderating economic growth, and other macroeconomic factors
Chapter 4. Competitive Landscape
4.1. Market Share Analysis
4.1.1. Global Shortenings Market Share by Company, 2023
4.1.2. Product Offerings of Leading Shortenings Companies
4.2. Market Entropy
4.2.1. New Product Launches in the Industry
4.2.2. Mergers, Acquisitions, Joint ventures, and Partnerships
4.3. Key Strategies and Best Practices
Chapter 5. Global Market Projections: Best, Reference, and Low Case Scenarios
5.1. Growth Analysis- Case Scenario Definitions
5.2. Low Growth Case Scenario Forecasts
5.3. Reference Growth Case Scenario Forecasts
5.4. High Growth Case Scenario Forecasts
Chapter 6. Market Dynamics
6.1. Shortenings Market Drivers
6.2. Shortenings Market Challenges
6.6. Shortenings Market Opportunities
6.4. Shortenings Market Trends
Chapter 7. Global Shortenings Market Outlook Trends
7.1. Global Shortenings Revenue (USD Million) and CAGR (%) by Type (2021-2032)
7.2. Global Shortenings Revenue (USD Million) and CAGR (%) by Application (2021-2032)
7.3. Global Shortenings Revenue (USD Million) and CAGR (%) by Product (2021-2032)
By Ingredient
Oil
Butter
Tallow
Lard
Others
By Source
Vegetable
Animal
By Variant
Solid
Liquid
Cake/Icing
All-purpose
Others
By Application
Bakery products
Confectionery products
Snacks & savory products
Others
Chapter 8. Global Shortenings Regional Analysis and Outlook
8.1. Global Shortenings Revenue (USD Million) By Regions (2021- 2032)
8.2. North America Shortenings Revenue (USD Million) by Country (2021-2032)
8.2.1. United States Shortenings Regional Analysis and Outlook
8.2.2. Canada Shortenings Regional Analysis and Outlook
8.2.3. Mexico Shortenings Regional Analysis and Outlook
8.3. Europe Shortenings Revenue (USD Million), by Country (2021-2032)
8.3.1. Germany Shortenings Regional Analysis and Outlook
8.3.2. France Shortenings Regional Analysis and Outlook
8.3.3. United Kingdom Shortenings Regional Analysis and Outlook
8.3.4. Spain Shortenings Regional Analysis and Outlook
8.3.5. Italy Shortenings Regional Analysis and Outlook
8.3.6. Russia Shortenings Regional Analysis and Outlook
8.3.7. Rest of Europe Shortenings Regional Analysis and Outlook
8.4. Asia Pacific Shortenings Revenue (USD Million) by Country (2021-2032)
8.4.1. China Shortenings Regional Analysis and Outlook
8.4.2. Japan Shortenings Regional Analysis and Outlook
8.4.3. India Shortenings Regional Analysis and Outlook
8.4.4. South Korea Shortenings Regional Analysis and Outlook
8.4.5. Australia Shortenings Regional Analysis and Outlook
8.4.6. South East Asia Shortenings Regional Analysis and Outlook
8.4.7. Rest of Asia Pacific Shortenings Regional Analysis and Outlook
8.5. South America Shortenings Revenue (USD Million), by Country (2021-2032)
8.5.1. Brazil Shortenings Regional Analysis and Outlook
8.5.2. Argentina Shortenings Regional Analysis and Outlook
8.5.3. Rest of South America Shortenings Regional Analysis and Outlook
8.6. Middle East and Africa Shortenings Revenue (USD Million) by Country (2021-2032)
8.6.1. Middle East Shortenings Regional Analysis and Outlook
8.6.2. Africa Shortenings Regional Analysis and Outlook
Chapter 9. North America Shortenings Analysis and Outlook
9.1. North America Shortenings Revenue (USD Million) by Segments (2021-2032)
9.1.1. North America Shortenings Revenue (USD Million) by Type (2021-2032)
9.1.2. North America Shortenings Revenue (USD Million) by Application (2021-2032)
9.1.3. North America Shortenings Revenue (USD Million) by Product (2021-2032)
By Ingredient
Oil
Butter
Tallow
Lard
Others
By Source
Vegetable
Animal
By Variant
Solid
Liquid
Cake/Icing
All-purpose
Others
By Application
Bakery products
Confectionery products
Snacks & savory products
Others
Chapter 10. Europe Shortenings Analysis and Outlook
10.1. Europe Shortenings Revenue (USD Million), by Segments (USD Million) (2021-2032)
10.1.1. Europe Shortenings Revenue (USD Million) by Type (2021-2032)
10.1.2. Europe Shortenings Revenue (USD Million) by Application (2021-2032)
10.1.3. Europe Shortenings Revenue (USD Million) by Product (2021-2032)
By Ingredient
Oil
Butter
Tallow
Lard
Others
By Source
Vegetable
Animal
By Variant
Solid
Liquid
Cake/Icing
All-purpose
Others
By Application
Bakery products
Confectionery products
Snacks & savory products
Others
Chapter 11. Asia Pacific Shortenings Analysis and Outlook
11.1. Asia Pacific Shortenings Revenue (USD Million), and Revenue (USD Million) by Segments (2021-2032)
11.1.1. Asia Pacific Shortenings Revenue (USD Million) by Type (2021-2032)
11.1.2. Asia Pacific Shortenings Revenue (USD Million) by Application (2021-2032)
11.1.3. Asia Pacific Shortenings Revenue (USD Million) by Product (2021-2032)
By Ingredient
Oil
Butter
Tallow
Lard
Others
By Source
Vegetable
Animal
By Variant
Solid
Liquid
Cake/Icing
All-purpose
Others
By Application
Bakery products
Confectionery products
Snacks & savory products
Others
Chapter 12. South America Shortenings Analysis and Outlook
12.1. South America Shortenings Revenue (USD Million), by Segments (2021-2032)
12.1.1. South America Shortenings Revenue (USD Million) by Type (2021-2032)
12.1.2. South America Shortenings Revenue (USD Million) by Application (2021-2032)
12.1.3. South America Shortenings Revenue (USD Million) by Product (2021-2032)
By Ingredient
Oil
Butter
Tallow
Lard
Others
By Source
Vegetable
Animal
By Variant
Solid
Liquid
Cake/Icing
All-purpose
Others
By Application
Bakery products
Confectionery products
Snacks & savory products
Others
Chapter 13. Middle East and Africa Shortenings Analysis and Outlook
13.1. Middle East and Africa Shortenings Revenue (USD Million), by Segments (2021-2032)
13.1.1. Middle East and Africa Shortenings Revenue (USD Million) by Type (2021-2032)
13.1.2. Middle East and Africa Shortenings Revenue (USD Million) by Application (2021-2032)
13.1.3. Middle East and Africa Shortenings Revenue (USD Million) by Product (2021-2032)
By Ingredient
Oil
Butter
Tallow
Lard
Others
By Source
Vegetable
Animal
By Variant
Solid
Liquid
Cake/Icing
All-purpose
Others
By Application
Bakery products
Confectionery products
Snacks & savory products
Others
Chapter 14. Shortenings Company Profiles
14.1 Business Overview
14.2 Product Profiles
14.3 SWOT Profiles
14.5 Recent Developments
14.6 Financial Profile
List of Companies
AAK AB
Archer Daniels Midland Company
Associated British Foods Plc
B and G Foods Inc
Bunge Ltd
Cargill Inc
CAROTINO SDN BHD
Fuji Oil Co. Ltd
Gujarat Ambuja Exports Ltd
IFFCO Group
Manildra Flour Mills Pty. Ltd
Olivia Impex Pvt. Ltd
Palsgaard A/S
Premium Oils and Fats Sdn Bhd
Riken Vitamin Co. Ltd
S.S.D. Oil Mills Co. Ltd
Stratas Foods
Vantage Specialty Chemicals
Ventura Foods LLC
Wilmar International Ltd
15. Methodology and Data Sources
15.1 Customization Offerings
15.2 Subscription Services
15.3 Related Reports
15.4 Publisher Expertise
LIST OF TABLES
Table 1 Market Segmentation Analysis
Table 2 Global Shortenings Market Share of Leading Companies, 2023
Table 3 Product Offerings of Leading Companies
Table 4 Low Growth Scenario Forecasts
Table 5 Reference Case Growth Scenario
Table 6 High Growth Case Scenario
Table 7 Global Shortenings Revenue (USD Million) And CAGR (%) By Type (2021-2032)
Table 8 Global Shortenings Revenue (USD Million) And CAGR (%) By Application (2021-2032)
Table 9 Global Shortenings Revenue (USD Million) And CAGR (%) By Product (2021-2032)
Table 10 Global Shortenings Market Revenue (USD Million) By Regions (2021-2032)
Table 11 Global Shortenings Market Share (%) By Regions (2021-2032)
Table 12 North America Shortenings Revenue (USD Million) By Country (2021-2032)
Table 13 Europe Shortenings Revenue (USD Million) By Country (2021-2032)
Table 14 Asia Pacific Shortenings Revenue (USD Million) By Country (2021-2032)
Table 15 South America Shortenings Revenue (USD Million) By Country (2021-2032)
Table 16 Middle East and Africa Shortenings Revenue (USD Million) By Region (2021-2032)
Table 17 North America Shortenings Revenue (USD Million) By Type (2021-2032)
Table 18 North America Shortenings Revenue (USD Million) By Application (2021-2032)
Table 19 North America Shortenings Revenue (USD Million) By Product (2021-2032)
Table 20 Europe Shortenings Revenue (USD Million) By Type (2021-2032)
Table 21 Europe Shortenings Revenue (USD Million) By Application (2021-2032)
Table 22 Europe Shortenings Revenue (USD Million) By Product (2021-2032)
Table 23 Asia Pacific Shortenings Revenue (USD Million) By Type (2021-2032)
Table 24 Asia Pacific Shortenings Revenue (USD Million) By Application (2021-2032)
Table 25 Asia Pacific Shortenings Revenue (USD Million) By Product (2021-2032)
Table 26 South America Shortenings Revenue (USD Million) By Type (2021-2032)
Table 27 South America Shortenings Revenue (USD Million) By Application (2021-2032)
Table 28 South America Shortenings Revenue (USD Million) By Product (2021-2032)
Table 29 Middle East and Africa Shortenings Revenue (USD Million) By Type (2021-2032)
Table 30 Middle East and Africa Shortenings Revenue (USD Million) By Application (2021-2032)
Table 31 Middle East and Africa Shortenings Revenue (USD Million) By Product (2021-2032)
LIST OF FIGURES
Figure 1. Market Scope
Figure 2. Pricing Forecasts Per Unit, 2023- 2032
Figure 3. Porter’s Five Forces
Figure 4. Global Shortenings Market Revenue (USD Million) By Regions (2021-2032)
Figure 5. Global Shortenings Market Share (%) By Regions (2023)
Figure 6. North America Shortenings Revenue (USD Million) By Country (2021-2032)
Figure 7. United States Shortenings Revenue (USD Million) By Country (2021-2032)
Figure 8. Canada Shortenings Revenue (USD Million) By Country (2021-2032)
Figure 9. Mexico Shortenings Revenue (USD Million) By Country (2021-2032)
Figure 10. Europe Shortenings Revenue (USD Million) By Country (2021-2032)
Figure 11. Germany Shortenings Revenue (USD Million) By Country (2021-2032)
Figure 12. France Shortenings Revenue (USD Million) By Country (2021-2032)
Figure 13. United Kingdom Shortenings Revenue (USD Million) By Country (2021-2032)
Figure 14. Spain Shortenings Revenue (USD Million) By Country (2021-2032)
Figure 15. Italy Shortenings Revenue (USD Million) By Country (2021-2032)
Figure 16. Russia Shortenings Revenue (USD Million) By Country (2021-2032)
Figure 17. Rest of Europe Shortenings Revenue (USD Million) By Country (2021-2032)
Figure 11. Asia Pacific Shortenings Revenue (USD Million) By Country (2021-2032)
Figure 12. China Shortenings Revenue (USD Million) By Country (2021-2032)
Figure 13. Japan Shortenings Revenue (USD Million) By Country (2021-2032)
Figure 14. India Shortenings Revenue (USD Million) By Country (2021-2032)
Figure 15. South Korea Shortenings Revenue (USD Million) By Country (2021-2032)
Figure 16. Australia Shortenings Revenue (USD Million) By Country (2021-2032)
Figure 17. South East Asia Shortenings Revenue (USD Million) By Country (2021-2032)
Figure 18. South America Shortenings Revenue (USD Million) By Country (2021-2032)
Figure 19. Brazil Shortenings Revenue (USD Million) By Country (2021-2032)
Figure 20. Argentina Shortenings Revenue (USD Million) By Country (2021-2032)
Figure 21. Rest of Asia Pacific Shortenings Revenue (USD Million) By Country (2021-2032)
Figure 22. Middle East and Africa Shortenings Revenue (USD Million) By Region (2021-2032)
Figure 23. Saudi Arabia Shortenings Revenue (USD Million) By Region (2021-2032)
Figure 24. The UAE Shortenings Revenue (USD Million) By Region (2021-2032)
Figure 25. Rest of Middle East Shortenings Revenue (USD Million) By Region (2021-2032)
Figure 26. South Africa Shortenings Revenue (USD Million) By Region (2021-2032)
Figure 27. Africa Shortenings Revenue (USD Million) By Region (2021-2032)
Figure 28. North America Shortenings Revenue (USD Million) By Type (2021-2032)
Figure 29. North America Shortenings Revenue (USD Million) By Application (2021-2032)
Figure 30. North America Shortenings Revenue (USD Million) By Product (2021-2032)
Figure 31. Europe Shortenings Revenue (USD Million) By Type (2021-2032)
Figure 32. Europe Shortenings Revenue (USD Million) By Application (2021-2032)
Figure 33. Europe Shortenings Revenue (USD Million) By Product (2021-2032)
Figure 34. Asia Pacific Shortenings Revenue (USD Million) By Type (2021-2032)
Figure 35. Asia Pacific Shortenings Revenue (USD Million) By Application (2021-2032)
Figure 36. Asia Pacific Shortenings Revenue (USD Million) By Product (2021-2032)
Figure 37. South America Shortenings Revenue (USD Million) By Type (2021-2032)
Figure 38. South America Shortenings Revenue (USD Million) By Application (2021-2032)
Figure 39. South America Shortenings Revenue (USD Million) By Product (2021-2032)
Figure 40. Middle East and Africa Shortenings Revenue (USD Million) By Type (2021-2032)
Figure 41. Middle East and Africa Shortenings Revenue (USD Million) By Application (2021-2032)
Figure 42. Middle East and Africa Shortenings Revenue (USD Million) By Product (2021-2032)
By Ingredient
Oil
Butter
Tallow
Lard
Others
By Source
Vegetable
Animal
By Variant
Solid
Liquid
Cake/Icing
All-purpose
Others
By Application
Bakery products
Confectionery products
Snacks & savory products
Others
Countries Analyzed
North America (US, Canada, Mexico)
Europe (Germany, UK, France, Spain, Italy, Russia, Rest of Europe)
Asia Pacific (China, India, Japan, South Korea, Australia, South East Asia, Rest of Asia)
South America (Brazil, Argentina, Rest of South America)
Middle East and Africa (Saudi Arabia, UAE, Rest of Middle East, South Africa, Egypt, Rest of Africa)
