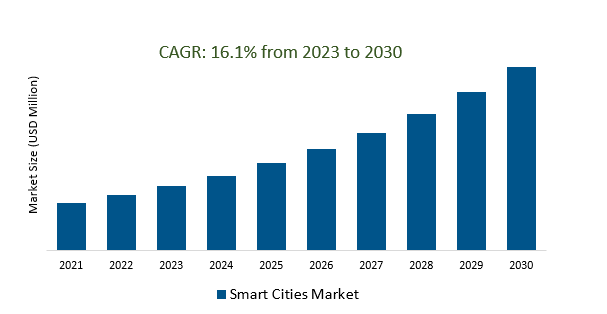
The Global Smart Cities Market Size is estimated to register 16.1% growth over the forecast period from 2023 to 2030.
The Smart Cities Market is influenced by factors such as urbanization, environmental sustainability, infrastructure modernization, IoT and connectivity, data analytics and AI, mobility solutions, energy efficiency, security and safety, citizen engagement, public-private partnerships, resilience planning, economic development, health and wellbeing, and regulations and standards. Urbanization is a growing trend, putting pressure on city infrastructure and services. Environmental sustainability is prioritized, with smart technologies like IoT sensors and data analytics being used to monitor energy consumption and promote clean energy sources. Infrastructure modernization is also a key focus, with the Internet of Things (IoT) enabling sensor deployment and data collection. Data analytics and AI are crucial for decision-making, traffic management, and healthcare services. Smart cities also focus on energy efficiency, security, and citizen engagement, with collaborations between governments, private companies, and academic institutions.
The Growing Shift to Cities and the Imperative for Smart Solutions is boosting the market.
The global trend towards urbanization is accelerating at an unprecedented pace, with more and more people flocking to cities in search of better opportunities and improved quality of life. This demographic shift has created a pressing need for innovative and sustainable urban solutions, giving rise to the burgeoning Smart Cities market. Smart Cities harness cutting-edge technologies such as IoT (Internet of Things), AI (Artificial Intelligence), and data analytics to enhance urban infrastructure, transportation systems, energy management, and public services. These smart solutions are imperative in addressing the challenges of urbanization, including traffic congestion, pollution, resource scarcity, and efficient governance. As governments and municipalities increasingly prioritize the development of smart cities, the market is experiencing significant growth, driven by a shared vision of creating more liveable, efficient, and sustainable urban environments for the future.
Smart Cities Initiatives Targeting Infrastructure Modernization is creating the demand in the market.
The rise of Smart Cities Initiatives targeting infrastructure modernization has become a driving force in the burgeoning Smart Cities Market. These initiatives encompass a wide array of technological advancements, ranging from the implementation of IoT (Internet of Things) devices to the development of efficient transportation systems and sustainable energy solutions. As urban centers grapple with the challenges of population growth and environmental sustainability, the demand for innovative solutions has never been greater. This trend not only aims to enhance the quality of life for urban residents but also to optimize resource allocation and reduce environmental impact. The Smart Cities Market is poised for significant growth as governments and private sector players invest in transformative technologies to build the cities of the future.
Enhancing Sustainability and Security in Smart Cities by Prioritizing Energy Efficiency and Advanced Safety Measures is attracting a wide customer base.
The prioritization of energy efficiency and advanced safety measures in smart cities is proving to be a compelling proposition, garnering significant attention and a broad customer base within the burgeoning Smart Cities Market. By focusing on energy-efficient solutions, these smart cities are not only reducing their environmental footprint but also optimizing resource allocation, ultimately leading to cost savings and a more sustainable urban environment. Moreover, the implementation of advanced safety measures enhances the overall security and well-being of residents, making these cities more attractive places to live and work. This dual emphasis on sustainability and security is not only aligning with the growing environmental consciousness of citizens but also attracting investments and partnerships from both public and private sectors, further propelling the smart city revolution.
Market Share Analysis:
Transportation is the most dominant application in the smart cities market.
Transportation plays a pivotal role in shaping the landscape of smart cities, serving as the backbone of urban connectivity and efficiency. With the rapid urbanization trend, cities worldwide are prioritizing innovative transportation solutions to alleviate congestion, reduce emissions, and enhance overall mobility. From autonomous vehicles and electric public transit systems to bike-sharing programs and intelligent traffic management, smart cities are revolutionizing the way people move within urban environments. This transformation not only fosters convenience but also promotes sustainability and improved quality of life for residents. As transportation becomes increasingly integrated with cutting-edge technologies like IoT sensors and AI-driven traffic optimization, it underscores the significance of this sector in the broader smart cities market. The continued growth and development of smart transportation solutions promise a more connected and sustainable urban future.
Smart Cities Market Segmentation
Type
Transportation
- Components
- Solutions
- Services
Buildings
- Components
- Solutions
- Services
Smart Utility
- Components
- Solutions
- Services
Application
- Citizen Service
- Smart Healthcare
- Smart Education
- Smart Safety
- smart lighting
- eGovernance
By Region
- North America (United States, Canada, Mexico)
- Europe (Germany, France, United Kingdom, Spain, Italy, Others)
- Asia Pacific (China, India, Japan, South Korea, Australia, Others)
- Latin America (Brazil, Argentina, Others)
- Middle East and Africa (Saudi Arabia, UAE, Kuwait, Other Middle East, South Africa, Nigeria, Other Africa)
Smart Cities Market Companies
- Siemens
- Cisco
- Hitachi
- IBM
- Microsoft
- Schneider Electric
- Huawei
- Intel
- NEC
- ABB
- Ericsson
*List not exhaustive
Smart Cities Market Outlook 2023
1 Market Overview
1.1 Introduction to the Smart Cities Market
1.2 Scope of the Study
1.3 Research Objective
1.3.1 Key Market Scope and Segments
1.3.2 Players Covered
1.3.3 Years Considered
2 Executive Summary
2.1 2023 Smart Cities Industry- Market Statistics
3 Market Dynamics
3.1 Market Drivers
3.2 Market Challenges
3.3 Market Opportunities
3.4 Market Trends
4 Market Factor Analysis
4.1 Porter’s Five Forces
4.2 Market Entropy
4.2.1 Global Smart Cities Market Companies with Area Served
4.2.2 Products Offerings Global Smart Cities Market
5 COVID-19 Impact Analysis and Outlook Scenarios
5.1.1 Covid-19 Impact Analysis
5.1.2 post-COVID-19 Scenario- Low Growth Case
5.1.3 post-COVID-19 Scenario- Reference Growth Case
5.1.4 post-COVID-19 Scenario- Low Growth Case
6 Global Smart Cities Market Trends
6.1 Global Smart Cities Revenue (USD Million) and CAGR (%) by Type (2018-2030)
6.2 Global Smart Cities Revenue (USD Million) and CAGR (%) by Applications (2018-2030)
6.3 Global Smart Cities Revenue (USD Million) and CAGR (%) by regions (2018-2030)
7 Global Smart Cities Market Revenue (USD Million) by Type, and Applications (2018-2022)
7.1 Global Smart Cities Revenue (USD Million) by Type (2018-2022)
7.1.1 Global Smart Cities Revenue (USD Million), Market Share (%) by Type (2018-2022)
7.2 Global Smart Cities Revenue (USD Million) by Applications (2018-2022)
7.2.1 Global Smart Cities Revenue (USD Million), Market Share (%) by Applications (2018-2022)
8 Global Smart Cities Development Regional Status and Outlook
8.1 Global Smart Cities Revenue (USD Million) By Regions (2018-2022)
8.2 North America Smart Cities Revenue (USD Million) by Type, and Application (2018-2022)
8.2.1 North America Smart Cities Revenue (USD Million) by Country (2018-2022)
8.2.2 North America Smart Cities Revenue (USD Million) by Type (2018-2022)
8.2.3 North America Smart Cities Revenue (USD Million) by Applications (2018-2022)
8.3 Europe Smart Cities Revenue (USD Million), by Type, and Applications (USD Million) (2018-2022)
8.3.1 Europe Smart Cities Revenue (USD Million), by Country (2018-2022)
8.3.2 Europe Smart Cities Revenue (USD Million) by Type (2018-2022)
8.3.3 Europe Smart Cities Revenue (USD Million) by Applications (2018-2022)
8.4 Asia Pacific Smart Cities Revenue (USD Million), and Revenue (USD Million) by Type, and Applications (2018-2022)
8.4.1 Asia Pacific Smart Cities Revenue (USD Million) by Country (2018-2022)
8.4.2 Asia Pacific Smart Cities Revenue (USD Million) by Type (2018-2022)
8.4.3 Asia Pacific Smart Cities Revenue (USD Million) by Applications (2018-2022)
8.5 South America Smart Cities Revenue (USD Million), by Type, and Applications (2018-2022)
8.5.1 South America Smart Cities Revenue (USD Million), by Country (2018-2022)
8.5.2 South America Smart Cities Revenue (USD Million) by Type (2018-2022)
8.5.3 South America Smart Cities Revenue (USD Million) by Applications (2018-2022)
8.6 Middle East and Africa Smart Cities Revenue (USD Million), by Type, Technology, Application, Thickness (2018-2022)
8.6.1 Middle East and Africa Smart Cities Revenue (USD Million) by Country (2018-2022)
8.6.2 Middle East and Africa Smart Cities Revenue (USD Million) by Type (2018-2022)
8.6.3 Middle East and Africa Smart Cities Revenue (USD Million) by Applications (2018-2022)
9 Company Profiles
10 Global Smart Cities Market Revenue (USD Million), by Type, and Applications (2023-2030)
10.1 Global Smart Cities Revenue (USD Million) and Market Share (%) by Type (2023-2030)
10.1.1 Global Smart Cities Revenue (USD Million), and Market Share (%) by Type (2023-2030)
10.2 Global Smart Cities Revenue (USD Million) and Market Share (%) by Applications (2023-2030)
10.2.1 Global Smart Cities Revenue (USD Million), and Market Share (%) by Applications (2023-2030)
11 Global Smart Cities Development Regional Status and Outlook Forecast
11.1 Global Smart Cities Revenue (USD Million) By Regions (2023-2030)
11.2 North America Smart Cities Revenue (USD Million) by Type, and Applications (2023-2030)
11.2.1 North America Smart Cities Revenue (USD) Million by Country (2023-2030)
11.2.2 North America Smart Cities Revenue (USD Million), by Type (2023-2030)
11.2.3 North America Smart Cities Revenue (USD Million), Market Share (%) by Applications (2023-2030)
11.3 Europe Smart Cities Revenue (USD Million), by Type, and Applications (2023-2030)
11.3.1 Europe Smart Cities Revenue (USD Million), by Country (2023-2030)
11.3.2 Europe Smart Cities Revenue (USD Million), by Type (2023-2030)
11.3.3 Europe Smart Cities Revenue (USD Million), by Applications (2023-2030)
11.4 Asia Pacific Smart Cities Revenue (USD Million) by Type, and Applications (2023-2030)
11.4.1 Asia Pacific Smart Cities Revenue (USD Million), by Country (2023-2030)
11.4.2 Asia Pacific Smart Cities Revenue (USD Million), by Type (2023-2030)
11.4.3 Asia Pacific Smart Cities Revenue (USD Million), by Applications (2023-2030)
11.5 South America Smart Cities Revenue (USD Million), by Type, and Applications (2023-2030)
11.5.1 South America Smart Cities Revenue (USD Million), by Country (2023-2030)
11.5.2 South America Smart Cities Revenue (USD Million), by Type (2023-2030)
11.5.3 South America Smart Cities Revenue (USD Million), by Applications (2023-2030)
11.6 Middle East and Africa Smart Cities Revenue (USD Million), by Type, and Applications (2023-2030)
11.6.1 Middle East and Africa Smart Cities Revenue (USD Million), by region (2023-2030)
11.6.2 Middle East and Africa Smart Cities Revenue (USD Million), by Type (2023-2030)
11.6.3 Middle East and Africa Smart Cities Revenue (USD Million), by Applications (2023-2030)
12 Methodology and Data Sources
12.1 Methodology/Research Approach
12.1.1 Research Programs/Design
12.1.2 Market Size Estimation
12.1.3 Market Breakdown and Data Triangulation
12.2 Data Sources
12.2.1 Secondary Sources
12.2.2 Primary Sources
12.3 Disclaimer
List of Tables
Table 1 Market Segmentation Analysis
Table 2 Global Smart Cities Market Companies with Areas Served
Table 3 Products Offerings Global Smart Cities Market
Table 4 Low Growth Scenario Forecasts
Table 5 Reference Case Growth Scenario
Table 6 High Growth Case Scenario
Table 7 Global Smart Cities Revenue (USD Million) And CAGR (%) By Type (2018-2030)
Table 8 Global Smart Cities Revenue (USD Million) And CAGR (%) By Applications (2018-2030)
Table 9 Global Smart Cities Revenue (USD Million) And CAGR (%) By Regions (2018-2030)
Table 10 Global Smart Cities Revenue (USD Million) By Type (2018-2022)
Table 11 Global Smart Cities Revenue Market Share (%) By Type (2018-2022)
Table 12 Global Smart Cities Revenue (USD Million) By Applications (2018-2022)
Table 13 Global Smart Cities Revenue Market Share (%) By Applications (2018-2022)
Table 14 Global Smart Cities Market Revenue (USD Million) By Regions (2018-2022)
Table 15 Global Smart Cities Market Share (%) By Regions (2018-2022)
Table 16 North America Smart Cities Revenue (USD Million) By Country (2018-2022)
Table 17 North America Smart Cities Revenue (USD Million) By Type (2018-2022)
Table 18 North America Smart Cities Revenue (USD Million) By Applications (2018-2022)
Table 19 Europe Smart Cities Revenue (USD Million) By Country (2018-2022)
Table 20 Europe Smart Cities Revenue (USD Million) By Type (2018-2022)
Table 21 Europe Smart Cities Revenue (USD Million) By Applications (2018-2022)
Table 22 Asia Pacific Smart Cities Revenue (USD Million) By Country (2018-2022)
Table 23 Asia Pacific Smart Cities Revenue (USD Million) By Type (2018-2022)
Table 24 Asia Pacific Smart Cities Revenue (USD Million) By Applications (2018-2022)
Table 25 South America Smart Cities Revenue (USD Million) By Country (2018-2022)
Table 26 South America Smart Cities Revenue (USD Million) By Type (2018-2022)
Table 27 South America Smart Cities Revenue (USD Million) By Applications (2018-2022)
Table 28 Middle East and Africa Smart Cities Revenue (USD Million) By Region (2018-2022)
Table 29 Middle East and Africa Smart Cities Revenue (USD Million) By Type (2018-2022)
Table 30 Middle East and Africa Smart Cities Revenue (USD Million) By Applications (2018-2022)
Table 31 Financial Analysis
Table 32 Global Smart Cities Revenue (USD Million) By Type (2023-2030)
Table 33 Global Smart Cities Revenue Market Share (%) By Type (2023-2030)
Table 34 Global Smart Cities Revenue (USD Million) By Applications (2023-2030)
Table 35 Global Smart Cities Revenue Market Share (%) By Applications (2023-2030)
Table 36 Global Smart Cities Market Revenue (USD Million), And Revenue (USD Million) By Regions (2023-2030)
Table 37 North America Smart Cities Revenue (USD)By Country (2023-2030)
Table 38 North America Smart Cities Revenue (USD Million) By Type (2023-2030)
Table 39 North America Smart Cities Revenue (USD Million) By Applications (2023-2030)
Table 40 Europe Smart Cities Revenue (USD Million) By Country (2023-2030)
Table 41 Europe Smart Cities Revenue (USD Million) By Type (2023-2030)
Table 42 Europe Smart Cities Revenue (USD Million) By Applications (2023-2030)
Table 43 Asia Pacific Smart Cities Revenue (USD Million) By Country (2023-2030)
Table 44 Asia Pacific Smart Cities Revenue (USD Million) By Type (2023-2030)
Table 45 Asia Pacific Smart Cities Revenue (USD Million) By Applications (2023-2030)
Table 46 South America Smart Cities Revenue (USD Million) By Country (2023-2030)
Table 47 South America Smart Cities Revenue (USD Million) By Type (2023-2030)
Table 48 South America Smart Cities Revenue (USD Million) By Applications (2023-2030)
Table 49 Middle East and Africa Smart Cities Revenue (USD Million) By Region (2023-2030)
Table 50 Middle East and Africa Smart Cities Revenue (USD Million) By Region (2023-2030)
Table 51 Middle East and Africa Smart Cities Revenue (USD Million) By Type (2023-2030)
Table 52 Middle East and Africa Smart Cities Revenue (USD Million) By Applications (2023-2030)
Table 53 Research Programs/Design for This Report
Table 54 Key Data Information from Secondary Sources
Table 55 Key Data Information from Primary Sources
List of Figures
Figure 1 Market Scope
Figure 2 Porter’s Five Forces
Figure 3 Global Smart Cities Revenue (USD Million) By Type (2018-2022)
Figure 4 Global Smart Cities Revenue Market Share (%) By Type (2022)
Figure 5 Global Smart Cities Revenue (USD Million) By Applications (2018-2022)
Figure 6 Global Smart Cities Revenue Market Share (%) By Applications (2022)
Figure 7 Global Smart Cities Market Revenue (USD Million) By Regions (2018-2022)
Figure 8 Global Smart Cities Market Share (%) By Regions (2022)
Figure 9 North America Smart Cities Revenue (USD Million) By Country (2018-2022)
Figure 10 North America Smart Cities Revenue (USD Million) By Type (2018-2022)
Figure 11 North America Smart Cities Revenue (USD Million) By Applications (2018-2022)
Figure 12 Europe Smart Cities Revenue (USD Million) By Country (2018-2022)
Figure 13 Europe Smart Cities Revenue (USD Million) By Type (2018-2022)
Figure 14 Europe Smart Cities Revenue (USD Million) By Applications (2018-2022)
Figure 15 Asia Pacific Smart Cities Revenue (USD Million) By Country (2018-2022)
Figure 16 Asia Pacific Smart Cities Revenue (USD Million) By Type (2018-2022)
Figure 17 Asia Pacific Smart Cities Revenue (USD Million) By Applications (2018-2022)
Figure 18 South America Smart Cities Revenue (USD Million) By Country (2018-2022)
Figure 19 South America Smart Cities Revenue (USD Million) By Type (2018-2022)
Figure 20 South America Smart Cities Revenue (USD Million) By Applications (2018-2022)
Figure 21 Middle East and Africa Smart Cities Revenue (USD Million) By Region (2018-2022)
Figure 22 Middle East and Africa Smart Cities Revenue (USD Million) By Type (2018-2022)
Figure 23 Middle East and Africa Smart Cities Revenue (USD Million) By Applications (2018-2022)
Figure 24 Global Smart Cities Revenue (USD Million) By Type (2023-2030)
Figure 25 Global Smart Cities Revenue Market Share (%) By Type (2030)
Figure 26 Global Smart Cities Revenue (USD Million) By Applications (2023-2030)
Figure 27 Global Smart Cities Revenue Market Share (%) By Applications (2030)
Figure 28 Global Smart Cities Market Revenue (USD Million) By Regions (2023-2030)
Figure 29 North America Smart Cities Revenue (USD Million) By Country (2023-2030)
Figure 30 North America Smart Cities Revenue (USD Million) By Type (2023-2030)
Figure 31 North America Smart Cities Revenue (USD Million) By Applications (2023-2030)
Figure 32 Europe Smart Cities Revenue (USD Million) By Country (2023-2030)
Figure 33 Europe Smart Cities Revenue (USD Million) By Type (2023-2030)
Figure 34 Europe Smart Cities Revenue (USD Million) By Applications (2023-2030)
Figure 35 Asia Pacific Smart Cities Revenue (USD Million) By Country (2023-2030)
Figure 36 Asia Pacific Smart Cities Revenue (USD Million) By Type (2023-2030)
Figure 37 Asia Pacific Smart Cities Revenue (USD Million) By Applications (2023-2030)
Figure 38 South America Smart Cities Revenue (USD Million) By Country (2023-2030)
Figure 39 South America Smart Cities Revenue (USD Million) By Type (2023-2030)
Figure 40 South America Smart Cities Revenue (USD Million) By Applications (2023-2030)
Figure 41 Middle East and Africa Smart Cities Revenue (USD Million) By Region (2023-2030)
Figure 42 Middle East and Africa Smart Cities Revenue (USD Million) By Region (2023-2030)
Figure 43 Middle East and Africa Smart Cities Revenue (USD Million) By Type (2023-2030)
Figure 44 Middle East and Africa Smart Cities Revenue (USD Million) By Applications (2023-2030)
Figure 45 Bottom-Up and Top-Down Approaches for This Report
Figure 46 Data Triangulation
