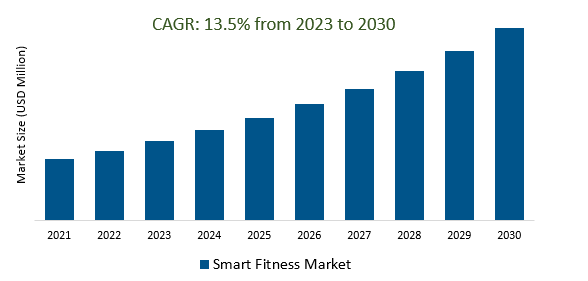
The Global Smart Fitness Market Size is estimated to register 13.5% growth over the forecast period from 2023 to 2030.
The market growth is driven by the increasing demand for remote fitness solutions, including virtual personal training, on-demand workout classes, and interactive fitness apps, has surged. This trend allows users to access fitness content and guidance from the comfort of their homes. Leading companies that are focused on Advanced Wearables, Artificial Intelligence (AI) and Machine Learning, Virtual Reality (VR) and Augmented Reality (AR), Healthcare Integration, Sustainable and Eco-Friendly Fitness, AI Coaches and Personal Trainers, and others to boost market shares in the industry.
Market Overview
The Smart Fitness Market encompasses technology-driven fitness solutions, including wearables, apps, virtual platforms, and connected equipment, aimed at helping individuals monitor and improve their physical health and wellness. Key trends include the dominance of wearables, the rise of virtual fitness, increased health consciousness, personalization, and the growth of subscription models. Drivers include rising health awareness, technological advancements, convenience, the impact of the pandemic, and an aging population. Challenges include privacy concerns, market saturation, healthcare integration hurdles, and user engagement issues.
Market Dynamics
Market Trends - Wearable fitness technology is the future of smart fitness.
Wearable fitness technology represents a pivotal aspect of smart fitness, offering convenience, personalized data tracking, and motivation for users to achieve their health and fitness goals. These devices continuously collect and analyze health metrics, provide real-time feedback during workouts, and integrate with various apps and devices. While there are concerns about data privacy and accuracy, wearables are expected to continue evolving and shaping the future of fitness tracking and monitoring.
Market Driver- Healthcare partnerships are driving the smart fitness market
Healthcare partnerships are a driving force behind the smart fitness market, as they merge healthcare expertise with technology to enable proactive health management, remote monitoring, and personalized wellness programs. These collaborations integrate wearable devices and telemedicine platforms, empowering individuals to take control of their health and enhance preventive care, bridging the gap between healthcare providers and consumers for a holistic approach to well-being.
Market Opportunity-Introduction of Innovation in Hardware
Innovations in hardware are driving the smart fitness market, with advances in wearable technology and sensors enhancing data accuracy, comfort, and durability of fitness devices. Integration of biometric technologies into fitness equipment and clothing enables comprehensive activity monitoring, improving workouts and health insights, and spurring market growth by providing users with better tools for optimizing fitness routines.
Market Share Analysis- Smartwatch Smart Fitness Market will register the fastest growth
The Global Smart Fitness Market is analyzed across Smartwatch, Wristband, Smart Clothing, Smart Shoes, Bike Computers, and others. Smartwatches are poised to register the fastest growth. Smartwatches are pivotal in the smart fitness market, combining fitness tracking with various functions. They provide real-time data on physical activity, heart rate, sleep, and more, sync with smartphones for notifications and apps, and offer features like GPS and water resistance. These devices are integral to holistic wellness and exercise with their comprehensive health monitoring and connectivity, shaping the future of smart fitness.
Market Share Analysis- Hand-wear Electric engines held a significant market share in 2023
The Global Smart Fitness Market is analyzed across various Types including Head-wear, Torso-wear, Hand-wear, Leg-wear, Bike mount, and others. Of these, Hand-wear held a significant market share in 2023. Hand-wear, including fitness gloves and sensors, is emerging as a valuable component of the smart fitness market. These devices offer enhanced grip, support, and real-time biometric data collection during workouts, particularly in strength training and hand-focused activities. They can improve exercise form, intensity, and safety, making them valuable tools for fitness enthusiasts and athletes, contributing to the evolving landscape of smart fitness technology.
Smart Fitness Market Segmentation
By Product
- Smartwatch
- Wristband
- Smart Clothing
- Smart Shoes
- Bike Computers
- Others
By Type
- Head-wear
- Torso-wear
- Hand-wear
- Leg-wear
- Bike mount
By Region
- North America (United States, Canada, Mexico)
- Europe (Germany, France, United Kingdom, Spain, Italy, Others)
- Asia Pacific (China, India, Japan, South Korea, Australia, Others)
- Latin America (Brazil, Argentina, Others)
- Middle East and Africa (Saudi Arabia, UAE, Kuwait, Other Middle East, South Africa, Nigeria, Other Africa)
Smart Fitness Market Companies
- MAD Apparel Inc (United States)
- Xiaomi Inc (China)
- Polar Electro Inc (Finland)
- Fitbit Inc. (United States)
- Samsung Electronics Co Ltd (South Korea)
- Garmin Ltd (Switzerland)
- Jawbone (United States)
- LG Electronics (Korea)
- OMsignal (Canada)
- Sony Mobile Communications Inc (Japan)
- Under Armour Inc (United States)
- Apple Inc. (United States)
*List not exhaustive
Smart Fitness Market Outlook 2023
1 Market Overview
1.1 Introduction to the Smart Fitness Market
1.2 Scope of the Study
1.3 Research Objective
1.3.1 Key Market Scope and Segments
1.3.2 Players Covered
1.3.3 Years Considered
2 Executive Summary
2.1 2023 Smart Fitness Industry- Market Statistics
3 Market Dynamics
3.1 Market Drivers
3.2 Market Challenges
3.3 Market Opportunities
3.4 Market Trends
4 Market Factor Analysis
4.1 Porter’s Five Forces
4.2 Market Entropy
4.2.1 Global Smart Fitness Market Companies with Area Served
4.2.2 Products Offerings Global Smart Fitness Market
5 COVID-19 Impact Analysis and Outlook Scenarios
5.1.1 Covid-19 Impact Analysis
5.1.2 post-COVID-19 Scenario- Low Growth Case
5.1.3 post-COVID-19 Scenario- Reference Growth Case
5.1.4 post-COVID-19 Scenario- Low Growth Case
6 Global Smart Fitness Market Trends
6.1 Global Smart Fitness Revenue (USD Million) and CAGR (%) by Type (2018-2030)
6.2 Global Smart Fitness Revenue (USD Million) and CAGR (%) by Applications (2018-2030)
6.3 Global Smart Fitness Revenue (USD Million) and CAGR (%) by regions (2018-2030)
7 Global Smart Fitness Market Revenue (USD Million) by Type, and Applications (2018-2022)
7.1 Global Smart Fitness Revenue (USD Million) by Type (2018-2022)
7.1.1 Global Smart Fitness Revenue (USD Million), Market Share (%) by Type (2018-2022)
7.2 Global Smart Fitness Revenue (USD Million) by Applications (2018-2022)
7.2.1 Global Smart Fitness Revenue (USD Million), Market Share (%) by Applications (2018-2022)
8 Global Smart Fitness Development Regional Status and Outlook
8.1 Global Smart Fitness Revenue (USD Million) By Regions (2018-2022)
8.2 North America Smart Fitness Revenue (USD Million) by Type, and Application (2018-2022)
8.2.1 North America Smart Fitness Revenue (USD Million) by Country (2018-2022)
8.2.2 North America Smart Fitness Revenue (USD Million) by Type (2018-2022)
8.2.3 North America Smart Fitness Revenue (USD Million) by Applications (2018-2022)
8.3 Europe Smart Fitness Revenue (USD Million), by Type, and Applications (USD Million) (2018-2022)
8.3.1 Europe Smart Fitness Revenue (USD Million), by Country (2018-2022)
8.3.2 Europe Smart Fitness Revenue (USD Million) by Type (2018-2022)
8.3.3 Europe Smart Fitness Revenue (USD Million) by Applications (2018-2022)
8.4 Asia Pacific Smart Fitness Revenue (USD Million), and Revenue (USD Million) by Type, and Applications (2018-2022)
8.4.1 Asia Pacific Smart Fitness Revenue (USD Million) by Country (2018-2022)
8.4.2 Asia Pacific Smart Fitness Revenue (USD Million) by Type (2018-2022)
8.4.3 Asia Pacific Smart Fitness Revenue (USD Million) by Applications (2018-2022)
8.5 South America Smart Fitness Revenue (USD Million), by Type, and Applications (2018-2022)
8.5.1 South America Smart Fitness Revenue (USD Million), by Country (2018-2022)
8.5.2 South America Smart Fitness Revenue (USD Million) by Type (2018-2022)
8.5.3 South America Smart Fitness Revenue (USD Million) by Applications (2018-2022)
8.6 Middle East and Africa Smart Fitness Revenue (USD Million), by Type, Technology, Application, Thickness (2018-2022)
8.6.1 Middle East and Africa Smart Fitness Revenue (USD Million) by Country (2018-2022)
8.6.2 Middle East and Africa Smart Fitness Revenue (USD Million) by Type (2018-2022)
8.6.3 Middle East and Africa Smart Fitness Revenue (USD Million) by Applications (2018-2022)
9 Company Profiles
10 Global Smart Fitness Market Revenue (USD Million), by Type, and Applications (2023-2030)
10.1 Global Smart Fitness Revenue (USD Million) and Market Share (%) by Type (2023-2030)
10.1.1 Global Smart Fitness Revenue (USD Million), and Market Share (%) by Type (2023-2030)
10.2 Global Smart Fitness Revenue (USD Million) and Market Share (%) by Applications (2023-2030)
10.2.1 Global Smart Fitness Revenue (USD Million), and Market Share (%) by Applications (2023-2030)
11 Global Smart Fitness Development Regional Status and Outlook Forecast
11.1 Global Smart Fitness Revenue (USD Million) By Regions (2023-2030)
11.2 North America Smart Fitness Revenue (USD Million) by Type, and Applications (2023-2030)
11.2.1 North America Smart Fitness Revenue (USD) Million by Country (2023-2030)
11.2.2 North America Smart Fitness Revenue (USD Million), by Type (2023-2030)
11.2.3 North America Smart Fitness Revenue (USD Million), Market Share (%) by Applications (2023-2030)
11.3 Europe Smart Fitness Revenue (USD Million), by Type, and Applications (2023-2030)
11.3.1 Europe Smart Fitness Revenue (USD Million), by Country (2023-2030)
11.3.2 Europe Smart Fitness Revenue (USD Million), by Type (2023-2030)
11.3.3 Europe Smart Fitness Revenue (USD Million), by Applications (2023-2030)
11.4 Asia Pacific Smart Fitness Revenue (USD Million) by Type, and Applications (2023-2030)
11.4.1 Asia Pacific Smart Fitness Revenue (USD Million), by Country (2023-2030)
11.4.2 Asia Pacific Smart Fitness Revenue (USD Million), by Type (2023-2030)
11.4.3 Asia Pacific Smart Fitness Revenue (USD Million), by Applications (2023-2030)
11.5 South America Smart Fitness Revenue (USD Million), by Type, and Applications (2023-2030)
11.5.1 South America Smart Fitness Revenue (USD Million), by Country (2023-2030)
11.5.2 South America Smart Fitness Revenue (USD Million), by Type (2023-2030)
11.5.3 South America Smart Fitness Revenue (USD Million), by Applications (2023-2030)
11.6 Middle East and Africa Smart Fitness Revenue (USD Million), by Type, and Applications (2023-2030)
11.6.1 Middle East and Africa Smart Fitness Revenue (USD Million), by region (2023-2030)
11.6.2 Middle East and Africa Smart Fitness Revenue (USD Million), by Type (2023-2030)
11.6.3 Middle East and Africa Smart Fitness Revenue (USD Million), by Applications (2023-2030)
12 Methodology and Data Sources
12.1 Methodology/Research Approach
12.1.1 Research Programs/Design
12.1.2 Market Size Estimation
12.1.3 Market Breakdown and Data Triangulation
12.2 Data Sources
12.2.1 Secondary Sources
12.2.2 Primary Sources
12.3 Disclaimer
List of Tables
Table 1 Market Segmentation Analysis
Table 2 Global Smart Fitness Market Companies with Areas Served
Table 3 Products Offerings Global Smart Fitness Market
Table 4 Low Growth Scenario Forecasts
Table 5 Reference Case Growth Scenario
Table 6 High Growth Case Scenario
Table 7 Global Smart Fitness Revenue (USD Million) And CAGR (%) By Type (2018-2030)
Table 8 Global Smart Fitness Revenue (USD Million) And CAGR (%) By Applications (2018-2030)
Table 9 Global Smart Fitness Revenue (USD Million) And CAGR (%) By Regions (2018-2030)
Table 10 Global Smart Fitness Revenue (USD Million) By Type (2018-2022)
Table 11 Global Smart Fitness Revenue Market Share (%) By Type (2018-2022)
Table 12 Global Smart Fitness Revenue (USD Million) By Applications (2018-2022)
Table 13 Global Smart Fitness Revenue Market Share (%) By Applications (2018-2022)
Table 14 Global Smart Fitness Market Revenue (USD Million) By Regions (2018-2022)
Table 15 Global Smart Fitness Market Share (%) By Regions (2018-2022)
Table 16 North America Smart Fitness Revenue (USD Million) By Country (2018-2022)
Table 17 North America Smart Fitness Revenue (USD Million) By Type (2018-2022)
Table 18 North America Smart Fitness Revenue (USD Million) By Applications (2018-2022)
Table 19 Europe Smart Fitness Revenue (USD Million) By Country (2018-2022)
Table 20 Europe Smart Fitness Revenue (USD Million) By Type (2018-2022)
Table 21 Europe Smart Fitness Revenue (USD Million) By Applications (2018-2022)
Table 22 Asia Pacific Smart Fitness Revenue (USD Million) By Country (2018-2022)
Table 23 Asia Pacific Smart Fitness Revenue (USD Million) By Type (2018-2022)
Table 24 Asia Pacific Smart Fitness Revenue (USD Million) By Applications (2018-2022)
Table 25 South America Smart Fitness Revenue (USD Million) By Country (2018-2022)
Table 26 South America Smart Fitness Revenue (USD Million) By Type (2018-2022)
Table 27 South America Smart Fitness Revenue (USD Million) By Applications (2018-2022)
Table 28 Middle East and Africa Smart Fitness Revenue (USD Million) By Region (2018-2022)
Table 29 Middle East and Africa Smart Fitness Revenue (USD Million) By Type (2018-2022)
Table 30 Middle East and Africa Smart Fitness Revenue (USD Million) By Applications (2018-2022)
Table 31 Financial Analysis
Table 32 Global Smart Fitness Revenue (USD Million) By Type (2023-2030)
Table 33 Global Smart Fitness Revenue Market Share (%) By Type (2023-2030)
Table 34 Global Smart Fitness Revenue (USD Million) By Applications (2023-2030)
Table 35 Global Smart Fitness Revenue Market Share (%) By Applications (2023-2030)
Table 36 Global Smart Fitness Market Revenue (USD Million), And Revenue (USD Million) By Regions (2023-2030)
Table 37 North America Smart Fitness Revenue (USD)By Country (2023-2030)
Table 38 North America Smart Fitness Revenue (USD Million) By Type (2023-2030)
Table 39 North America Smart Fitness Revenue (USD Million) By Applications (2023-2030)
Table 40 Europe Smart Fitness Revenue (USD Million) By Country (2023-2030)
Table 41 Europe Smart Fitness Revenue (USD Million) By Type (2023-2030)
Table 42 Europe Smart Fitness Revenue (USD Million) By Applications (2023-2030)
Table 43 Asia Pacific Smart Fitness Revenue (USD Million) By Country (2023-2030)
Table 44 Asia Pacific Smart Fitness Revenue (USD Million) By Type (2023-2030)
Table 45 Asia Pacific Smart Fitness Revenue (USD Million) By Applications (2023-2030)
Table 46 South America Smart Fitness Revenue (USD Million) By Country (2023-2030)
Table 47 South America Smart Fitness Revenue (USD Million) By Type (2023-2030)
Table 48 South America Smart Fitness Revenue (USD Million) By Applications (2023-2030)
Table 49 Middle East and Africa Smart Fitness Revenue (USD Million) By Region (2023-2030)
Table 50 Middle East and Africa Smart Fitness Revenue (USD Million) By Region (2023-2030)
Table 51 Middle East and Africa Smart Fitness Revenue (USD Million) By Type (2023-2030)
Table 52 Middle East and Africa Smart Fitness Revenue (USD Million) By Applications (2023-2030)
Table 53 Research Programs/Design for This Report
Table 54 Key Data Information from Secondary Sources
Table 55 Key Data Information from Primary Sources
List of Figures
Figure 1 Market Scope
Figure 2 Porter’s Five Forces
Figure 3 Global Smart Fitness Revenue (USD Million) By Type (2018-2022)
Figure 4 Global Smart Fitness Revenue Market Share (%) By Type (2022)
Figure 5 Global Smart Fitness Revenue (USD Million) By Applications (2018-2022)
Figure 6 Global Smart Fitness Revenue Market Share (%) By Applications (2022)
Figure 7 Global Smart Fitness Market Revenue (USD Million) By Regions (2018-2022)
Figure 8 Global Smart Fitness Market Share (%) By Regions (2022)
Figure 9 North America Smart Fitness Revenue (USD Million) By Country (2018-2022)
Figure 10 North America Smart Fitness Revenue (USD Million) By Type (2018-2022)
Figure 11 North America Smart Fitness Revenue (USD Million) By Applications (2018-2022)
Figure 12 Europe Smart Fitness Revenue (USD Million) By Country (2018-2022)
Figure 13 Europe Smart Fitness Revenue (USD Million) By Type (2018-2022)
Figure 14 Europe Smart Fitness Revenue (USD Million) By Applications (2018-2022)
Figure 15 Asia Pacific Smart Fitness Revenue (USD Million) By Country (2018-2022)
Figure 16 Asia Pacific Smart Fitness Revenue (USD Million) By Type (2018-2022)
Figure 17 Asia Pacific Smart Fitness Revenue (USD Million) By Applications (2018-2022)
Figure 18 South America Smart Fitness Revenue (USD Million) By Country (2018-2022)
Figure 19 South America Smart Fitness Revenue (USD Million) By Type (2018-2022)
Figure 20 South America Smart Fitness Revenue (USD Million) By Applications (2018-2022)
Figure 21 Middle East and Africa Smart Fitness Revenue (USD Million) By Region (2018-2022)
Figure 22 Middle East and Africa Smart Fitness Revenue (USD Million) By Type (2018-2022)
Figure 23 Middle East and Africa Smart Fitness Revenue (USD Million) By Applications (2018-2022)
Figure 24 Global Smart Fitness Revenue (USD Million) By Type (2023-2030)
Figure 25 Global Smart Fitness Revenue Market Share (%) By Type (2030)
Figure 26 Global Smart Fitness Revenue (USD Million) By Applications (2023-2030)
Figure 27 Global Smart Fitness Revenue Market Share (%) By Applications (2030)
Figure 28 Global Smart Fitness Market Revenue (USD Million) By Regions (2023-2030)
Figure 29 North America Smart Fitness Revenue (USD Million) By Country (2023-2030)
Figure 30 North America Smart Fitness Revenue (USD Million) By Type (2023-2030)
Figure 31 North America Smart Fitness Revenue (USD Million) By Applications (2023-2030)
Figure 32 Europe Smart Fitness Revenue (USD Million) By Country (2023-2030)
Figure 33 Europe Smart Fitness Revenue (USD Million) By Type (2023-2030)
Figure 34 Europe Smart Fitness Revenue (USD Million) By Applications (2023-2030)
Figure 35 Asia Pacific Smart Fitness Revenue (USD Million) By Country (2023-2030)
Figure 36 Asia Pacific Smart Fitness Revenue (USD Million) By Type (2023-2030)
Figure 37 Asia Pacific Smart Fitness Revenue (USD Million) By Applications (2023-2030)
Figure 38 South America Smart Fitness Revenue (USD Million) By Country (2023-2030)
Figure 39 South America Smart Fitness Revenue (USD Million) By Type (2023-2030)
Figure 40 South America Smart Fitness Revenue (USD Million) By Applications (2023-2030)
Figure 41 Middle East and Africa Smart Fitness Revenue (USD Million) By Region (2023-2030)
Figure 42 Middle East and Africa Smart Fitness Revenue (USD Million) By Region (2023-2030)
Figure 43 Middle East and Africa Smart Fitness Revenue (USD Million) By Type (2023-2030)
Figure 44 Middle East and Africa Smart Fitness Revenue (USD Million) By Applications (2023-2030)
Figure 45 Bottom-Up and Top-Down Approaches for This Report
Figure 46 Data Triangulation
