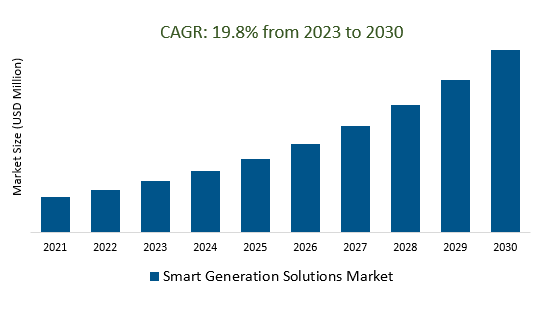
The global Smart Generation Solutions Market Size is estimated to register 19.8% growth over the forecast period from 2023 to 2030.
The market growth is driven predominantly by the Increasing adoption of renewable energy sources such as solar, wind, and hydroelectric power, driving the demand for smart generation solutions that manage and optimize these distributed energy resources. Leading companies are focusing on the Energy Storage Revolution, Decentralization of Microgrids IoT, Digitalization, Hybrid Solutions, energy-as-a-service Models, and others to boost market shares in the industry.
Market Overview
The Smart Generation Solutions Market involves advanced technologies transforming energy generation and management. It integrates renewable sources, energy storage, and IoT-driven digitalization for efficient, sustainable, and resilient energy systems across sectors. This market addresses urgent clean energy needs, advances in technology, government support, and environmental consciousness, reshaping global energy landscapes.
Market Dynamics
Microgrid development in the Smart Generation Solutions Market refers to the establishment of localized energy systems that combine various energy sources, storage solutions, and advanced controls to operate independently or in connection with the main power grid. These microgrids enhance energy resilience, optimize power distribution, and enable communities, campuses, or facilities to generate, store, and manage their energy. Microgrid development within the Smart Generation Solutions Market is driven by the need for decentralized energy sources, improved grid reliability, and the integration of renewable energy technologies.
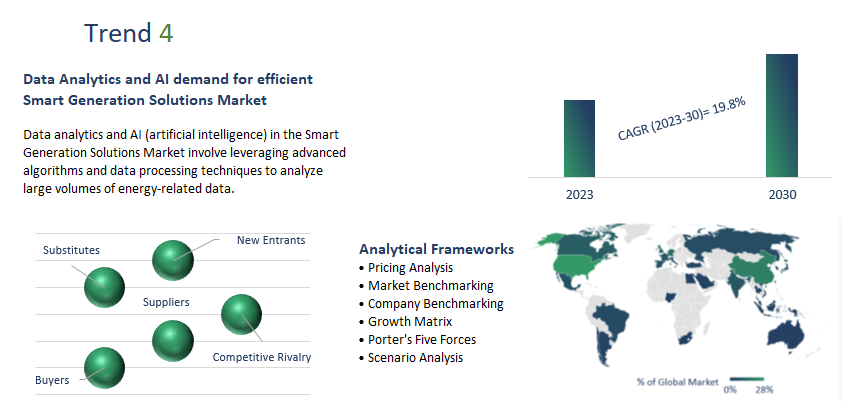
Market Drives- Data Analytics and AI demand for efficient Smart Generation Solutions Market
Data analytics and AI (artificial intelligence) in the Smart Generation Solutions Market involve leveraging advanced algorithms and data processing techniques to analyze large volumes of energy-related data. This enables the optimization of energy generation, consumption, and distribution by identifying patterns, making predictions, and providing actionable insights. Data analytics and AI play a role in improving energy efficiency, enhancing grid management, and supporting informed decision-making for sustainable and effective energy systems within the market.
Market Opportunity-Introduction of Energy Security
Energy security in the Smart Generation Solutions Market pertains to the assurance of a stable and reliable energy supply through the deployment of advanced technologies. This includes integrating renewable energy sources, energy storage solutions, and smart grid management to mitigate the risks of disruptions, ensure continuous power availability, and reduce dependence on traditional fossil fuel-based generation. Energy security is a key driver for adopting smart generation solutions, as they enhance resilience, reduce vulnerabilities, and contribute to a more stable and sustainable energy landscape
Market Share Analysis- Combined Heat & Power Smart Generation Solutions Market tools will register the significant growth
The global Smart Generation Solutions Market is analyzed across Combined Heat and power Smart, Solar, Wind, Hydro, and others. Of these, Combined Heat & Power Smart is poised to register the fastest growth. Combined Heat and Power (CHP) in the Smart Generation Solutions Market refers to the simultaneous generation of electricity and useful heat from a single energy source. This approach optimizes energy efficiency by capturing waste heat that would otherwise be lost in conventional power generation. In the context of smart generation solutions, CHP systems are integrated with advanced controls, data analytics, and monitoring technologies to ensure efficient energy production, distribution, and utilization. CHP smart solutions offer enhanced energy efficiency, reduced emissions, and cost savings by utilizing a single energy source for multiple purposes, making them a valuable component of the broader smart generation landscape.
Market Share Analysis- Industrial held a significant market share in 2023
The global Smart Generation Solutions Market is analyzed across a wide range of applications including Commercial, Industrial, and Residential. Of these, Industrial held a significant market share in 2023. The industrial sector refers to the integration of advanced technologies, such as renewable energy sources, energy storage, data analytics, and automation, to enhance energy efficiency and sustainability within industrial operations. Industrial smart generation solutions optimize energy consumption, reduce waste, and improve overall operational performance by incorporating renewable energy generation, energy management systems, and real-time monitoring. These solutions are tailored to industrial settings, aiming to lower energy costs, minimize environmental impact, and ensure a reliable energy supply for industrial processes.
Smart Generation Solutions Market Segmentation
By Type
By Application
- Commercial
- Industrial
- Residential
By Technology
- Solar
- Wind
- Hydro
- Combined Heat & Power
- Energy Storage
By Capacity
- Small Scale
- Medium Scale
- Large Scale
By Component
- Hardware
- Software
- Services
By Region
- North America (United States, Canada, Mexico)
- Europe (Germany, France, United Kingdom, Spain, Italy, Others)
- Asia Pacific (China, India, Japan, South Korea, Australia, Others)
- Latin America (Brazil, Argentina, Others)
- Middle East and Africa (Saudi Arabia, UAE, Kuwait, Other Middle East, South Africa, Nigeria, Other Africa)
Smart Generation Solutions Market Companies
- Siemens
- GE
- Wärtsilä Energy Solutions
- Ethicon
- HDT Global
- Smart Hydro Power
- Lex Products Corp
- Exro Technologies
- Kinetron
Smart Generation Solutions Market Outlook 2023
1 Market Overview
1.1 Introduction to the Smart Generation Solutions Market
1.2 Scope of the Study
1.3 Research Objective
1.3.1 Key Market Scope and Segments
1.3.2 Players Covered
1.3.3 Years Considered
2 Executive Summary
2.1 2023 Smart Generation Solutions Industry- Market Statistics
3 Market Dynamics
3.1 Market Drivers
3.2 Market Challenges
3.3 Market Opportunities
3.4 Market Trends
4 Market Factor Analysis
4.1 Porter’s Five Forces
4.2 Market Entropy
4.2.1 Global Smart Generation Solutions Market Companies with Area Served
4.2.2 Products Offerings Global Smart Generation Solutions Market
5 COVID-19 Impact Analysis and Outlook Scenarios
5.1.1 Covid-19 Impact Analysis
5.1.2 Post-COVID-19 Scenario- Low Growth Case
5.1.3 Post-COVID-19 Scenario- Reference Growth Case
5.1.4 Post-COVID-19 Scenario- Low Growth Case
6 Global Smart Generation Solutions Market Trends
6.1 Global Smart Generation Solutions Revenue (USD Million) and CAGR (%) by Type (2018-2030)
6.2 Global Smart Generation Solutions Revenue (USD Million) and CAGR (%) by Applications (2018-2030)
6.3 Global Smart Generation Solutions Revenue (USD Million) and CAGR (%) by Regions (2018-2030)
7 Global Smart Generation Solutions Market Revenue (USD Million) by Type, and Applications (2018-2022)
7.1 Global Smart Generation Solutions Revenue (USD Million) by Type (2018-2022)
7.1.1 Global Smart Generation Solutions Revenue (USD Million), Market Share (%) by Type (2018-2022)
7.2 Global Smart Generation Solutions Revenue (USD Million) by Applications (2018-2022)
7.2.1 Global Smart Generation Solutions Revenue (USD Million), Market Share (%) by Applications (2018-2022)
8 Global Smart Generation Solutions Development Regional Status and Outlook
8.1 Global Smart Generation Solutions Revenue (USD Million) By Regions (2018-2022)
8.2 North America Smart Generation Solutions Revenue (USD Million) by Type, and Application (2018-2022)
8.2.1 North America Smart Generation Solutions Revenue (USD Million) by Country (2018-2022)
8.2.2 North America Smart Generation Solutions Revenue (USD Million) by Type (2018-2022)
8.2.3 North America Smart Generation Solutions Revenue (USD Million) by Applications (2018-2022)
8.3 Europe Smart Generation Solutions Revenue (USD Million), by Type, and Applications (USD Million) (2018-2022)
8.3.1 Europe Smart Generation Solutions Revenue (USD Million), by Country (2018-2022)
8.3.2 Europe Smart Generation Solutions Revenue (USD Million) by Type (2018-2022)
8.3.3 Europe Smart Generation Solutions Revenue (USD Million) by Applications (2018-2022)
8.4 Asia Pacific Smart Generation Solutions Revenue (USD Million), and Revenue (USD Million) by Type, and Applications (2018-2022)
8.4.1 Asia Pacific Smart Generation Solutions Revenue (USD Million) by Country (2018-2022)
8.4.2 Asia Pacific Smart Generation Solutions Revenue (USD Million) by Type (2018-2022)
8.4.3 Asia Pacific Smart Generation Solutions Revenue (USD Million) by Applications (2018-2022)
8.5 South America Smart Generation Solutions Revenue (USD Million), by Type, and Applications (2018-2022)
8.5.1 South America Smart Generation Solutions Revenue (USD Million), by Country (2018-2022)
8.5.2 South America Smart Generation Solutions Revenue (USD Million) by Type (2018-2022)
8.5.3 South America Smart Generation Solutions Revenue (USD Million) by Applications (2018-2022)
8.6 Middle East and Africa Smart Generation Solutions Revenue (USD Million), by Type, Technology, Application, Thickness (2018-2022)
8.6.1 Middle East and Africa Smart Generation Solutions Revenue (USD Million) by Country (2018-2022)
8.6.2 Middle East and Africa Smart Generation Solutions Revenue (USD Million) by Type (2018-2022)
8.6.3 Middle East and Africa Smart Generation Solutions Revenue (USD Million) by Applications (2018-2022)
9 Company Profiles
10 Global Smart Generation Solutions Market Revenue (USD Million), by Type, and Applications (2023-2030)
10.1 Global Smart Generation Solutions Revenue (USD Million) and Market Share (%) by Type (2023-2030)
10.1.1 Global Smart Generation Solutions Revenue (USD Million), and Market Share (%) by Type (2023-2030)
10.2 Global Smart Generation Solutions Revenue (USD Million) and Market Share (%) by Applications (2023-2030)
10.2.1 Global Smart Generation Solutions Revenue (USD Million), and Market Share (%) by Applications (2023-2030)
11 Global Smart Generation Solutions Development Regional Status and Outlook Forecast
11.1 Global Smart Generation Solutions Revenue (USD Million) By Regions (2023-2030)
11.2 North America Smart Generation Solutions Revenue (USD Million) by Type, and Applications (2023-2030)
11.2.1 North America Smart Generation Solutions Revenue (USD) Million by Country (2023-2030)
11.2.2 North America Smart Generation Solutions Revenue (USD Million), by Type (2023-2030)
11.2.3 North America Smart Generation Solutions Revenue (USD Million), Market Share (%) by Applications (2023-2030)
11.3 Europe Smart Generation Solutions Revenue (USD Million), by Type, and Applications (2023-2030)
11.3.1 Europe Smart Generation Solutions Revenue (USD Million), by Country (2023-2030)
11.3.2 Europe Smart Generation Solutions Revenue (USD Million), by Type (2023-2030)
11.3.3 Europe Smart Generation Solutions Revenue (USD Million), by Applications (2023-2030)
11.4 Asia Pacific Smart Generation Solutions Revenue (USD Million) by Type, and Applications (2023-2030)
11.4.1 Asia Pacific Smart Generation Solutions Revenue (USD Million), by Country (2023-2030)
11.4.2 Asia Pacific Smart Generation Solutions Revenue (USD Million), by Type (2023-2030)
11.4.3 Asia Pacific Smart Generation Solutions Revenue (USD Million), by Applications (2023-2030)
11.5 South America Smart Generation Solutions Revenue (USD Million), by Type, and Applications (2023-2030)
11.5.1 South America Smart Generation Solutions Revenue (USD Million), by Country (2023-2030)
11.5.2 South America Smart Generation Solutions Revenue (USD Million), by Type (2023-2030)
11.5.3 South America Smart Generation Solutions Revenue (USD Million), by Applications (2023-2030)
11.6 Middle East and Africa Smart Generation Solutions Revenue (USD Million), by Type, and Applications (2023-2030)
11.6.1 Middle East and Africa Smart Generation Solutions Revenue (USD Million), by Region (2023-2030)
11.6.2 Middle East and Africa Smart Generation Solutions Revenue (USD Million), by Type (2023-2030)
11.6.3 Middle East and Africa Smart Generation Solutions Revenue (USD Million), by Applications (2023-2030)
12 Methodology and Data Sources
12.1 Methodology/Research Approach
12.1.1 Research Programs/Design
12.1.2 Market Size Estimation
12.1.3 Market Breakdown and Data Triangulation
12.2 Data Sources
12.2.1 Secondary Sources
12.2.2 Primary Sources
12.3 Disclaimer
List of Tables
Table 1 Market Segmentation Analysis
Table 2 Global Smart Generation Solutions Market Companies with Areas Served
Table 3 Products Offerings Global Smart Generation Solutions Market
Table 4 Low Growth Scenario Forecasts
Table 5 Reference Case Growth Scenario
Table 6 High Growth Case Scenario
Table 7 Global Smart Generation Solutions Revenue (USD Million) And CAGR (%) By Type (2018-2030)
Table 8 Global Smart Generation Solutions Revenue (USD Million) And CAGR (%) By Applications (2018-2030)
Table 9 Global Smart Generation Solutions Revenue (USD Million) And CAGR (%) By Regions (2018-2030)
Table 10 Global Smart Generation Solutions Revenue (USD Million) By Type (2018-2022)
Table 11 Global Smart Generation Solutions Revenue Market Share (%) By Type (2018-2022)
Table 12 Global Smart Generation Solutions Revenue (USD Million) By Applications (2018-2022)
Table 13 Global Smart Generation Solutions Revenue Market Share (%) By Applications (2018-2022)
Table 14 Global Smart Generation Solutions Market Revenue (USD Million) By Regions (2018-2022)
Table 15 Global Smart Generation Solutions Market Share (%) By Regions (2018-2022)
Table 16 North America Smart Generation Solutions Revenue (USD Million) By Country (2018-2022)
Table 17 North America Smart Generation Solutions Revenue (USD Million) By Type (2018-2022)
Table 18 North America Smart Generation Solutions Revenue (USD Million) By Applications (2018-2022)
Table 19 Europe Smart Generation Solutions Revenue (USD Million) By Country (2018-2022)
Table 20 Europe Smart Generation Solutions Revenue (USD Million) By Type (2018-2022)
Table 21 Europe Smart Generation Solutions Revenue (USD Million) By Applications (2018-2022)
Table 22 Asia Pacific Smart Generation Solutions Revenue (USD Million) By Country (2018-2022)
Table 23 Asia Pacific Smart Generation Solutions Revenue (USD Million) By Type (2018-2022)
Table 24 Asia Pacific Smart Generation Solutions Revenue (USD Million) By Applications (2018-2022)
Table 25 South America Smart Generation Solutions Revenue (USD Million) By Country (2018-2022)
Table 26 South America Smart Generation Solutions Revenue (USD Million) By Type (2018-2022)
Table 27 South America Smart Generation Solutions Revenue (USD Million) By Applications (2018-2022)
Table 28 Middle East and Africa Smart Generation Solutions Revenue (USD Million) By Region (2018-2022)
Table 29 Middle East and Africa Smart Generation Solutions Revenue (USD Million) By Type (2018-2022)
Table 30 Middle East and Africa Smart Generation Solutions Revenue (USD Million) By Applications (2018-2022)
Table 31 Financial Analysis
Table 32 Global Smart Generation Solutions Revenue (USD Million) By Type (2023-2030)
Table 33 Global Smart Generation Solutions Revenue Market Share (%) By Type (2023-2030)
Table 34 Global Smart Generation Solutions Revenue (USD Million) By Applications (2023-2030)
Table 35 Global Smart Generation Solutions Revenue Market Share (%) By Applications (2023-2030)
Table 36 Global Smart Generation Solutions Market Revenue (USD Million), And Revenue (USD Million) By Regions (2023-2030)
Table 37 North America Smart Generation Solutions Revenue (USD)By Country (2023-2030)
Table 38 North America Smart Generation Solutions Revenue (USD Million) By Type (2023-2030)
Table 39 North America Smart Generation Solutions Revenue (USD Million) By Applications (2023-2030)
Table 40 Europe Smart Generation Solutions Revenue (USD Million) By Country (2023-2030)
Table 41 Europe Smart Generation Solutions Revenue (USD Million) By Type (2023-2030)
Table 42 Europe Smart Generation Solutions Revenue (USD Million) By Applications (2023-2030)
Table 43 Asia Pacific Smart Generation Solutions Revenue (USD Million) By Country (2023-2030)
Table 44 Asia Pacific Smart Generation Solutions Revenue (USD Million) By Type (2023-2030)
Table 45 Asia Pacific Smart Generation Solutions Revenue (USD Million) By Applications (2023-2030)
Table 46 South America Smart Generation Solutions Revenue (USD Million) By Country (2023-2030)
Table 47 South America Smart Generation Solutions Revenue (USD Million) By Type (2023-2030)
Table 48 South America Smart Generation Solutions Revenue (USD Million) By Applications (2023-2030)
Table 49 Middle East and Africa Smart Generation Solutions Revenue (USD Million) By Region (2023-2030)
Table 50 Middle East and Africa Smart Generation Solutions Revenue (USD Million) By Region (2023-2030)
Table 51 Middle East and Africa Smart Generation Solutions Revenue (USD Million) By Type (2023-2030)
Table 52 Middle East and Africa Smart Generation Solutions Revenue (USD Million) By Applications (2023-2030)
Table 53 Research Programs/Design for This Report
Table 54 Key Data Information from Secondary Sources
Table 55 Key Data Information from Primary Sources
List of Figures
Figure 1 Market Scope
Figure 2 Porter’s Five Forces
Figure 3 Global Smart Generation Solutions Revenue (USD Million) By Type (2018-2022)
Figure 4 Global Smart Generation Solutions Revenue Market Share (%) By Type (2022)
Figure 5 Global Smart Generation Solutions Revenue (USD Million) By Applications (2018-2022)
Figure 6 Global Smart Generation Solutions Revenue Market Share (%) By Applications (2022)
Figure 7 Global Smart Generation Solutions Market Revenue (USD Million) By Regions (2018-2022)
Figure 8 Global Smart Generation Solutions Market Share (%) By Regions (2022)
Figure 9 North America Smart Generation Solutions Revenue (USD Million) By Country (2018-2022)
Figure 10 North America Smart Generation Solutions Revenue (USD Million) By Type (2018-2022)
Figure 11 North America Smart Generation Solutions Revenue (USD Million) By Applications (2018-2022)
Figure 12 Europe Smart Generation Solutions Revenue (USD Million) By Country (2018-2022)
Figure 13 Europe Smart Generation Solutions Revenue (USD Million) By Type (2018-2022)
Figure 14 Europe Smart Generation Solutions Revenue (USD Million) By Applications (2018-2022)
Figure 15 Asia Pacific Smart Generation Solutions Revenue (USD Million) By Country (2018-2022)
Figure 16 Asia Pacific Smart Generation Solutions Revenue (USD Million) By Type (2018-2022)
Figure 17 Asia Pacific Smart Generation Solutions Revenue (USD Million) By Applications (2018-2022)
Figure 18 South America Smart Generation Solutions Revenue (USD Million) By Country (2018-2022)
Figure 19 South America Smart Generation Solutions Revenue (USD Million) By Type (2018-2022)
Figure 20 South America Smart Generation Solutions Revenue (USD Million) By Applications (2018-2022)
Figure 21 Middle East and Africa Smart Generation Solutions Revenue (USD Million) By Region (2018-2022)
Figure 22 Middle East and Africa Smart Generation Solutions Revenue (USD Million) By Type (2018-2022)
Figure 23 Middle East and Africa Smart Generation Solutions Revenue (USD Million) By Applications (2018-2022)
Figure 24 Global Smart Generation Solutions Revenue (USD Million) By Type (2023-2030)
Figure 25 Global Smart Generation Solutions Revenue Market Share (%) By Type (2030)
Figure 26 Global Smart Generation Solutions Revenue (USD Million) By Applications (2023-2030)
Figure 27 Global Smart Generation Solutions Revenue Market Share (%) By Applications (2030)
Figure 28 Global Smart Generation Solutions Market Revenue (USD Million) By Regions (2023-2030)
Figure 29 North America Smart Generation Solutions Revenue (USD Million) By Country (2023-2030)
Figure 30 North America Smart Generation Solutions Revenue (USD Million) By Type (2023-2030)
Figure 31 North America Smart Generation Solutions Revenue (USD Million) By Applications (2023-2030)
Figure 32 Europe Smart Generation Solutions Revenue (USD Million) By Country (2023-2030)
Figure 33 Europe Smart Generation Solutions Revenue (USD Million) By Type (2023-2030)
Figure 34 Europe Smart Generation Solutions Revenue (USD Million) By Applications (2023-2030)
Figure 35 Asia Pacific Smart Generation Solutions Revenue (USD Million) By Country (2023-2030)
Figure 36 Asia Pacific Smart Generation Solutions Revenue (USD Million) By Type (2023-2030)
Figure 37 Asia Pacific Smart Generation Solutions Revenue (USD Million) By Applications (2023-2030)
Figure 38 South America Smart Generation Solutions Revenue (USD Million) By Country (2023-2030)
Figure 39 South America Smart Generation Solutions Revenue (USD Million) By Type (2023-2030)
Figure 40 South America Smart Generation Solutions Revenue (USD Million) By Applications (2023-2030)
Figure 41 Middle East and Africa Smart Generation Solutions Revenue (USD Million) By Region (2023-2030)
Figure 42 Middle East and Africa Smart Generation Solutions Revenue (USD Million) By Region (2023-2030)
Figure 43 Middle East and Africa Smart Generation Solutions Revenue (USD Million) By Type (2023-2030)
Figure 44 Middle East and Africa Smart Generation Solutions Revenue (USD Million) By Applications (2023-2030)
Figure 45 Bottom-Up and Top-Down Approaches For This Report
Figure 46 Data Triangulation
