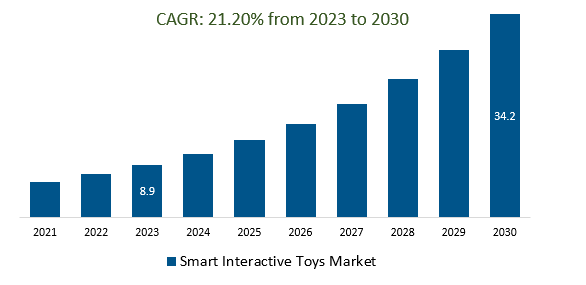
The global Smart Interactive Toys Systems Market Size is estimated to be US$ 8.9 billion in 2023 and is poised to register 21.20% growth over the forecast period from 2023 to 2030.
The market growth is driven by an increasing number of Smart interactive toys that are increasingly being designed to combine entertainment with education. These toys offer interactive learning experiences, helping children develop various skills while they play. Social Interaction Enhancement Smart toys are designed to facilitate social interactions among children, whether they are physically present together or connected virtually, and help in improving communication and collaboration skills.
Further, the market growth and economic impact interactive with the toys industry generate economic activity through manufacturing, distribution, retail, and related services. It provides job opportunities and contributes to local and global economies.
Market Overview
The Smart Interactive Toys market has experienced growth and impact due to its convergence of technology, education, and entertainment into the various aspects of its impact on consumers, the economy, technology, and society are Consumer Engagement and Education, Economic Growth, and Industry Innovation, Technological Advancement, Entertainment Industry Synergy, Environmental, and Ethical Considerations, and other.
Market Dynamics
Market Trends: Companies are launching Health and Fitness Incorporation to attract a consumer base
The health and fitness features within the Smart Interactive Toys market have introduced a range of positive impacts on children's physical activity levels, overall health, and well-being. Smart interactive toys encourage children to engage in more active play. These toys incorporate movement-based activities that prompt children to get up, move around, and expend energy while having fun in physical activities incorporated into these toys, children develop healthy habits from a young age. They learn that play and movement can be enjoyable, contributing to a foundation of an active lifestyle.
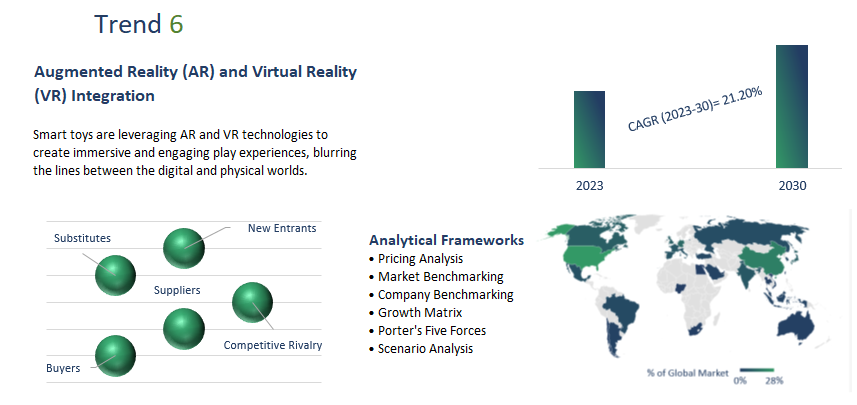
Market drives: Augmented Reality (AR) and Virtual Reality (VR) Integration
Smart toys are leveraging AR and VR technologies to create immersive and engaging play experiences, blurring the lines between the digital and physical worlds. AR and VR technologies create highly immersive environments that blur the boundaries between the physical and digital worlds. Smart interactive toys that utilize AR and VR provide children with experiences that stimulate their senses and imagination.
AR and VR integration in smart toys drive advancements in these technologies. Toy manufacturers contribute AR and VR applications, potentially influencing the development of these technologies in other industries.
Market Opportunity: Introduction of Social Interaction Enhancement
Smart toys are designed for social interactions among children, whether they are physically present together or connected virtually, and help in improving communication and collaboration skills. The interactive toys encourage social play collaborative tasks and challenges. Children learn how to work together, share ideas, and accomplish goals as a team. Further, by sharing experiences and collaborating, children can form bonds with their peers. Smart toys that promote social interaction contribute to the formation of friendships and the development of social networks.
Market Segmentation
Interactive Games: The Smart Interactive Toys market has led to a significant transformation in play experiences for children’s interactive games in this market are Learning Through Play, Social Interaction, Emotional Expression, Learning from Mistakes, Skill Enhancement, Cognitive Development, and Smart toys offer high levels of engagement and entertainment. These games captivate children's attention, keeping them immersed and entertained for extended periods.
Smartphone Connected: Smart Interactive Toys has brought about a transformative impact on children's play experiences, and learning opportunities, and technological integration of smartphone connectivity drives innovation within the toy industry. Manufacturers continually develop new apps, features, and interactions to keep up with technological advancements.
Tablet-Connected: Tablet-connected smart toys integrate digital technology into playtime. They leverage the familiarity and capabilities of tablets to interactive and educational aspects of the toys and offer educational apps, games, and toys that can be part of a larger ecosystem that includes educational content, games, and entertainment, creating a cohesive experience that aligns with other media and platforms.
Market Segmentation
By Type
- Intelligent Robot
- Smart Little Train
- Smart Point Reader
By Application
- Home Schooling
- Consumer Electronics
By Region
- North America (United States, Canada, Mexico)
- Europe (Germany, France, United Kingdom, Spain, Italy, Others)
- Asia Pacific (China, India, Japan, South Korea, Australia, Others)
- Latin America (Brazil, Argentina, Others)
- Middle East and Africa (Saudi Arabia, UAE, Kuwait, Other Middle East, South Africa, Nigeria, Other Africa)
Key Players
Leading companies profiled in the study include-
- iRobot Corporation
- Digital Dream Labs LLC
- Sphero Inc
- Pillar Learning
- Wonder Workshop Inc
- TOSY Robotics JSC
- Workinman Interactive LLC
- Miko
- Smart Teddy
- Intelino
- Potensic
- Mainbot
- UBTECH Robotics Corp Ltd
- SZ DJI Technology Co., Ltd
- KEYi Technology
- Shenzhen Maker Factory Technology Co., Ltd
- iFlytek Co Ltd
- Shenzhen Play Pupil Technology Co., Ltd
- Xiaoyezi (Beijing) Technology Co., Ltd
- Benewtech
Smart Interactive Toys Systems Market Outlook 2023
1 Market Overview
1.1 Introduction to Smart Interactive Toys Systems Market
1.2 Scope of the Study
1.3 Research Objective
1.3.1 Key Market Scope and Segments
1.3.2 Players Covered
1.3.3 Years Considered
2 Executive Summary
2.1 2023 Smart Interactive Toys Systems Industry- Market Statistics
3 Market Dynamics
3.1 Market Drivers
3.2 Market Challenges
3.3 Market Opportunities
3.4 Market Trends
4 Market Factor Analysis
4.1 Porter’s Five Forces
4.2 Market Entropy
4.2.1 Global Smart Interactive Toys Systems Market Companies with Area Served
4.2.2 Products Offerings Global Smart Interactive Toys Systems Market
5 COVID-19 Impact Analysis and Outlook Scenarios
5.1.1 Covid-19 Impact Analysis
5.1.2 Post-COVID-19 Scenario- Low Growth Case
5.1.3 Post-COVID-19 Scenario- Reference Growth Case
5.1.4 Post-COVID-19 Scenario- Low Growth Case
6 Global Smart Interactive Toys Systems Market Trends
6.1 Global Smart Interactive Toys Systems Revenue (USD Million) and CAGR (%) by Type (2018-2030)
6.2 Global Smart Interactive Toys Systems Revenue (USD Million) and CAGR (%) by Applications (2018-2030)
6.3 Global Smart Interactive Toys Systems Revenue (USD Million) and CAGR (%) by Regions (2018-2030)
7 Global Smart Interactive Toys Systems Market Revenue (USD Million) by Type, and Applications (2018-2022)
7.1 Global Smart Interactive Toys Systems Revenue (USD Million) by Type (2018-2022)
7.1.1 Global Smart Interactive Toys Systems Revenue (USD Million), Market Share (%) by Type (2018-2022)
7.2 Global Smart Interactive Toys Systems Revenue (USD Million) by Applications (2018-2022)
7.2.1 Global Smart Interactive Toys Systems Revenue (USD Million), Market Share (%) by Applications (2018-2022)
8 Global Smart Interactive Toys Systems Development Regional Status and Outlook
8.1 Global Smart Interactive Toys Systems Revenue (USD Million) By Regions (2018-2022)
8.2 North America Smart Interactive Toys Systems Revenue (USD Million) by Type, and Application (2018-2022)
8.2.1 North America Smart Interactive Toys Systems Revenue (USD Million) by Country (2018-2022)
8.2.2 North America Smart Interactive Toys Systems Revenue (USD Million) by Type (2018-2022)
8.2.3 North America Smart Interactive Toys Systems Revenue (USD Million) by Applications (2018-2022)
8.3 Europe Smart Interactive Toys Systems Revenue (USD Million), by Type, and Applications (USD Million) (2018-2022)
8.3.1 Europe Smart Interactive Toys Systems Revenue (USD Million), by Country (2018-2022)
8.3.2 Europe Smart Interactive Toys Systems Revenue (USD Million) by Type (2018-2022)
8.3.3 Europe Smart Interactive Toys Systems Revenue (USD Million) by Applications (2018-2022)
8.4 Asia Pacific Smart Interactive Toys Systems Revenue (USD Million), and Revenue (USD Million) by Type, and Applications (2018-2022)
8.4.1 Asia Pacific Smart Interactive Toys Systems Revenue (USD Million) by Country (2018-2022)
8.4.2 Asia Pacific Smart Interactive Toys Systems Revenue (USD Million) by Type (2018-2022)
8.4.3 Asia Pacific Smart Interactive Toys Systems Revenue (USD Million) by Applications (2018-2022)
8.5 South America Smart Interactive Toys Systems Revenue (USD Million), by Type, and Applications (2018-2022)
8.5.1 South America Smart Interactive Toys Systems Revenue (USD Million), by Country (2018-2022)
8.5.2 South America Smart Interactive Toys Systems Revenue (USD Million) by Type (2018-2022)
8.5.3 South America Smart Interactive Toys Systems Revenue (USD Million) by Applications (2018-2022)
8.6 Middle East and Africa Smart Interactive Toys Systems Revenue (USD Million), by Type, Technology, Application, Thickness (2018-2022)
8.6.1 Middle East and Africa Smart Interactive Toys Systems Revenue (USD Million) by Country (2018-2022)
8.6.2 Middle East and Africa Smart Interactive Toys Systems Revenue (USD Million) by Type (2018-2022)
8.6.3 Middle East and Africa Smart Interactive Toys Systems Revenue (USD Million) by Applications (2018-2022)
9 Company Profiles
10 Global Smart Interactive Toys Systems Market Revenue (USD Million), by Type, and Applications (2023-2030)
10.1 Global Smart Interactive Toys Systems Revenue (USD Million) and Market Share (%) by Type (2023-2030)
10.1.1 Global Smart Interactive Toys Systems Revenue (USD Million), and Market Share (%) by Type (2023-2030)
10.2 Global Smart Interactive Toys Systems Revenue (USD Million) and Market Share (%) by Applications (2023-2030)
10.2.1 Global Smart Interactive Toys Systems Revenue (USD Million), and Market Share (%) by Applications (2023-2030)
11 Global Smart Interactive Toys Systems Development Regional Status and Outlook Forecast
11.1 Global Smart Interactive Toys Systems Revenue (USD Million) By Regions (2023-2030)
11.2 North America Smart Interactive Toys Systems Revenue (USD Million) by Type, and Applications (2023-2030)
11.2.1 North America Smart Interactive Toys Systems Revenue (USD) Million by Country (2023-2030)
11.2.2 North America Smart Interactive Toys Systems Revenue (USD Million), by Type (2023-2030)
11.2.3 North America Smart Interactive Toys Systems Revenue (USD Million), Market Share (%) by Applications (2023-2030)
11.3 Europe Smart Interactive Toys Systems Revenue (USD Million), by Type, and Applications (2023-2030)
11.3.1 Europe Smart Interactive Toys Systems Revenue (USD Million), by Country (2023-2030)
11.3.2 Europe Smart Interactive Toys Systems Revenue (USD Million), by Type (2023-2030)
11.3.3 Europe Smart Interactive Toys Systems Revenue (USD Million), by Applications (2023-2030)
11.4 Asia Pacific Smart Interactive Toys Systems Revenue (USD Million) by Type, and Applications (2023-2030)
11.4.1 Asia Pacific Smart Interactive Toys Systems Revenue (USD Million), by Country (2023-2030)
11.4.2 Asia Pacific Smart Interactive Toys Systems Revenue (USD Million), by Type (2023-2030)
11.4.3 Asia Pacific Smart Interactive Toys Systems Revenue (USD Million), by Applications (2023-2030)
11.5 South America Smart Interactive Toys Systems Revenue (USD Million), by Type, and Applications (2023-2030)
11.5.1 South America Smart Interactive Toys Systems Revenue (USD Million), by Country (2023-2030)
11.5.2 South America Smart Interactive Toys Systems Revenue (USD Million), by Type (2023-2030)
11.5.3 South America Smart Interactive Toys Systems Revenue (USD Million), by Applications (2023-2030)
11.6 Middle East and Africa Smart Interactive Toys Systems Revenue (USD Million), by Type, and Applications (2023-2030)
11.6.1 Middle East and Africa Smart Interactive Toys Systems Revenue (USD Million), by Region (2023-2030)
11.6.2 Middle East and Africa Smart Interactive Toys Systems Revenue (USD Million), by Type (2023-2030)
11.6.3 Middle East and Africa Smart Interactive Toys Systems Revenue (USD Million), by Applications (2023-2030)
12 Methodology and Data Sources
12.1 Methodology/Research Approach
12.1.1 Research Programs/Design
12.1.2 Market Size Estimation
12.1.3 Market Breakdown and Data Triangulation
12.2 Data Sources
12.2.1 Secondary Sources
12.2.2 Primary Sources
12.3 Disclaimer
List Of Tables
Table 1 Market Segmentation Analysis
Table 2 Global Smart Interactive Toys Systems Market Companies with Areas Served
Table 3 Products Offerings Global Smart Interactive Toys Systems Market
Table 4 Low Growth Scenario Forecasts
Table 5 Reference Case Growth Scenario
Table 6 High Growth Case Scenario
Table 7 Global Smart Interactive Toys Systems Revenue (USD Million) And CAGR (%) By Type (2018-2030)
Table 8 Global Smart Interactive Toys Systems Revenue (USD Million) And CAGR (%) By Applications (2018-2030)
Table 9 Global Smart Interactive Toys Systems Revenue (USD Million) And CAGR (%) By Regions (2018-2030)
Table 10 Global Smart Interactive Toys Systems Revenue (USD Million) By Type (2018-2022)
Table 11 Global Smart Interactive Toys Systems Revenue Market Share (%) By Type (2018-2022)
Table 12 Global Smart Interactive Toys Systems Revenue (USD Million) By Applications (2018-2022)
Table 13 Global Smart Interactive Toys Systems Revenue Market Share (%) By Applications (2018-2022)
Table 14 Global Smart Interactive Toys Systems Market Revenue (USD Million) By Regions (2018-2022)
Table 15 Global Smart Interactive Toys Systems Market Share (%) By Regions (2018-2022)
Table 16 North America Smart Interactive Toys Systems Revenue (USD Million) By Country (2018-2022)
Table 17 North America Smart Interactive Toys Systems Revenue (USD Million) By Type (2018-2022)
Table 18 North America Smart Interactive Toys Systems Revenue (USD Million) By Applications (2018-2022)
Table 19 Europe Smart Interactive Toys Systems Revenue (USD Million) By Country (2018-2022)
Table 20 Europe Smart Interactive Toys Systems Revenue (USD Million) By Type (2018-2022)
Table 21 Europe Smart Interactive Toys Systems Revenue (USD Million) By Applications (2018-2022)
Table 22 Asia Pacific Smart Interactive Toys Systems Revenue (USD Million) By Country (2018-2022)
Table 23 Asia Pacific Smart Interactive Toys Systems Revenue (USD Million) By Type (2018-2022)
Table 24 Asia Pacific Smart Interactive Toys Systems Revenue (USD Million) By Applications (2018-2022)
Table 25 South America Smart Interactive Toys Systems Revenue (USD Million) By Country (2018-2022)
Table 26 South America Smart Interactive Toys Systems Revenue (USD Million) By Type (2018-2022)
Table 27 South America Smart Interactive Toys Systems Revenue (USD Million) By Applications (2018-2022)
Table 28 Middle East and Africa Smart Interactive Toys Systems Revenue (USD Million) By Region (2018-2022)
Table 29 Middle East and Africa Smart Interactive Toys Systems Revenue (USD Million) By Type (2018-2022)
Table 30 Middle East and Africa Smart Interactive Toys Systems Revenue (USD Million) By Applications (2018-2022)
Table 31 Financial Analysis
Table 32 Global Smart Interactive Toys Systems Revenue (USD Million) By Type (2023-2030)
Table 33 Global Smart Interactive Toys Systems Revenue Market Share (%) By Type (2023-2030)
Table 34 Global Smart Interactive Toys Systems Revenue (USD Million) By Applications (2023-2030)
Table 35 Global Smart Interactive Toys Systems Revenue Market Share (%) By Applications (2023-2030)
Table 36 Global Smart Interactive Toys Systems Market Revenue (USD Million), And Revenue (USD Million) By Regions (2023-2030)
Table 37 North America Smart Interactive Toys Systems Revenue (USD)By Country (2023-2030)
Table 38 North America Smart Interactive Toys Systems Revenue (USD Million) By Type (2023-2030)
Table 39 North America Smart Interactive Toys Systems Revenue (USD Million) By Applications (2023-2030)
Table 40 Europe Smart Interactive Toys Systems Revenue (USD Million) By Country (2023-2030)
Table 41 Europe Smart Interactive Toys Systems Revenue (USD Million) By Type (2023-2030)
Table 42 Europe Smart Interactive Toys Systems Revenue (USD Million) By Applications (2023-2030)
Table 43 Asia Pacific Smart Interactive Toys Systems Revenue (USD Million) By Country (2023-2030)
Table 44 Asia Pacific Smart Interactive Toys Systems Revenue (USD Million) By Type (2023-2030)
Table 45 Asia Pacific Smart Interactive Toys Systems Revenue (USD Million) By Applications (2023-2030)
Table 46 South America Smart Interactive Toys Systems Revenue (USD Million) By Country (2023-2030)
Table 47 South America Smart Interactive Toys Systems Revenue (USD Million) By Type (2023-2030)
Table 48 South America Smart Interactive Toys Systems Revenue (USD Million) By Applications (2023-2030)
Table 49 Middle East and Africa Smart Interactive Toys Systems Revenue (USD Million) By Region (2023-2030)
Table 50 Middle East and Africa Smart Interactive Toys Systems Revenue (USD Million) By Region (2023-2030)
Table 51 Middle East and Africa Smart Interactive Toys Systems Revenue (USD Million) By Type (2023-2030)
Table 52 Middle East and Africa Smart Interactive Toys Systems Revenue (USD Million) By Applications (2023-2030)
Table 53 Research Programs/Design for This Report
Table 54 Key Data Information from Secondary Sources
Table 55 Key Data Information from Primary Sources
List Of Figures
Figure 1 Market Scope
Figure 2 Porter’s Five Forces
Figure 3 Global Smart Interactive Toys Systems Revenue (USD Million) By Type (2018-2022)
Figure 4 Global Smart Interactive Toys Systems Revenue Market Share (%) By Type (2022)
Figure 5 Global Smart Interactive Toys Systems Revenue (USD Million) By Applications (2018-2022)
Figure 6 Global Smart Interactive Toys Systems Revenue Market Share (%) By Applications (2022)
Figure 7 Global Smart Interactive Toys Systems Market Revenue (USD Million) By Regions (2018-2022)
Figure 8 Global Smart Interactive Toys Systems Market Share (%) By Regions (2022)
Figure 9 North America Smart Interactive Toys Systems Revenue (USD Million) By Country (2018-2022)
Figure 10 North America Smart Interactive Toys Systems Revenue (USD Million) By Type (2018-2022)
Figure 11 North America Smart Interactive Toys Systems Revenue (USD Million) By Applications (2018-2022)
Figure 12 Europe Smart Interactive Toys Systems Revenue (USD Million) By Country (2018-2022)
Figure 13 Europe Smart Interactive Toys Systems Revenue (USD Million) By Type (2018-2022)
Figure 14 Europe Smart Interactive Toys Systems Revenue (USD Million) By Applications (2018-2022)
Figure 15 Asia Pacific Smart Interactive Toys Systems Revenue (USD Million) By Country (2018-2022)
Figure 16 Asia Pacific Smart Interactive Toys Systems Revenue (USD Million) By Type (2018-2022)
Figure 17 Asia Pacific Smart Interactive Toys Systems Revenue (USD Million) By Applications (2018-2022)
Figure 18 South America Smart Interactive Toys Systems Revenue (USD Million) By Country (2018-2022)
Figure 19 South America Smart Interactive Toys Systems Revenue (USD Million) By Type (2018-2022)
Figure 20 South America Smart Interactive Toys Systems Revenue (USD Million) By Applications (2018-2022)
Figure 21 Middle East and Africa Smart Interactive Toys Systems Revenue (USD Million) By Region (2018-2022)
Figure 22 Middle East and Africa Smart Interactive Toys Systems Revenue (USD Million) By Type (2018-2022)
Figure 23 Middle East and Africa Smart Interactive Toys Systems Revenue (USD Million) By Applications (2018-2022)
Figure 24 Global Smart Interactive Toys Systems Revenue (USD Million) By Type (2023-2030)
Figure 25 Global Smart Interactive Toys Systems Revenue Market Share (%) By Type (2030)
Figure 26 Global Smart Interactive Toys Systems Revenue (USD Million) By Applications (2023-2030)
Figure 27 Global Smart Interactive Toys Systems Revenue Market Share (%) By Applications (2030)
Figure 28 Global Smart Interactive Toys Systems Market Revenue (USD Million) By Regions (2023-2030)
Figure 29 North America Smart Interactive Toys Systems Revenue (USD Million) By Country (2023-2030)
Figure 30 North America Smart Interactive Toys Systems Revenue (USD Million) By Type (2023-2030)
Figure 31 North America Smart Interactive Toys Systems Revenue (USD Million) By Applications (2023-2030)
Figure 32 Europe Smart Interactive Toys Systems Revenue (USD Million) By Country (2023-2030)
Figure 33 Europe Smart Interactive Toys Systems Revenue (USD Million) By Type (2023-2030)
Figure 34 Europe Smart Interactive Toys Systems Revenue (USD Million) By Applications (2023-2030)
Figure 35 Asia Pacific Smart Interactive Toys Systems Revenue (USD Million) By Country (2023-2030)
Figure 36 Asia Pacific Smart Interactive Toys Systems Revenue (USD Million) By Type (2023-2030)
Figure 37 Asia Pacific Smart Interactive Toys Systems Revenue (USD Million) By Applications (2023-2030)
Figure 38 South America Smart Interactive Toys Systems Revenue (USD Million) By Country (2023-2030)
Figure 39 South America Smart Interactive Toys Systems Revenue (USD Million) By Type (2023-2030)
Figure 40 South America Smart Interactive Toys Systems Revenue (USD Million) By Applications (2023-2030)
Figure 41 Middle East and Africa Smart Interactive Toys Systems Revenue (USD Million) By Region (2023-2030)
Figure 42 Middle East and Africa Smart Interactive Toys Systems Revenue (USD Million) By Region (2023-2030)
Figure 43 Middle East and Africa Smart Interactive Toys Systems Revenue (USD Million) By Type (2023-2030)
Figure 44 Middle East and Africa Smart Interactive Toys Systems Revenue (USD Million) By Applications (2023-2030)
Figure 45 Bottom-Up and Top-Down Approaches For This Report
Figure 46 Data Triangulation
