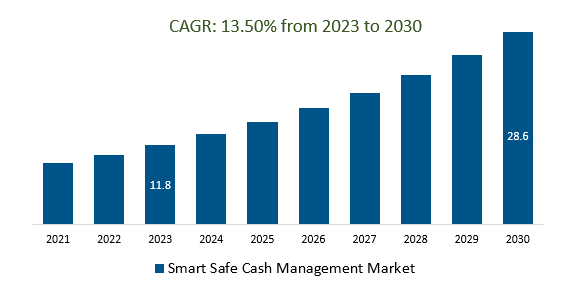
The global Smart Safe Cash Management Market Size is estimated to be US$ 11.8 Billion in 2023 and is poised to register 13.5% growth over the forecast period from 2023 to 2030 to reach US $ 28.6 billion in 2030.
The market growth is driven predominantly by businesses that are increasingly looking for ways to automate their cash-handling processes to improve efficiency and reduce human error. Smart safes are equipped with features like automatic bill validation, counting, sorting, and secure storage. Leading companies are integrating with IoT and Cloud Technologies, Advanced Security Features, Data-Driven Insights, Partnerships, Ecosystem Development, and others to boost market shares in the industry.
Market Overview
The Smart Safe Cash Management Market involves the integration of advanced technology with traditional safes, enhancing cash handling for businesses through features like automated processing, real-time monitoring, and data analytics. These systems offer increased security through biometric authentication and tamper alerts, reduce errors, improve operational efficiency, and optimize cash flow. They find applications in retail, banking, hospitality, and more, with trends focusing on fintech integration, contactless payments, data security, and regulatory compliance. The market is poised for growth as businesses seek secure, efficient cash management solutions across industries and regions globally.
Market Dynamics
Market Trends- Companies are launching Data Security to attract a consumer base
Data security is of utmost importance in the Smart Safe Cash Management Market, where sensitive financial information is handled. Strong encryption, access control, network security, and physical security measures are crucial to prevent unauthorized access, breaches, and tampering. Regular audits, incident response plans, and compliance with regulations are essential for maintaining a secure environment. User training, secure software development, and vendor assessments further contribute to safeguarding data and maintaining trust in the market.
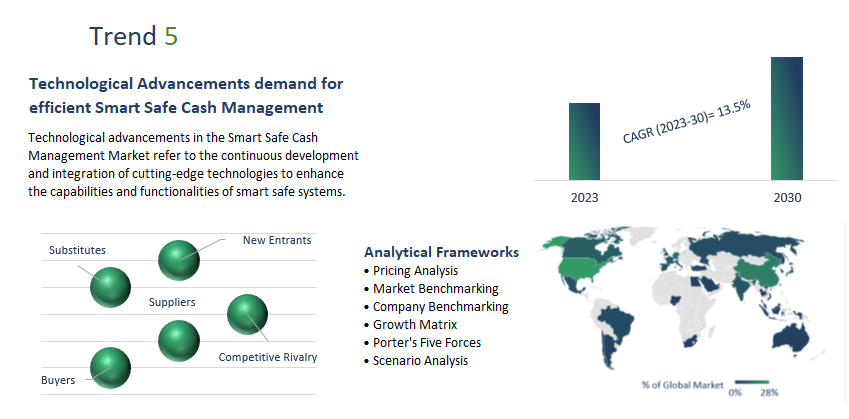
Market Driver- Technological Advancements demand for efficient Smart Safe Cash Management Market
Technological advancements in the Smart Safe Cash Management Market refer to the continuous development and integration of cutting-edge technologies to enhance the capabilities and functionalities of smart safe systems. These advancements include the incorporation of biometric authentication, sensors, data analytics, IoT connectivity, AI algorithms, and cloud integration. These technologies enable real-time monitoring, secure access control, predictive analytics, remote management, and seamless integration with other financial systems, ultimately improving the efficiency, accuracy, and security of cash-handling operations. As technology evolves, smart safe systems continue to evolve as well, offering businesses more sophisticated and versatile tools for managing their cash operations.
Market Opportunity-Introduction of Industry Diversification
The industry diversification in the Smart Safe Cash Management Market refers to the expansion of these technologies beyond traditional sectors like retail and banking, into a wider range of industries such as hospitality, healthcare, entertainment, and more. As businesses recognize the benefits of efficient and secure cash handling, smart safe solutions are finding new applications in diverse sectors, optimizing financial operations, and enhancing security across various industries. This diversification is driven by the need for accuracy, operational efficiency, and risk reduction in managing cash transactions, making smart safe systems relevant and adaptable to the specific needs of different industries.
Market Segmentation
Government and Public Sector: The government and public sector in the Smart Safe Cash Management Market pertains to the adoption of advanced cash management technologies, including smart safe systems, by government agencies, municipalities, and public institutions. These entities utilize smart safe solutions to enhance their cash-handling processes, improve security, and optimize financial operations. For instance, government offices, tax collection centers, public transportation systems, and municipal facilities can benefit from the efficiency, accuracy, and security provided by smart safes. The integration of these systems in the government and public sector aligns with the broader trend of adopting technology to streamline operations and enhance public service delivery while ensuring the secure management of public funds.
Segmentation
By Component
- Hardware
- Software
- Service
By Deployment Mode
By Cassette Capacity
- Upto 1200
- 2,250
- 4000
- 10, 000 and above
By Application
- BFSI
- Retail
- Hotel and Restaurants
- Government and Public Sector
- Entertainment and Gaming
- Others
By Region
- North America (United States, Canada, Mexico)
- Europe (Germany, France, United Kingdom, Spain, Italy, Others)
- Asia Pacific (China, India, Japan, South Korea, Australia, Others)
- Latin America (Brazil, Argentina, Others)
- Middle East and Africa (Saudi Arabia, UAE, Kuwait, Other Middle East, South Africa, Nigeria, Other Africa)
Key Players
Leading companies profiled in the study include-
- American Express
- Fiserv, Gunnebo
- Diebold Nixdrof
- GardaWorld
- Tellermate
- Intimus
- Fireking Security
- Triton System
- BS2
- Tidel Engineering
- AMSEC
- Armor Safe Technologies
- Superior Press
Smart Safe Cash Management Market Outlook 2023
1 Market Overview
1.1 Introduction to the Smart Safe Cash Management Market
1.2 Scope of the Study
1.3 Research Objective
1.3.1 Key Market Scope and Segments
1.3.2 Players Covered
1.3.3 Years Considered
2 Executive Summary
2.1 2023 Smart Safe Cash Management Industry- Market Statistics
3 Market Dynamics
3.1 Market Drivers
3.2 Market Challenges
3.3 Market Opportunities
3.4 Market Trends
4 Market Factor Analysis
4.1 Porter’s Five Forces
4.2 Market Entropy
4.2.1 Global Smart Safe Cash Management Market Companies with Area Served
4.2.2 Products Offerings Global Smart Safe Cash Management Market
5 COVID-19 Impact Analysis and Outlook Scenarios
5.1.1 Covid-19 Impact Analysis
5.1.2 Post-COVID-19 Scenario- Low Growth Case
5.1.3 Post-COVID-19 Scenario- Reference Growth Case
5.1.4 Post-COVID-19 Scenario- Low Growth Case
6 Global Smart Safe Cash Management Market Trends
6.1 Global Smart Safe Cash Management Revenue (USD Million) and CAGR (%) by Type (2018-2030)
6.2 Global Smart Safe Cash Management Revenue (USD Million) and CAGR (%) by Applications (2018-2030)
6.3 Global Smart Safe Cash Management Revenue (USD Million) and CAGR (%) by Regions (2018-2030)
7 Global Smart Safe Cash Management Market Revenue (USD Million) by Type, and Applications (2018-2022)
7.1 Global Smart Safe Cash Management Revenue (USD Million) by Type (2018-2022)
7.1.1 Global Smart Safe Cash Management Revenue (USD Million), Market Share (%) by Type (2018-2022)
7.2 Global Smart Safe Cash Management Revenue (USD Million) by Applications (2018-2022)
7.2.1 Global Smart Safe Cash Management Revenue (USD Million), Market Share (%) by Applications (2018-2022)
8 Global Smart Safe Cash Management Development Regional Status and Outlook
8.1 Global Smart Safe Cash Management Revenue (USD Million) By Regions (2018-2022)
8.2 North America Smart Safe Cash Management Revenue (USD Million) by Type, and Application (2018-2022)
8.2.1 North America Smart Safe Cash Management Revenue (USD Million) by Country (2018-2022)
8.2.2 North America Smart Safe Cash Management Revenue (USD Million) by Type (2018-2022)
8.2.3 North America Smart Safe Cash Management Revenue (USD Million) by Applications (2018-2022)
8.3 Europe Smart Safe Cash Management Revenue (USD Million), by Type, and Applications (USD Million) (2018-2022)
8.3.1 Europe Smart Safe Cash Management Revenue (USD Million), by Country (2018-2022)
8.3.2 Europe Smart Safe Cash Management Revenue (USD Million) by Type (2018-2022)
8.3.3 Europe Smart Safe Cash Management Revenue (USD Million) by Applications (2018-2022)
8.4 Asia Pacific Smart Safe Cash Management Revenue (USD Million), and Revenue (USD Million) by Type, and Applications (2018-2022)
8.4.1 Asia Pacific Smart Safe Cash Management Revenue (USD Million) by Country (2018-2022)
8.4.2 Asia Pacific Smart Safe Cash Management Revenue (USD Million) by Type (2018-2022)
8.4.3 Asia Pacific Smart Safe Cash Management Revenue (USD Million) by Applications (2018-2022)
8.5 South America Smart Safe Cash Management Revenue (USD Million), by Type, and Applications (2018-2022)
8.5.1 South America Smart Safe Cash Management Revenue (USD Million), by Country (2018-2022)
8.5.2 South America Smart Safe Cash Management Revenue (USD Million) by Type (2018-2022)
8.5.3 South America Smart Safe Cash Management Revenue (USD Million) by Applications (2018-2022)
8.6 Middle East and Africa Smart Safe Cash Management Revenue (USD Million), by Type, Technology, Application, Thickness (2018-2022)
8.6.1 Middle East and Africa Smart Safe Cash Management Revenue (USD Million) by Country (2018-2022)
8.6.2 Middle East and Africa Smart Safe Cash Management Revenue (USD Million) by Type (2018-2022)
8.6.3 Middle East and Africa Smart Safe Cash Management Revenue (USD Million) by Applications (2018-2022)
9 Company Profiles
10 Global Smart Safe Cash Management Market Revenue (USD Million), by Type, and Applications (2023-2030)
10.1 Global Smart Safe Cash Management Revenue (USD Million) and Market Share (%) by Type (2023-2030)
10.1.1 Global Smart Safe Cash Management Revenue (USD Million), and Market Share (%) by Type (2023-2030)
10.2 Global Smart Safe Cash Management Revenue (USD Million) and Market Share (%) by Applications (2023-2030)
10.2.1 Global Smart Safe Cash Management Revenue (USD Million), and Market Share (%) by Applications (2023-2030)
11 Global Smart Safe Cash Management Development Regional Status and Outlook Forecast
11.1 Global Smart Safe Cash Management Revenue (USD Million) By Regions (2023-2030)
11.2 North America Smart Safe Cash Management Revenue (USD Million) by Type, and Applications (2023-2030)
11.2.1 North America Smart Safe Cash Management Revenue (USD) Million by Country (2023-2030)
11.2.2 North America Smart Safe Cash Management Revenue (USD Million), by Type (2023-2030)
11.2.3 North America Smart Safe Cash Management Revenue (USD Million), Market Share (%) by Applications (2023-2030)
11.3 Europe Smart Safe Cash Management Revenue (USD Million), by Type, and Applications (2023-2030)
11.3.1 Europe Smart Safe Cash Management Revenue (USD Million), by Country (2023-2030)
11.3.2 Europe Smart Safe Cash Management Revenue (USD Million), by Type (2023-2030)
11.3.3 Europe Smart Safe Cash Management Revenue (USD Million), by Applications (2023-2030)
11.4 Asia Pacific Smart Safe Cash Management Revenue (USD Million) by Type, and Applications (2023-2030)
11.4.1 Asia Pacific Smart Safe Cash Management Revenue (USD Million), by Country (2023-2030)
11.4.2 Asia Pacific Smart Safe Cash Management Revenue (USD Million), by Type (2023-2030)
11.4.3 Asia Pacific Smart Safe Cash Management Revenue (USD Million), by Applications (2023-2030)
11.5 South America Smart Safe Cash Management Revenue (USD Million), by Type, and Applications (2023-2030)
11.5.1 South America Smart Safe Cash Management Revenue (USD Million), by Country (2023-2030)
11.5.2 South America Smart Safe Cash Management Revenue (USD Million), by Type (2023-2030)
11.5.3 South America Smart Safe Cash Management Revenue (USD Million), by Applications (2023-2030)
11.6 Middle East and Africa Smart Safe Cash Management Revenue (USD Million), by Type, and Applications (2023-2030)
11.6.1 Middle East and Africa Smart Safe Cash Management Revenue (USD Million), by Region (2023-2030)
11.6.2 Middle East and Africa Smart Safe Cash Management Revenue (USD Million), by Type (2023-2030)
11.6.3 Middle East and Africa Smart Safe Cash Management Revenue (USD Million), by Applications (2023-2030)
12 Methodology and Data Sources
12.1 Methodology/Research Approach
12.1.1 Research Programs/Design
12.1.2 Market Size Estimation
12.1.3 Market Breakdown and Data Triangulation
12.2 Data Sources
12.2.1 Secondary Sources
12.2.2 Primary Sources
12.3 Disclaimer
List Of Tables
Table 1 Market Segmentation Analysis
Table 2 Global Smart Safe Cash Management Market Companies with Areas Served
Table 3 Products Offerings Global Smart Safe Cash Management Market
Table 4 Low Growth Scenario Forecasts
Table 5 Reference Case Growth Scenario
Table 6 High Growth Case Scenario
Table 7 Global Smart Safe Cash Management Revenue (USD Million) And CAGR (%) By Type (2018-2030)
Table 8 Global Smart Safe Cash Management Revenue (USD Million) And CAGR (%) By Applications (2018-2030)
Table 9 Global Smart Safe Cash Management Revenue (USD Million) And CAGR (%) By Regions (2018-2030)
Table 10 Global Smart Safe Cash Management Revenue (USD Million) By Type (2018-2022)
Table 11 Global Smart Safe Cash Management Revenue Market Share (%) By Type (2018-2022)
Table 12 Global Smart Safe Cash Management Revenue (USD Million) By Applications (2018-2022)
Table 13 Global Smart Safe Cash Management Revenue Market Share (%) By Applications (2018-2022)
Table 14 Global Smart Safe Cash Management Market Revenue (USD Million) By Regions (2018-2022)
Table 15 Global Smart Safe Cash Management Market Share (%) By Regions (2018-2022)
Table 16 North America Smart Safe Cash Management Revenue (USD Million) By Country (2018-2022)
Table 17 North America Smart Safe Cash Management Revenue (USD Million) By Type (2018-2022)
Table 18 North America Smart Safe Cash Management Revenue (USD Million) By Applications (2018-2022)
Table 19 Europe Smart Safe Cash Management Revenue (USD Million) By Country (2018-2022)
Table 20 Europe Smart Safe Cash Management Revenue (USD Million) By Type (2018-2022)
Table 21 Europe Smart Safe Cash Management Revenue (USD Million) By Applications (2018-2022)
Table 22 Asia Pacific Smart Safe Cash Management Revenue (USD Million) By Country (2018-2022)
Table 23 Asia Pacific Smart Safe Cash Management Revenue (USD Million) By Type (2018-2022)
Table 24 Asia Pacific Smart Safe Cash Management Revenue (USD Million) By Applications (2018-2022)
Table 25 South America Smart Safe Cash Management Revenue (USD Million) By Country (2018-2022)
Table 26 South America Smart Safe Cash Management Revenue (USD Million) By Type (2018-2022)
Table 27 South America Smart Safe Cash Management Revenue (USD Million) By Applications (2018-2022)
Table 28 Middle East and Africa Smart Safe Cash Management Revenue (USD Million) By Region (2018-2022)
Table 29 Middle East and Africa Smart Safe Cash Management Revenue (USD Million) By Type (2018-2022)
Table 30 Middle East and Africa Smart Safe Cash Management Revenue (USD Million) By Applications (2018-2022)
Table 31 Financial Analysis
Table 32 Global Smart Safe Cash Management Revenue (USD Million) By Type (2023-2030)
Table 33 Global Smart Safe Cash Management Revenue Market Share (%) By Type (2023-2030)
Table 34 Global Smart Safe Cash Management Revenue (USD Million) By Applications (2023-2030)
Table 35 Global Smart Safe Cash Management Revenue Market Share (%) By Applications (2023-2030)
Table 36 Global Smart Safe Cash Management Market Revenue (USD Million), And Revenue (USD Million) By Regions (2023-2030)
Table 37 North America Smart Safe Cash Management Revenue (USD)By Country (2023-2030)
Table 38 North America Smart Safe Cash Management Revenue (USD Million) By Type (2023-2030)
Table 39 North America Smart Safe Cash Management Revenue (USD Million) By Applications (2023-2030)
Table 40 Europe Smart Safe Cash Management Revenue (USD Million) By Country (2023-2030)
Table 41 Europe Smart Safe Cash Management Revenue (USD Million) By Type (2023-2030)
Table 42 Europe Smart Safe Cash Management Revenue (USD Million) By Applications (2023-2030)
Table 43 Asia Pacific Smart Safe Cash Management Revenue (USD Million) By Country (2023-2030)
Table 44 Asia Pacific Smart Safe Cash Management Revenue (USD Million) By Type (2023-2030)
Table 45 Asia Pacific Smart Safe Cash Management Revenue (USD Million) By Applications (2023-2030)
Table 46 South America Smart Safe Cash Management Revenue (USD Million) By Country (2023-2030)
Table 47 South America Smart Safe Cash Management Revenue (USD Million) By Type (2023-2030)
Table 48 South America Smart Safe Cash Management Revenue (USD Million) By Applications (2023-2030)
Table 49 Middle East and Africa Smart Safe Cash Management Revenue (USD Million) By Region (2023-2030)
Table 50 Middle East and Africa Smart Safe Cash Management Revenue (USD Million) By Region (2023-2030)
Table 51 Middle East and Africa Smart Safe Cash Management Revenue (USD Million) By Type (2023-2030)
Table 52 Middle East and Africa Smart Safe Cash Management Revenue (USD Million) By Applications (2023-2030)
Table 53 Research Programs/Design for This Report
Table 54 Key Data Information from Secondary Sources
Table 55 Key Data Information from Primary Sources
List Of Figures
Figure 1 Market Scope
Figure 2 Porter’s Five Forces
Figure 3 Global Smart Safe Cash Management Revenue (USD Million) By Type (2018-2022)
Figure 4 Global Smart Safe Cash Management Revenue Market Share (%) By Type (2022)
Figure 5 Global Smart Safe Cash Management Revenue (USD Million) By Applications (2018-2022)
Figure 6 Global Smart Safe Cash Management Revenue Market Share (%) By Applications (2022)
Figure 7 Global Smart Safe Cash Management Market Revenue (USD Million) By Regions (2018-2022)
Figure 8 Global Smart Safe Cash Management Market Share (%) By Regions (2022)
Figure 9 North America Smart Safe Cash Management Revenue (USD Million) By Country (2018-2022)
Figure 10 North America Smart Safe Cash Management Revenue (USD Million) By Type (2018-2022)
Figure 11 North America Smart Safe Cash Management Revenue (USD Million) By Applications (2018-2022)
Figure 12 Europe Smart Safe Cash Management Revenue (USD Million) By Country (2018-2022)
Figure 13 Europe Smart Safe Cash Management Revenue (USD Million) By Type (2018-2022)
Figure 14 Europe Smart Safe Cash Management Revenue (USD Million) By Applications (2018-2022)
Figure 15 Asia Pacific Smart Safe Cash Management Revenue (USD Million) By Country (2018-2022)
Figure 16 Asia Pacific Smart Safe Cash Management Revenue (USD Million) By Type (2018-2022)
Figure 17 Asia Pacific Smart Safe Cash Management Revenue (USD Million) By Applications (2018-2022)
Figure 18 South America Smart Safe Cash Management Revenue (USD Million) By Country (2018-2022)
Figure 19 South America Smart Safe Cash Management Revenue (USD Million) By Type (2018-2022)
Figure 20 South America Smart Safe Cash Management Revenue (USD Million) By Applications (2018-2022)
Figure 21 Middle East and Africa Smart Safe Cash Management Revenue (USD Million) By Region (2018-2022)
Figure 22 Middle East and Africa Smart Safe Cash Management Revenue (USD Million) By Type (2018-2022)
Figure 23 Middle East and Africa Smart Safe Cash Management Revenue (USD Million) By Applications (2018-2022)
Figure 24 Global Smart Safe Cash Management Revenue (USD Million) By Type (2023-2030)
Figure 25 Global Smart Safe Cash Management Revenue Market Share (%) By Type (2030)
Figure 26 Global Smart Safe Cash Management Revenue (USD Million) By Applications (2023-2030)
Figure 27 Global Smart Safe Cash Management Revenue Market Share (%) By Applications (2030)
Figure 28 Global Smart Safe Cash Management Market Revenue (USD Million) By Regions (2023-2030)
Figure 29 North America Smart Safe Cash Management Revenue (USD Million) By Country (2023-2030)
Figure 30 North America Smart Safe Cash Management Revenue (USD Million) By Type (2023-2030)
Figure 31 North America Smart Safe Cash Management Revenue (USD Million) By Applications (2023-2030)
Figure 32 Europe Smart Safe Cash Management Revenue (USD Million) By Country (2023-2030)
Figure 33 Europe Smart Safe Cash Management Revenue (USD Million) By Type (2023-2030)
Figure 34 Europe Smart Safe Cash Management Revenue (USD Million) By Applications (2023-2030)
Figure 35 Asia Pacific Smart Safe Cash Management Revenue (USD Million) By Country (2023-2030)
Figure 36 Asia Pacific Smart Safe Cash Management Revenue (USD Million) By Type (2023-2030)
Figure 37 Asia Pacific Smart Safe Cash Management Revenue (USD Million) By Applications (2023-2030)
Figure 38 South America Smart Safe Cash Management Revenue (USD Million) By Country (2023-2030)
Figure 39 South America Smart Safe Cash Management Revenue (USD Million) By Type (2023-2030)
Figure 40 South America Smart Safe Cash Management Revenue (USD Million) By Applications (2023-2030)
Figure 41 Middle East and Africa Smart Safe Cash Management Revenue (USD Million) By Region (2023-2030)
Figure 42 Middle East and Africa Smart Safe Cash Management Revenue (USD Million) By Region (2023-2030)
Figure 43 Middle East and Africa Smart Safe Cash Management Revenue (USD Million) By Type (2023-2030)
Figure 44 Middle East and Africa Smart Safe Cash Management Revenue (USD Million) By Applications (2023-2030)
Figure 45 Bottom-Up and Top-Down Approaches For This Report
Figure 46 Data Triangulation
