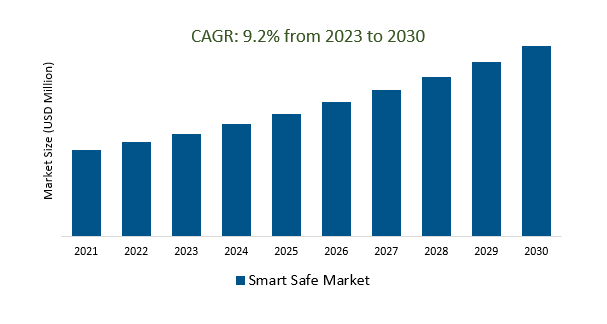
The Global Smart Safe Market Size is estimated to register 9.2% growth over the forecast period from 2023 to 2030.
The market growth is driven by the increasing concern for security, both for individuals and businesses, which is a significant driver for the Smart Safe Market. Smart safes offer enhanced security features, including biometric authentication, remote monitoring, and real-time alerts. Leading companies that are focused on Technological Advancements, Increased Adoption Across Industries, Cash Handling Optimization, Integration with Financial Services, Data Analytics and Business Intelligence, Cybersecurity Measures, and others to boost market shares in the industry.
Market Overview
The Smart Safe Market involves technologically advanced safes designed to enhance security and streamline cash management for businesses. Key drivers include heightened security concerns, the need for cash management efficiency, and adoption in sectors like retail and banking. Trends encompass technological advancements, global expansion, growth in e-commerce, regulatory compliance, and an emphasis on environmental sustainability. Smart safes are becoming integrated with POS systems, offering data analytics and reporting, and promoting cybersecurity measures. The market is expected to continue evolving, driven by a growing emphasis on security, efficiency, and compliance in the handling of cash assets by businesses of all sizes.
Market Dynamics
Market Trends - Data analytics and reporting are essential for smart safe users to get the most out of their investment.
Data analytics and reporting indeed play a crucial role in maximizing the benefits of smart safes for users. These features enable businesses to gain valuable insights into their cash-handling processes, improve efficiency, enhance security, and make informed decisions. By analyzing data generated by smart safes, users can track cash usage patterns, identify discrepancies, optimize cash flow, and ensure compliance with regulatory requirements. This information empowers businesses to make data-driven decisions, reduce operational costs, and ultimately get the most value from their investment in smart safes.
Market Driver- The banking and financial services sector is a major driver of demand for smart safes
The banking and financial services sector's demand for smart safes is driven by their capacity to optimize cash management, bolster security, meet regulatory requirements, and reduce operational costs. Smart safes automate cash-handling processes, enforce stringent security measures, maintain comprehensive transaction records, and enable remote monitoring. These features make smart safes indispensable tools for improving the efficiency and safety of cash management in financial institutions.
Market Opportunity-Introduction of Hospitality Industry
The hospitality industry represents a significant market for smart safes, primarily due to their ability to streamline cash handling, enhance security, ensure regulatory compliance, and improve the overall guest experience. These safes automate cash-related processes, reduce errors, and offer advanced security features such as biometric authentication and tamper detection. They also assist in maintaining an accountable and auditable cash management system, helping businesses meet financial regulations. Moreover, smart safes contribute to smoother guest transactions and can be remotely managed, making them essential tools for efficiency and security in hotels, restaurants, and other establishments within the hospitality sector.
Market Share Analysis- Note deposit type Smart Safe Market will register the fastest growth
The Global Smart Safe Market is analyzed across Note Deposit Types, Coin Deposit Types, and others. Note deposit types are poised to register the fastest growth. The deposit types in the Smart Safe Market refer to the various methods used for depositing banknotes into these advanced security systems. These deposit methods include note slots for individual or batch deposits, note recyclers that accept, verify, and dispense banknotes, bulk note feeders for high-volume cash handling, mixed-note deposits for accepting notes of different denominations, envelope deposits for secure storage, dedicated cash deposit modules for advanced functionality, and even remote deposit options for off-site transactions.
Market Share Analysis- Financial institutions held a significant market share in 2023
The Global Smart Safe Market is analyzed across various applications including Financial Institutions, Retail Stores, Hotels, Government Organizations, and others. Of these, financial institutions held a significant market share in 2023. Financial institutions represent a significant market for the Smart Safe industry due to their substantial cash-handling needs and stringent security requirements. Smart safes play a vital role in these institutions by automating cash management processes, bolstering security with advanced features, ensuring compliance with regulatory standards, maintaining detailed audit trails for accountability, and potentially leading to cost savings through increased operational efficiency.
Smart Safe Market Segmentation
By Type
- Note Deposit Type
- Coin Deposit Type
By Application
- Financial Institutions
- Retail Stores
- Hotels
- Government Organizations
- Others
By Region
- North America (United States, Canada, Mexico)
- Europe (Germany, France, United Kingdom, Spain, Italy, Others)
- Asia Pacific (China, India, Japan, South Korea, Australia, Others)
- Latin America (Brazil, Argentina, Others)
- Middle East and Africa (Saudi Arabia, UAE, Kuwait, Other Middle East, South Africa, Nigeria, Other Africa)
Smart Safe Market Companies
- Triton Systems
- Ellenby Technologies
- Tidel
- Fiserv
- FireKing Security Group
- GardaWorld
- Intimus International Group
- Tellermate
- BVK Technology
- Loomis
- CIMA Spa
- Gunnebo AB
*List not exhaustive
Smart Safe Market Outlook 2023
1 Market Overview
1.1 Introduction to the Smart Safe Market
1.2 Scope of the Study
1.3 Research Objective
1.3.1 Key Market Scope and Segments
1.3.2 Players Covered
1.3.3 Years Considered
2 Executive Summary
2.1 2023 Smart Safe Industry- Market Statistics
3 Market Dynamics
3.1 Market Drivers
3.2 Market Challenges
3.3 Market Opportunities
3.4 Market Trends
4 Market Factor Analysis
4.1 Porter’s Five Forces
4.2 Market Entropy
4.2.1 Global Smart Safe Market Companies with Area Served
4.2.2 Products Offerings Global Smart Safe Market
5 COVID-19 Impact Analysis and Outlook Scenarios
5.1.1 Covid-19 Impact Analysis
5.1.2 Post-COVID-19 Scenario- Low Growth Case
5.1.3 Post-COVID-19 Scenario- Reference Growth Case
5.1.4 Post-COVID-19 Scenario- Low Growth Case
6 Global Smart Safe Market Trends
6.1 Global Smart Safe Revenue (USD Million) and CAGR (%) by Type (2018-2030)
6.2 Global Smart Safe Revenue (USD Million) and CAGR (%) by Applications (2018-2030)
6.3 Global Smart Safe Revenue (USD Million) and CAGR (%) by Regions (2018-2030)
7 Global Smart Safe Market Revenue (USD Million) by Type, and Applications (2018-2022)
7.1 Global Smart Safe Revenue (USD Million) by Type (2018-2022)
7.1.1 Global Smart Safe Revenue (USD Million), Market Share (%) by Type (2018-2022)
7.2 Global Smart Safe Revenue (USD Million) by Applications (2018-2022)
7.2.1 Global Smart Safe Revenue (USD Million), Market Share (%) by Applications (2018-2022)
8 Global Smart Safe Development Regional Status and Outlook
8.1 Global Smart Safe Revenue (USD Million) By Regions (2018-2022)
8.2 North America Smart Safe Revenue (USD Million) by Type, and Application (2018-2022)
8.2.1 North America Smart Safe Revenue (USD Million) by Country (2018-2022)
8.2.2 North America Smart Safe Revenue (USD Million) by Type (2018-2022)
8.2.3 North America Smart Safe Revenue (USD Million) by Applications (2018-2022)
8.3 Europe Smart Safe Revenue (USD Million), by Type, and Applications (USD Million) (2018-2022)
8.3.1 Europe Smart Safe Revenue (USD Million), by Country (2018-2022)
8.3.2 Europe Smart Safe Revenue (USD Million) by Type (2018-2022)
8.3.3 Europe Smart Safe Revenue (USD Million) by Applications (2018-2022)
8.4 Asia Pacific Smart Safe Revenue (USD Million), and Revenue (USD Million) by Type, and Applications (2018-2022)
8.4.1 Asia Pacific Smart Safe Revenue (USD Million) by Country (2018-2022)
8.4.2 Asia Pacific Smart Safe Revenue (USD Million) by Type (2018-2022)
8.4.3 Asia Pacific Smart Safe Revenue (USD Million) by Applications (2018-2022)
8.5 South America Smart Safe Revenue (USD Million), by Type, and Applications (2018-2022)
8.5.1 South America Smart Safe Revenue (USD Million), by Country (2018-2022)
8.5.2 South America Smart Safe Revenue (USD Million) by Type (2018-2022)
8.5.3 South America Smart Safe Revenue (USD Million) by Applications (2018-2022)
8.6 Middle East and Africa Smart Safe Revenue (USD Million), by Type, Technology, Application, Thickness (2018-2022)
8.6.1 Middle East and Africa Smart Safe Revenue (USD Million) by Country (2018-2022)
8.6.2 Middle East and Africa Smart Safe Revenue (USD Million) by Type (2018-2022)
8.6.3 Middle East and Africa Smart Safe Revenue (USD Million) by Applications (2018-2022)
9 Company Profiles
10 Global Smart Safe Market Revenue (USD Million), by Type, and Applications (2023-2030)
10.1 Global Smart Safe Revenue (USD Million) and Market Share (%) by Type (2023-2030)
10.1.1 Global Smart Safe Revenue (USD Million), and Market Share (%) by Type (2023-2030)
10.2 Global Smart Safe Revenue (USD Million) and Market Share (%) by Applications (2023-2030)
10.2.1 Global Smart Safe Revenue (USD Million), and Market Share (%) by Applications (2023-2030)
11 Global Smart Safe Development Regional Status and Outlook Forecast
11.1 Global Smart Safe Revenue (USD Million) By Regions (2023-2030)
11.2 North America Smart Safe Revenue (USD Million) by Type, and Applications (2023-2030)
11.2.1 North America Smart Safe Revenue (USD) Million by Country (2023-2030)
11.2.2 North America Smart Safe Revenue (USD Million), by Type (2023-2030)
11.2.3 North America Smart Safe Revenue (USD Million), Market Share (%) by Applications (2023-2030)
11.3 Europe Smart Safe Revenue (USD Million), by Type, and Applications (2023-2030)
11.3.1 Europe Smart Safe Revenue (USD Million), by Country (2023-2030)
11.3.2 Europe Smart Safe Revenue (USD Million), by Type (2023-2030)
11.3.3 Europe Smart Safe Revenue (USD Million), by Applications (2023-2030)
11.4 Asia Pacific Smart Safe Revenue (USD Million) by Type, and Applications (2023-2030)
11.4.1 Asia Pacific Smart Safe Revenue (USD Million), by Country (2023-2030)
11.4.2 Asia Pacific Smart Safe Revenue (USD Million), by Type (2023-2030)
11.4.3 Asia Pacific Smart Safe Revenue (USD Million), by Applications (2023-2030)
11.5 South America Smart Safe Revenue (USD Million), by Type, and Applications (2023-2030)
11.5.1 South America Smart Safe Revenue (USD Million), by Country (2023-2030)
11.5.2 South America Smart Safe Revenue (USD Million), by Type (2023-2030)
11.5.3 South America Smart Safe Revenue (USD Million), by Applications (2023-2030)
11.6 Middle East and Africa Smart Safe Revenue (USD Million), by Type, and Applications (2023-2030)
11.6.1 Middle East and Africa Smart Safe Revenue (USD Million), by Region (2023-2030)
11.6.2 Middle East and Africa Smart Safe Revenue (USD Million), by Type (2023-2030)
11.6.3 Middle East and Africa Smart Safe Revenue (USD Million), by Applications (2023-2030)
12 Methodology and Data Sources
12.1 Methodology/Research Approach
12.1.1 Research Programs/Design
12.1.2 Market Size Estimation
12.1.3 Market Breakdown and Data Triangulation
12.2 Data Sources
12.2.1 Secondary Sources
12.2.2 Primary Sources
12.3 Disclaimer
List of Tables
Table 1 Market Segmentation Analysis
Table 2 Global Smart Safe Market Companies with Areas Served
Table 3 Products Offerings Global Smart Safe Market
Table 4 Low Growth Scenario Forecasts
Table 5 Reference Case Growth Scenario
Table 6 High Growth Case Scenario
Table 7 Global Smart Safe Revenue (USD Million) And CAGR (%) By Type (2018-2030)
Table 8 Global Smart Safe Revenue (USD Million) And CAGR (%) By Applications (2018-2030)
Table 9 Global Smart Safe Revenue (USD Million) And CAGR (%) By Regions (2018-2030)
Table 10 Global Smart Safe Revenue (USD Million) By Type (2018-2022)
Table 11 Global Smart Safe Revenue Market Share (%) By Type (2018-2022)
Table 12 Global Smart Safe Revenue (USD Million) By Applications (2018-2022)
Table 13 Global Smart Safe Revenue Market Share (%) By Applications (2018-2022)
Table 14 Global Smart Safe Market Revenue (USD Million) By Regions (2018-2022)
Table 15 Global Smart Safe Market Share (%) By Regions (2018-2022)
Table 16 North America Smart Safe Revenue (USD Million) By Country (2018-2022)
Table 17 North America Smart Safe Revenue (USD Million) By Type (2018-2022)
Table 18 North America Smart Safe Revenue (USD Million) By Applications (2018-2022)
Table 19 Europe Smart Safe Revenue (USD Million) By Country (2018-2022)
Table 20 Europe Smart Safe Revenue (USD Million) By Type (2018-2022)
Table 21 Europe Smart Safe Revenue (USD Million) By Applications (2018-2022)
Table 22 Asia Pacific Smart Safe Revenue (USD Million) By Country (2018-2022)
Table 23 Asia Pacific Smart Safe Revenue (USD Million) By Type (2018-2022)
Table 24 Asia Pacific Smart Safe Revenue (USD Million) By Applications (2018-2022)
Table 25 South America Smart Safe Revenue (USD Million) By Country (2018-2022)
Table 26 South America Smart Safe Revenue (USD Million) By Type (2018-2022)
Table 27 South America Smart Safe Revenue (USD Million) By Applications (2018-2022)
Table 28 Middle East and Africa Smart Safe Revenue (USD Million) By Region (2018-2022)
Table 29 Middle East and Africa Smart Safe Revenue (USD Million) By Type (2018-2022)
Table 30 Middle East and Africa Smart Safe Revenue (USD Million) By Applications (2018-2022)
Table 31 Financial Analysis
Table 32 Global Smart Safe Revenue (USD Million) By Type (2023-2030)
Table 33 Global Smart Safe Revenue Market Share (%) By Type (2023-2030)
Table 34 Global Smart Safe Revenue (USD Million) By Applications (2023-2030)
Table 35 Global Smart Safe Revenue Market Share (%) By Applications (2023-2030)
Table 36 Global Smart Safe Market Revenue (USD Million), And Revenue (USD Million) By Regions (2023-2030)
Table 37 North America Smart Safe Revenue (USD)By Country (2023-2030)
Table 38 North America Smart Safe Revenue (USD Million) By Type (2023-2030)
Table 39 North America Smart Safe Revenue (USD Million) By Applications (2023-2030)
Table 40 Europe Smart Safe Revenue (USD Million) By Country (2023-2030)
Table 41 Europe Smart Safe Revenue (USD Million) By Type (2023-2030)
Table 42 Europe Smart Safe Revenue (USD Million) By Applications (2023-2030)
Table 43 Asia Pacific Smart Safe Revenue (USD Million) By Country (2023-2030)
Table 44 Asia Pacific Smart Safe Revenue (USD Million) By Type (2023-2030)
Table 45 Asia Pacific Smart Safe Revenue (USD Million) By Applications (2023-2030)
Table 46 South America Smart Safe Revenue (USD Million) By Country (2023-2030)
Table 47 South America Smart Safe Revenue (USD Million) By Type (2023-2030)
Table 48 South America Smart Safe Revenue (USD Million) By Applications (2023-2030)
Table 49 Middle East and Africa Smart Safe Revenue (USD Million) By Region (2023-2030)
Table 50 Middle East and Africa Smart Safe Revenue (USD Million) By Region (2023-2030)
Table 51 Middle East and Africa Smart Safe Revenue (USD Million) By Type (2023-2030)
Table 52 Middle East and Africa Smart Safe Revenue (USD Million) By Applications (2023-2030)
Table 53 Research Programs/Design for This Report
Table 54 Key Data Information from Secondary Sources
Table 55 Key Data Information from Primary Sources
List of Figures
Figure 1 Market Scope
Figure 2 Porter’s Five Forces
Figure 3 Global Smart Safe Revenue (USD Million) By Type (2018-2022)
Figure 4 Global Smart Safe Revenue Market Share (%) By Type (2022)
Figure 5 Global Smart Safe Revenue (USD Million) By Applications (2018-2022)
Figure 6 Global Smart Safe Revenue Market Share (%) By Applications (2022)
Figure 7 Global Smart Safe Market Revenue (USD Million) By Regions (2018-2022)
Figure 8 Global Smart Safe Market Share (%) By Regions (2022)
Figure 9 North America Smart Safe Revenue (USD Million) By Country (2018-2022)
Figure 10 North America Smart Safe Revenue (USD Million) By Type (2018-2022)
Figure 11 North America Smart Safe Revenue (USD Million) By Applications (2018-2022)
Figure 12 Europe Smart Safe Revenue (USD Million) By Country (2018-2022)
Figure 13 Europe Smart Safe Revenue (USD Million) By Type (2018-2022)
Figure 14 Europe Smart Safe Revenue (USD Million) By Applications (2018-2022)
Figure 15 Asia Pacific Smart Safe Revenue (USD Million) By Country (2018-2022)
Figure 16 Asia Pacific Smart Safe Revenue (USD Million) By Type (2018-2022)
Figure 17 Asia Pacific Smart Safe Revenue (USD Million) By Applications (2018-2022)
Figure 18 South America Smart Safe Revenue (USD Million) By Country (2018-2022)
Figure 19 South America Smart Safe Revenue (USD Million) By Type (2018-2022)
Figure 20 South America Smart Safe Revenue (USD Million) By Applications (2018-2022)
Figure 21 Middle East and Africa Smart Safe Revenue (USD Million) By Region (2018-2022)
Figure 22 Middle East and Africa Smart Safe Revenue (USD Million) By Type (2018-2022)
Figure 23 Middle East and Africa Smart Safe Revenue (USD Million) By Applications (2018-2022)
Figure 24 Global Smart Safe Revenue (USD Million) By Type (2023-2030)
Figure 25 Global Smart Safe Revenue Market Share (%) By Type (2030)
Figure 26 Global Smart Safe Revenue (USD Million) By Applications (2023-2030)
Figure 27 Global Smart Safe Revenue Market Share (%) By Applications (2030)
Figure 28 Global Smart Safe Market Revenue (USD Million) By Regions (2023-2030)
Figure 29 North America Smart Safe Revenue (USD Million) By Country (2023-2030)
Figure 30 North America Smart Safe Revenue (USD Million) By Type (2023-2030)
Figure 31 North America Smart Safe Revenue (USD Million) By Applications (2023-2030)
Figure 32 Europe Smart Safe Revenue (USD Million) By Country (2023-2030)
Figure 33 Europe Smart Safe Revenue (USD Million) By Type (2023-2030)
Figure 34 Europe Smart Safe Revenue (USD Million) By Applications (2023-2030)
Figure 35 Asia Pacific Smart Safe Revenue (USD Million) By Country (2023-2030)
Figure 36 Asia Pacific Smart Safe Revenue (USD Million) By Type (2023-2030)
Figure 37 Asia Pacific Smart Safe Revenue (USD Million) By Applications (2023-2030)
Figure 38 South America Smart Safe Revenue (USD Million) By Country (2023-2030)
Figure 39 South America Smart Safe Revenue (USD Million) By Type (2023-2030)
Figure 40 South America Smart Safe Revenue (USD Million) By Applications (2023-2030)
Figure 41 Middle East and Africa Smart Safe Revenue (USD Million) By Region (2023-2030)
Figure 42 Middle East and Africa Smart Safe Revenue (USD Million) By Region (2023-2030)
Figure 43 Middle East and Africa Smart Safe Revenue (USD Million) By Type (2023-2030)
Figure 44 Middle East and Africa Smart Safe Revenue (USD Million) By Applications (2023-2030)
Figure 45 Bottom-Up and Top-Down Approaches For This Report
Figure 46 Data Triangulation
